rokkuran / EpidemicSimulations.jl

Graph based epidemic simulations.

Geek Repo:Geek Repo

Github PK Tool:Github PK Tool

Epidemic Simulations

Work in progress. Contains basic examples of SIR, SIS, SEIR and SIRC models on a given graph.

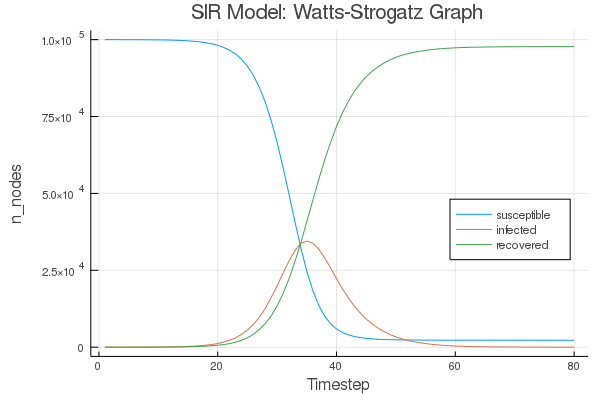
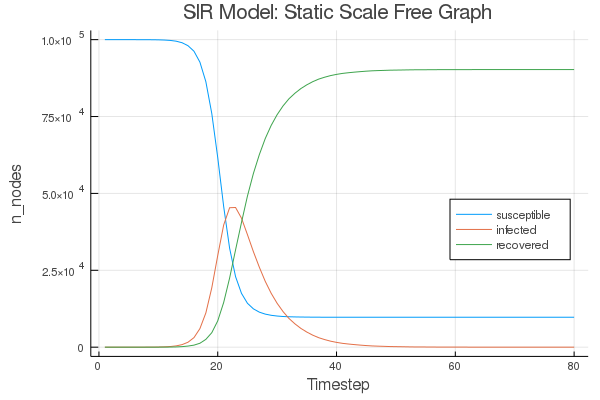
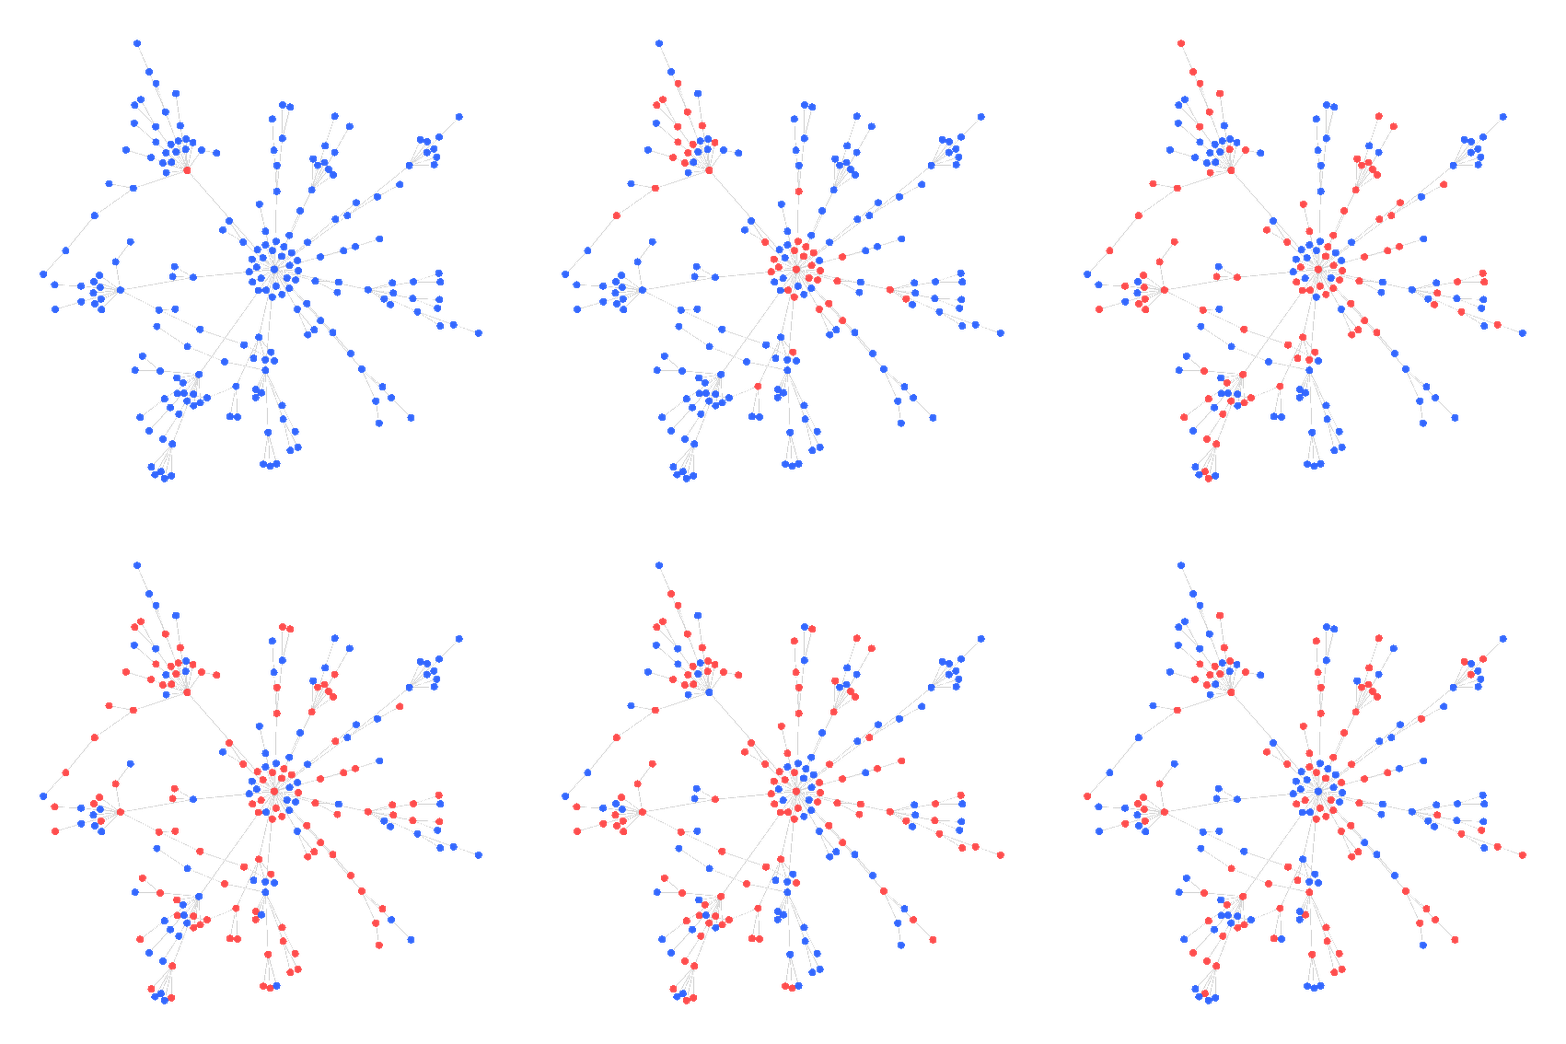
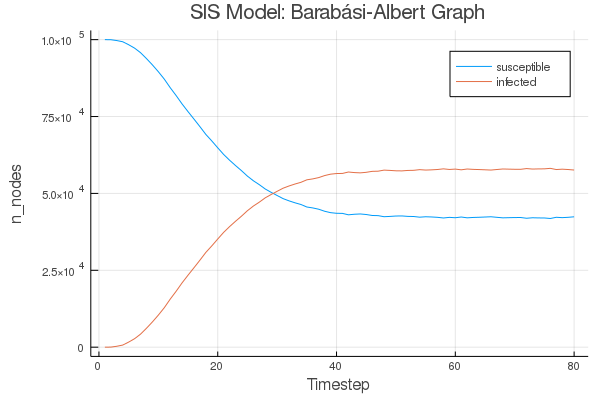
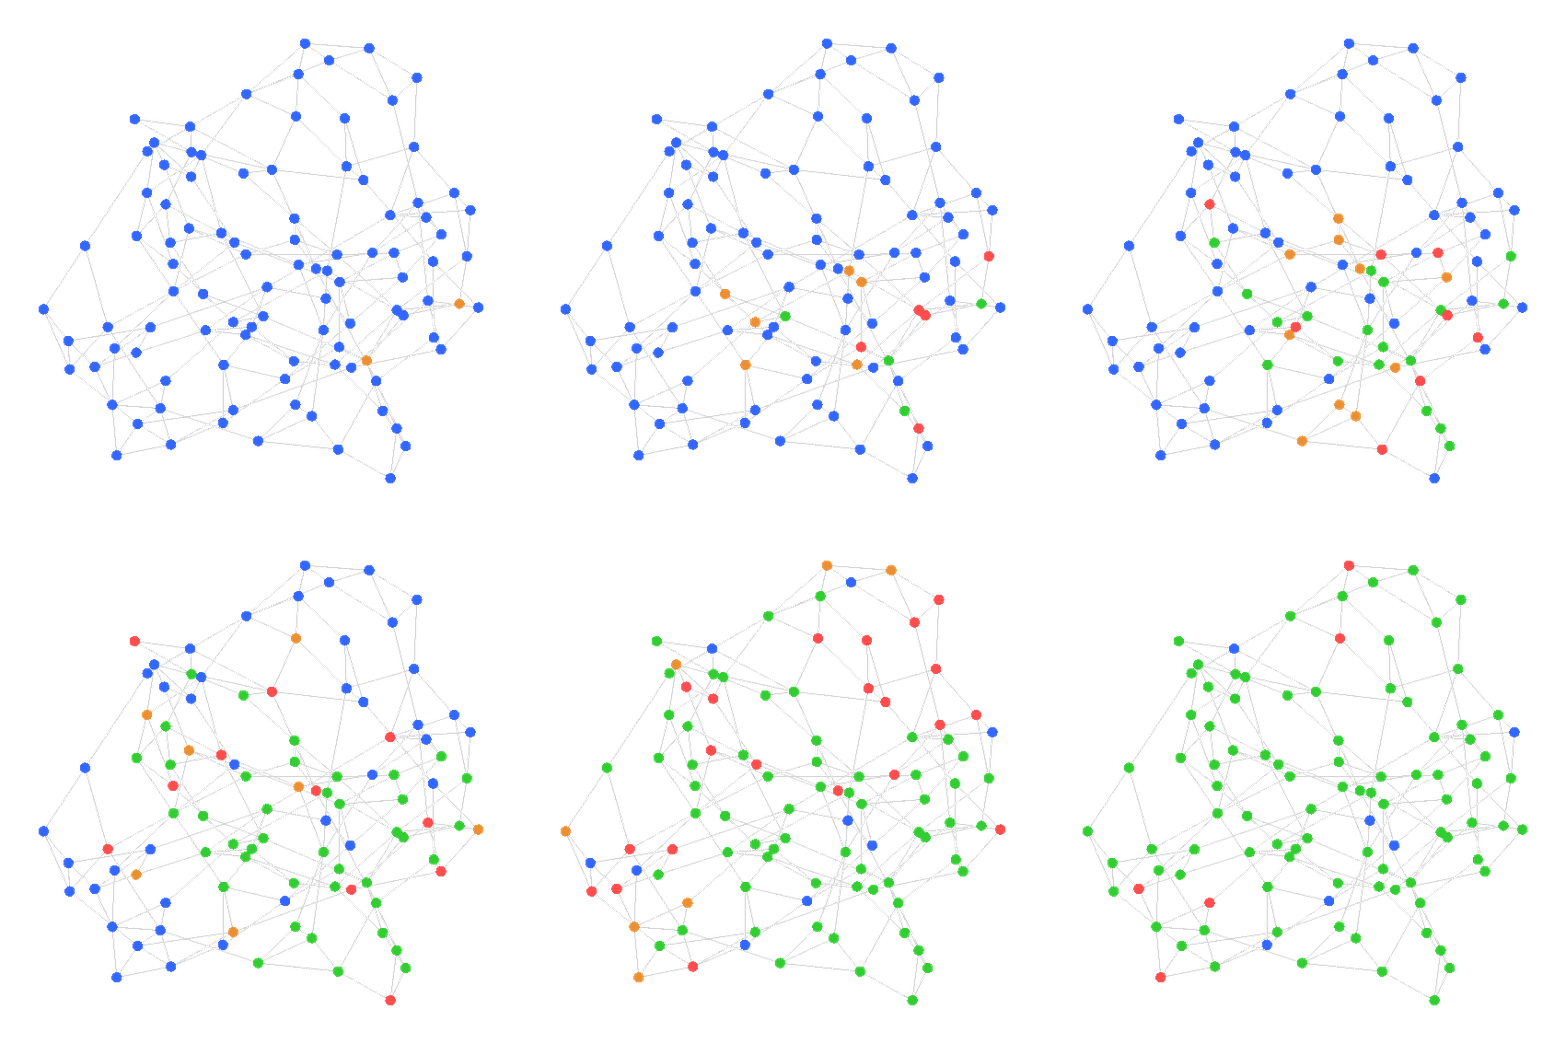
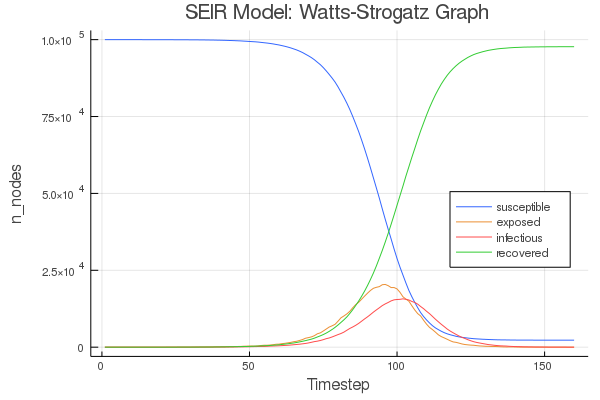
All of the following simulations are using an infection probability of 0.33 and a recovery probability of 0.20. The time series plots have a much higher node count of 100k; the graph animations all have 200 nodes. SEIR and SIRC have a couple of additonal parameters.

Example running:

G = static_scale_free(200, 400, 2.5)

model = SIR()
initialise!(model, G, 80)
simulate!(model)

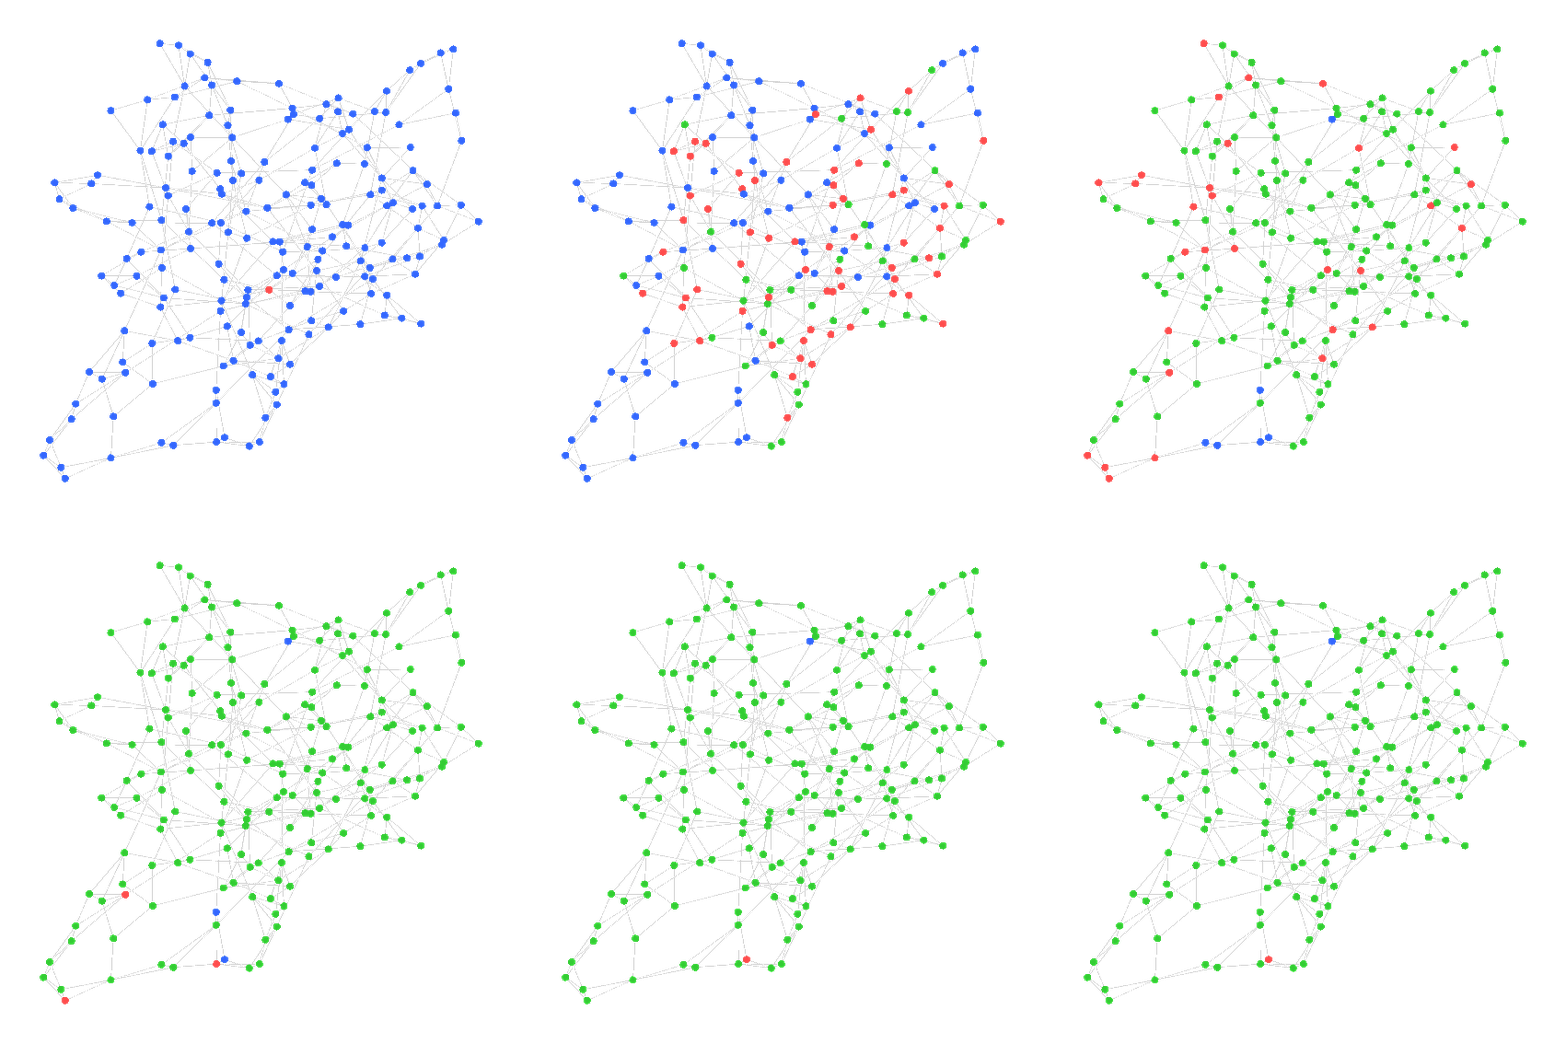
SIR Watts-Strogatz

G = watts_strogatz(200, 4, 0.2)

sir_watts_strogatz_gif

sir_watts_strogatz_png

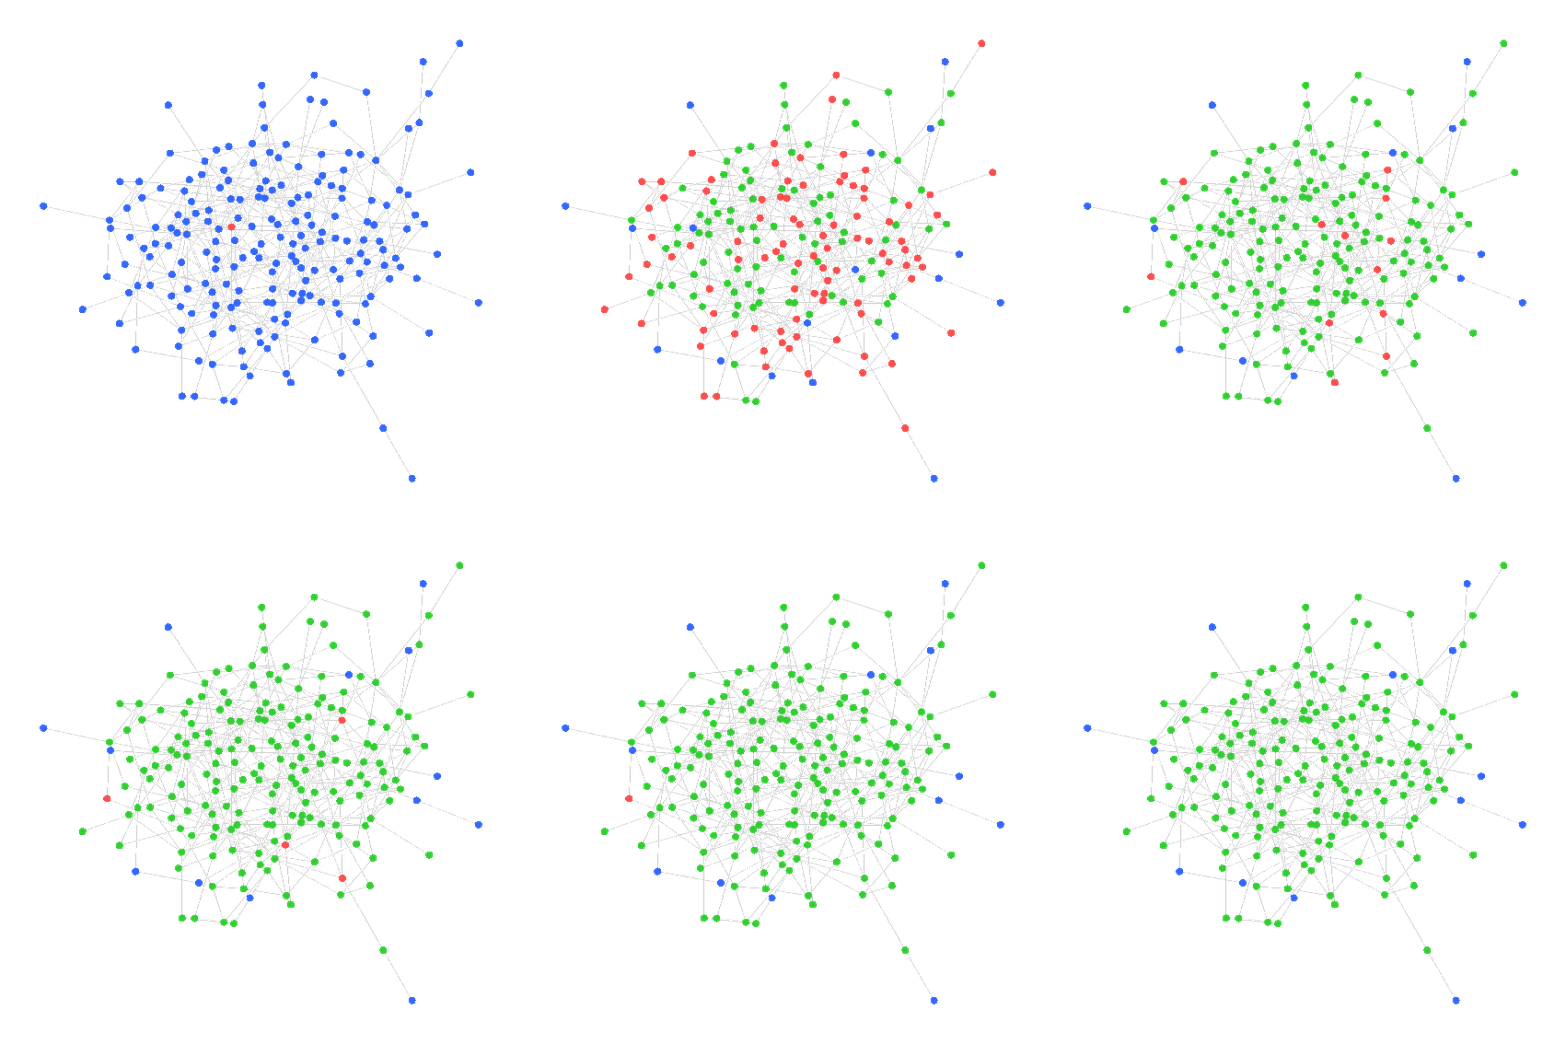
SIR Static Scale Free

G = static_scale_free(200, 400, 2.5)

sir_static_scale_free_gif

sir_static_scale_free_png

SIS Barabási-Albert

G = barabasi_albert(200, 1)

sis_barabasi_albert_gif

sis_barabasi_albert_png

SEIR Watts-Strogatz

seir_watts_strogatz_gif

seir_watts_strogatz_png

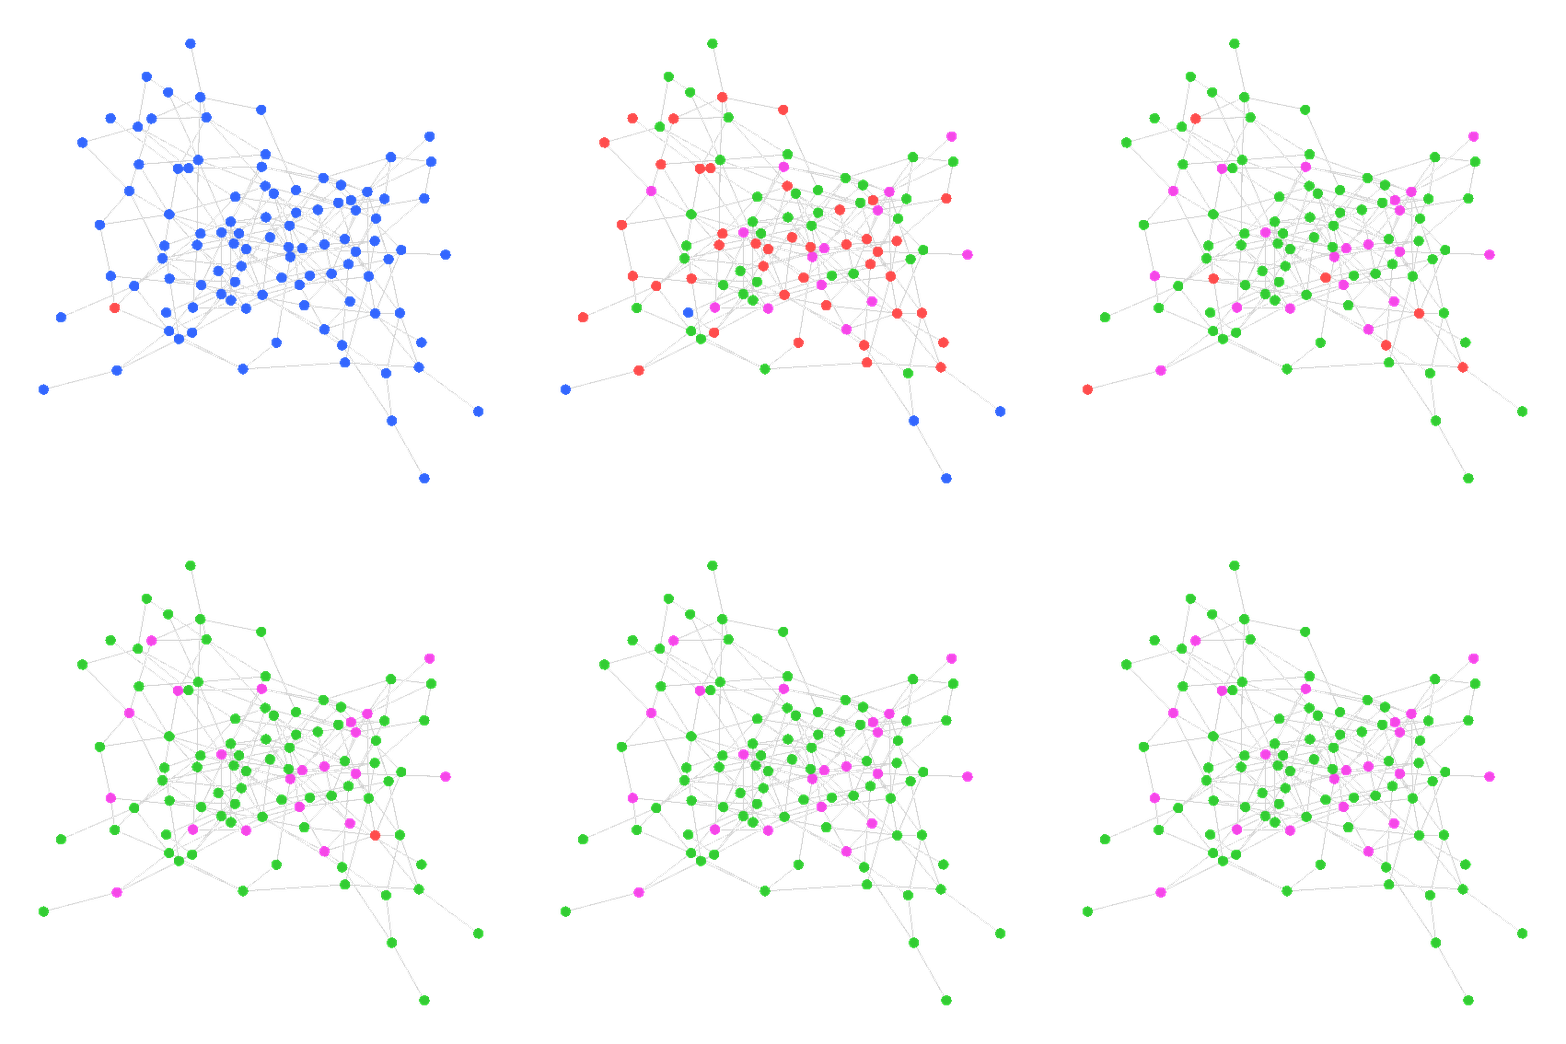
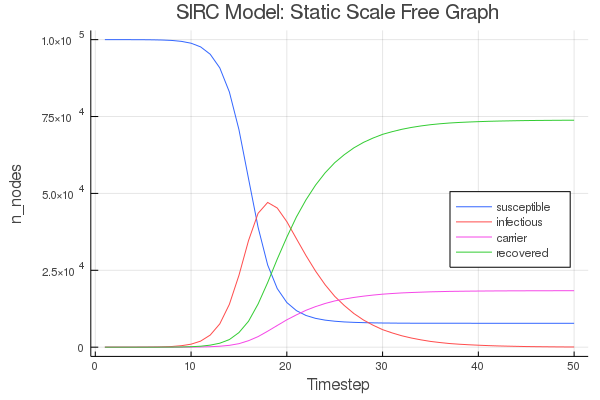
SIRC Static Scale Free

sirc_static_scale_free_gif

sirc_static_scale_free_png

About

Graph based epidemic simulations.


Languages

Language:Julia 100.0%