![]()
- Introduction
- Quickstart
- Dependencies
- Ways to run Multioviz through the command line
- Input requirements
- Visualize enriched molecular features as a GRN
- Generate a perturbable GRN to test hypotheses in-silico
- Integrate computational method
Multioviz is a free, user-friendly, interactive platform that facilitates in-silico hypothesis testing by combining computational inference of gene regulatory network (GRN) architectures with interactive visualization and perturbation. To generate a perturbable GRN, users can input either individual or population level multiomics data in addition to corresponding phenotypic data. Users can also directly visualize GRNs by directly inputting prioritized lists of molecular features along with mapping data between and within molecular levels the features belong to. We provide an R package version of Multioviz that allows programmers to integrate any computational method that performs feature selection and prioritization, generalizing our platform to accept and model different genomic datasets at multiple molecular scales. Visit Multioviz at https://multioviz.ccv.brown.edu/.

Users can (1) visualize significant molecular variable as GRNs (see steps here) and (2) perturb GRNs for in silico hypothesis testing (see steps here). The user can also (3) integrate their own computational method that performs feature selection and perturbation through the multioviz R package (see steps here).
- For (1), to quickly visualize a GRN, press "Load Demo Files" and press "RUN" to see the GRN!
- To load your own data, under the "Visualize" drop down (side bar), upload the required inputs, set network preferences, and click "RUN" to visualize the user's data. See the visualization instructions for a detailed walk-through.
- For (2), to quickly perturb a GRN, press "Load Demo Files" and press "RUN" to see the GRN, followed by clicking any node, then clicking "Edit" to "Delete" or "Edit" the node. Then click "RERUN".
- To load your own data, under the "Perturb" drown down (side bar), upload the required inputs, and click "RUN" to generate the network. For a detailed walk through on how to perturb and rerun the user's network, visit the perturbation section.
- For (3), once the multioviz package is installed, open a new R session (
R) and load the package (library multioviz). RunrunMultioviz()with no arguments to generate a demo network, and with the required arguments to generate a network using the user's own method. Visit the method integration section for more detailed instructions.
Please note that there is a maximum file size limit of 32MB for file uploads on this platform. Files exceeding this limit will cause an error, and not be accepted. If you encounter any issues related to this limit, please consider ways to reduce your file size, or reach out for assistance.
- R (>= 4.1.2)
- BANN (>= 0.1.0)
- shiny (>= 1.7.1)
- visNetwork (>= 2.1.0)
- igraph (>= 1.3.5)
- dplyr (>= 1.0.2)
- shinyBS (>= 0.61)
- shinythemes (>= 1.2.0)
- shinydashboard (>= 0.7.2)
- shinydashboardPlus (>= 2.0.3)
- shinyWidgets (>= 0.7.4)
- shinyjs (>= 2.1.0)
- shinyalert (>= 3.0.0)
- data.table (>= 1.14.6)
- Pull docker image
docker pull ashleymaeconard/multioviz - Run docker image
docker run -p 3838:3838 multioviz
- Clone multio-viz repository
git clone git@github.com:lcrawlab/multio-viz.git - Setup dependencies
sh setupMultioviz.sh - Within multio-viz directory, run
Rscript runMultioviz.R
- Clone multio-viz repository
git clone git@github.com:lcrawlab/multio-viz.git - Within multio-viz directory, run
R CMD INSTALL multioviz_0.0.0.9000.tar.gz - In R session, load package
library multiovizto use the runMultioviz() function
- Molecular Level 1 (ML1): a dataframe with columns for the 'id' and 'score' of each variable in molecular level 1
- Molecular Level 2 (ML2): a dataframe with columns for the 'id' and 'score' of each variable in molecular level 2
- Map: a dataframe with 'from' and 'to' columns to map features in ML1 to features in ML2

- X: a N x J dimensional matrix where N is the number of patient samples and J is the size of the set of molecular features for molecular level one (no row/column names)
- y: a N-dimensional matrix of quantitative traits for a sample of patients (no row/column names)
- mask: a J x G matrix of pre-defined annotations where J is the number of molecular features for molecular level 1 and G is the number of molecular features for molecular level 2 (row/column names optional)

- Computational method performs feature selection and prioritization
- The script with your method should call
runModel()function that- has parameters for required inputs (see B. Perturb figure depicting X, y, mask) (# step 1)
- runs the user's method (# step 2)
- returns ML1, ML2, and Map (see B. Perturb figure depicting molecular level 1 (SNPs) (ML1), molecular level 2 (genes) (ML2), and mapping between molecular levels) (# step 3)
As an example, the script could look something like, where we run BANNs as our example computational method:
runModel <- function(X_input, y_input, mask_input) { # step 1

  # run your computational method
  res = BANN(X_input, mask_input, y_input, centered=FALSE, show_progress = TRUE) # step 2

  # convert method output to ML1, ML2, and map

  lst = list()
  lst$ML1 = ML1_pips
  lst$ML2 = ML2_pips # step 3
  lst$map = btw_ML_map
  return(lst)
}
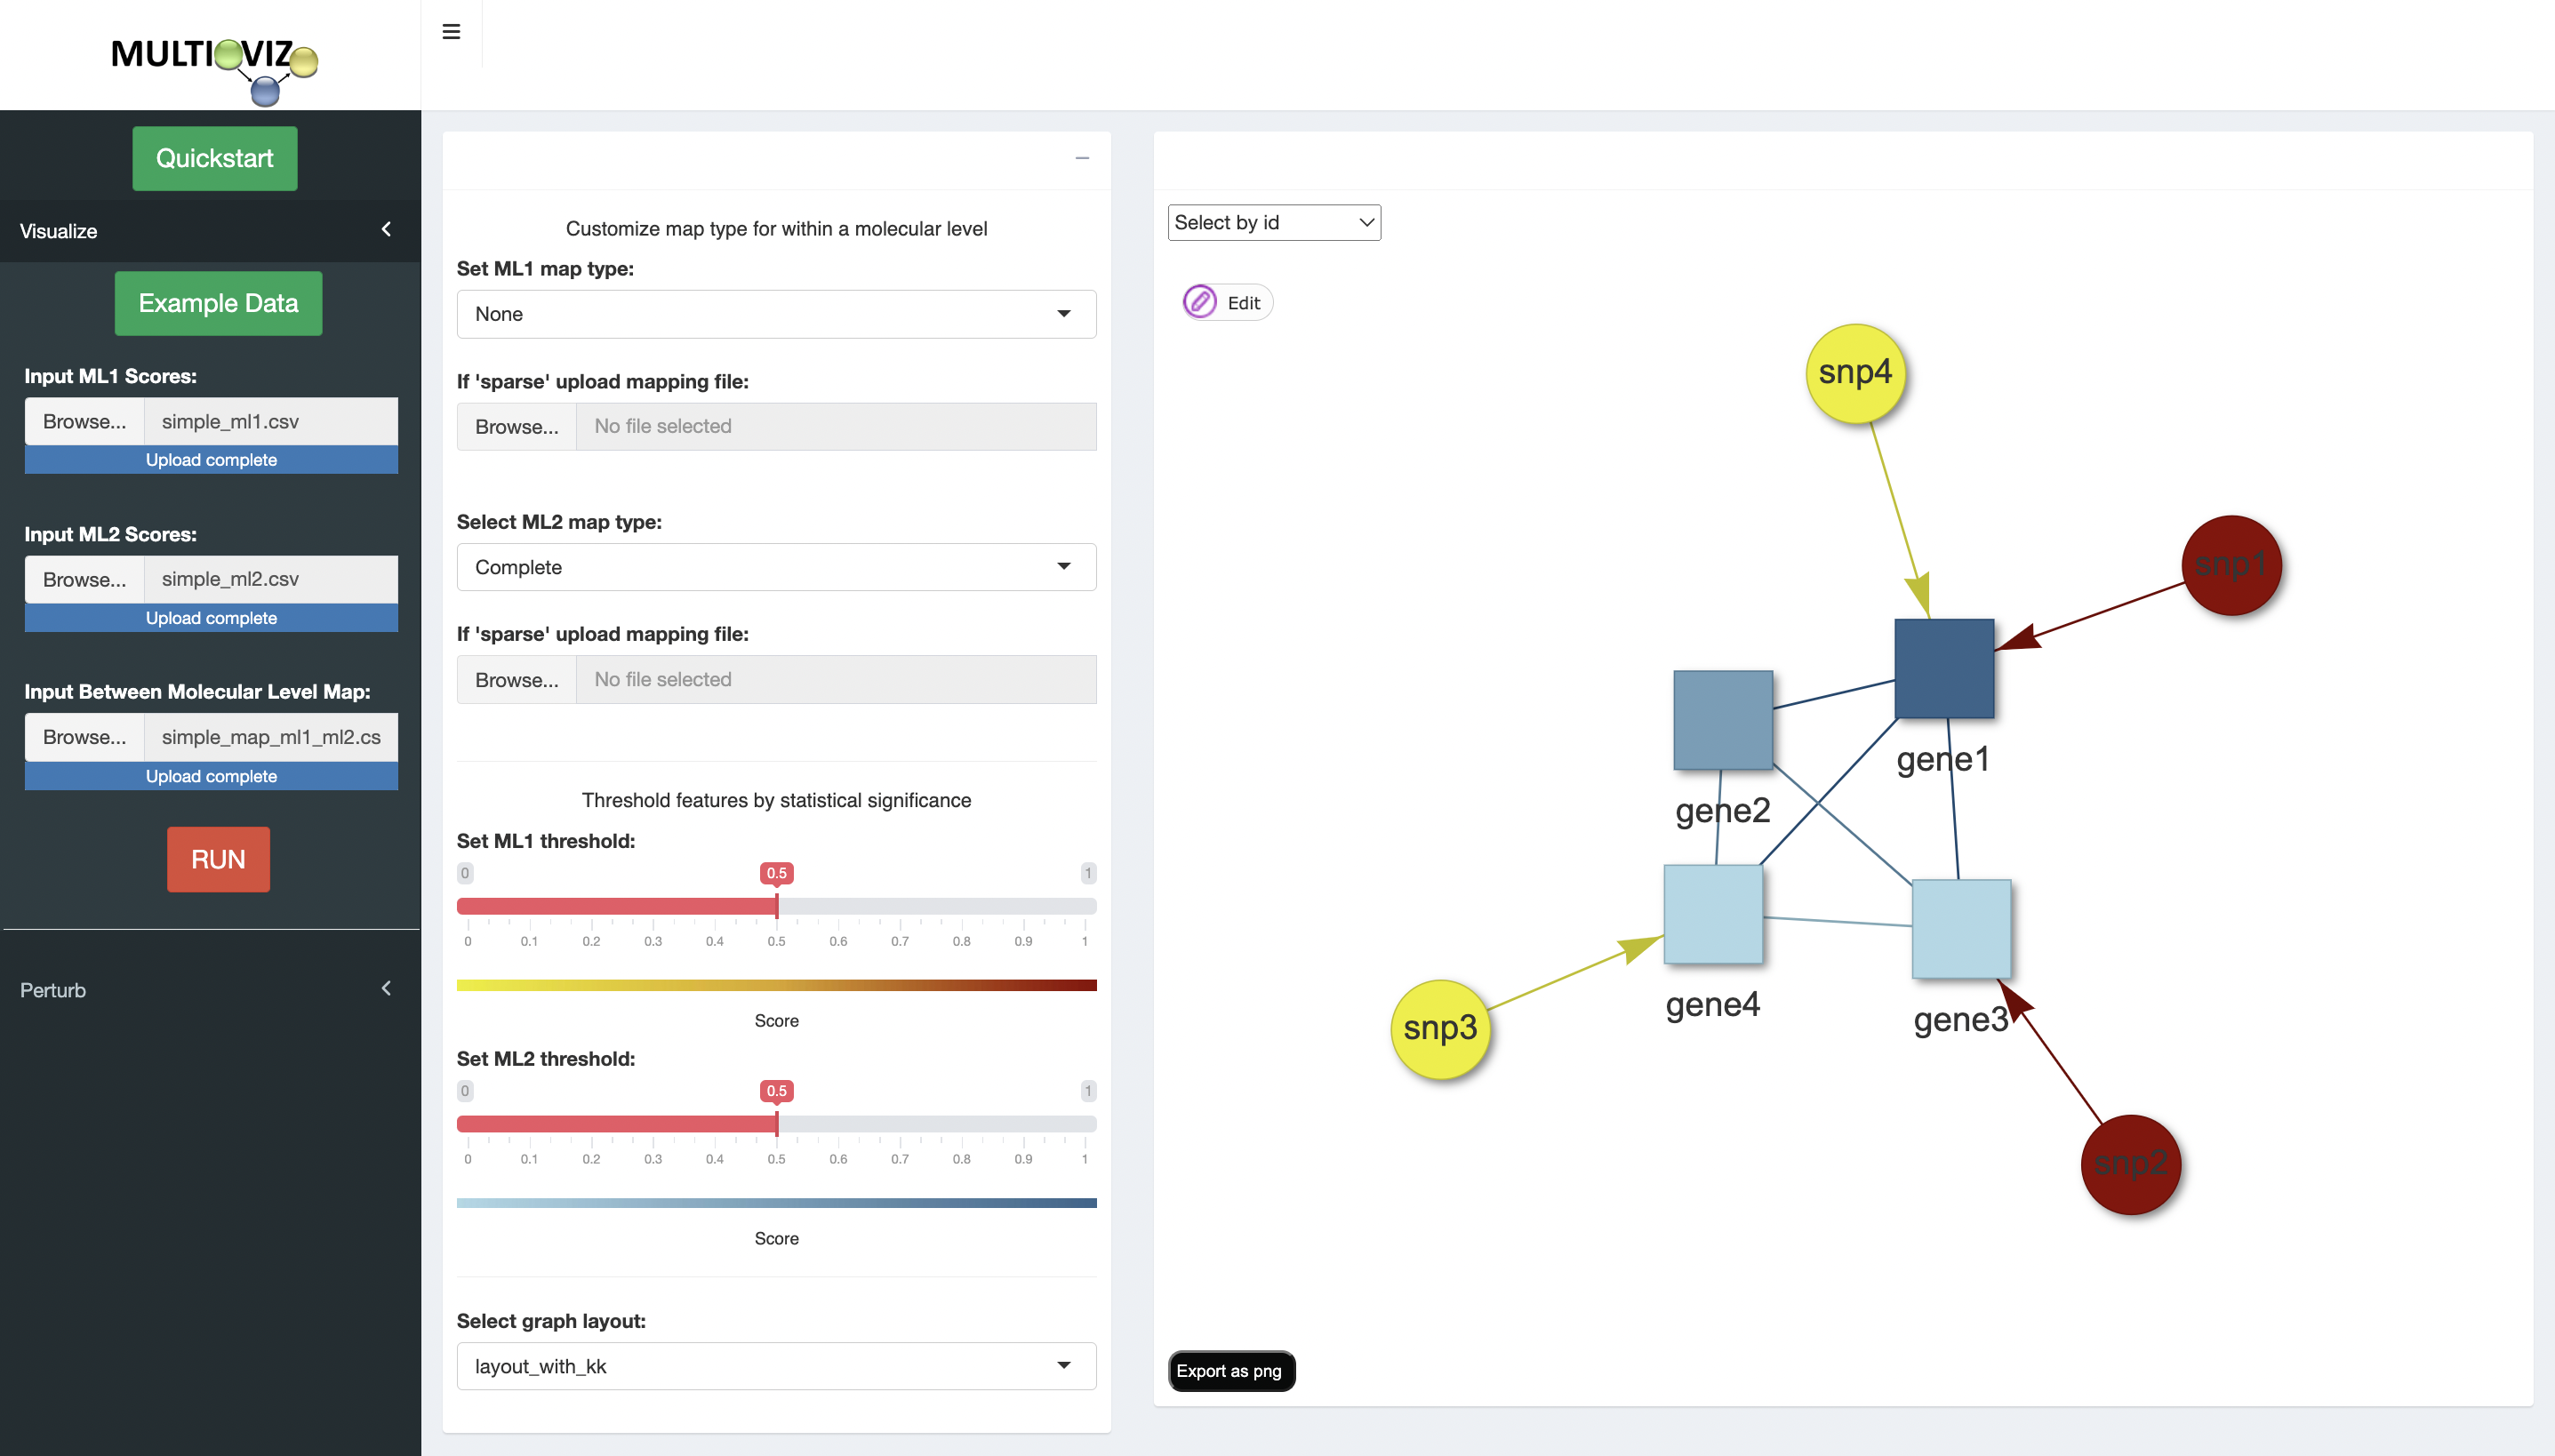
To facilitate in silico hypothesis generation, Multioviz allows users to visualize ranked lists and maps of enriched molecular features for a given phenotypic state as GRNs.

- Click on the visualization drop down (side bar)
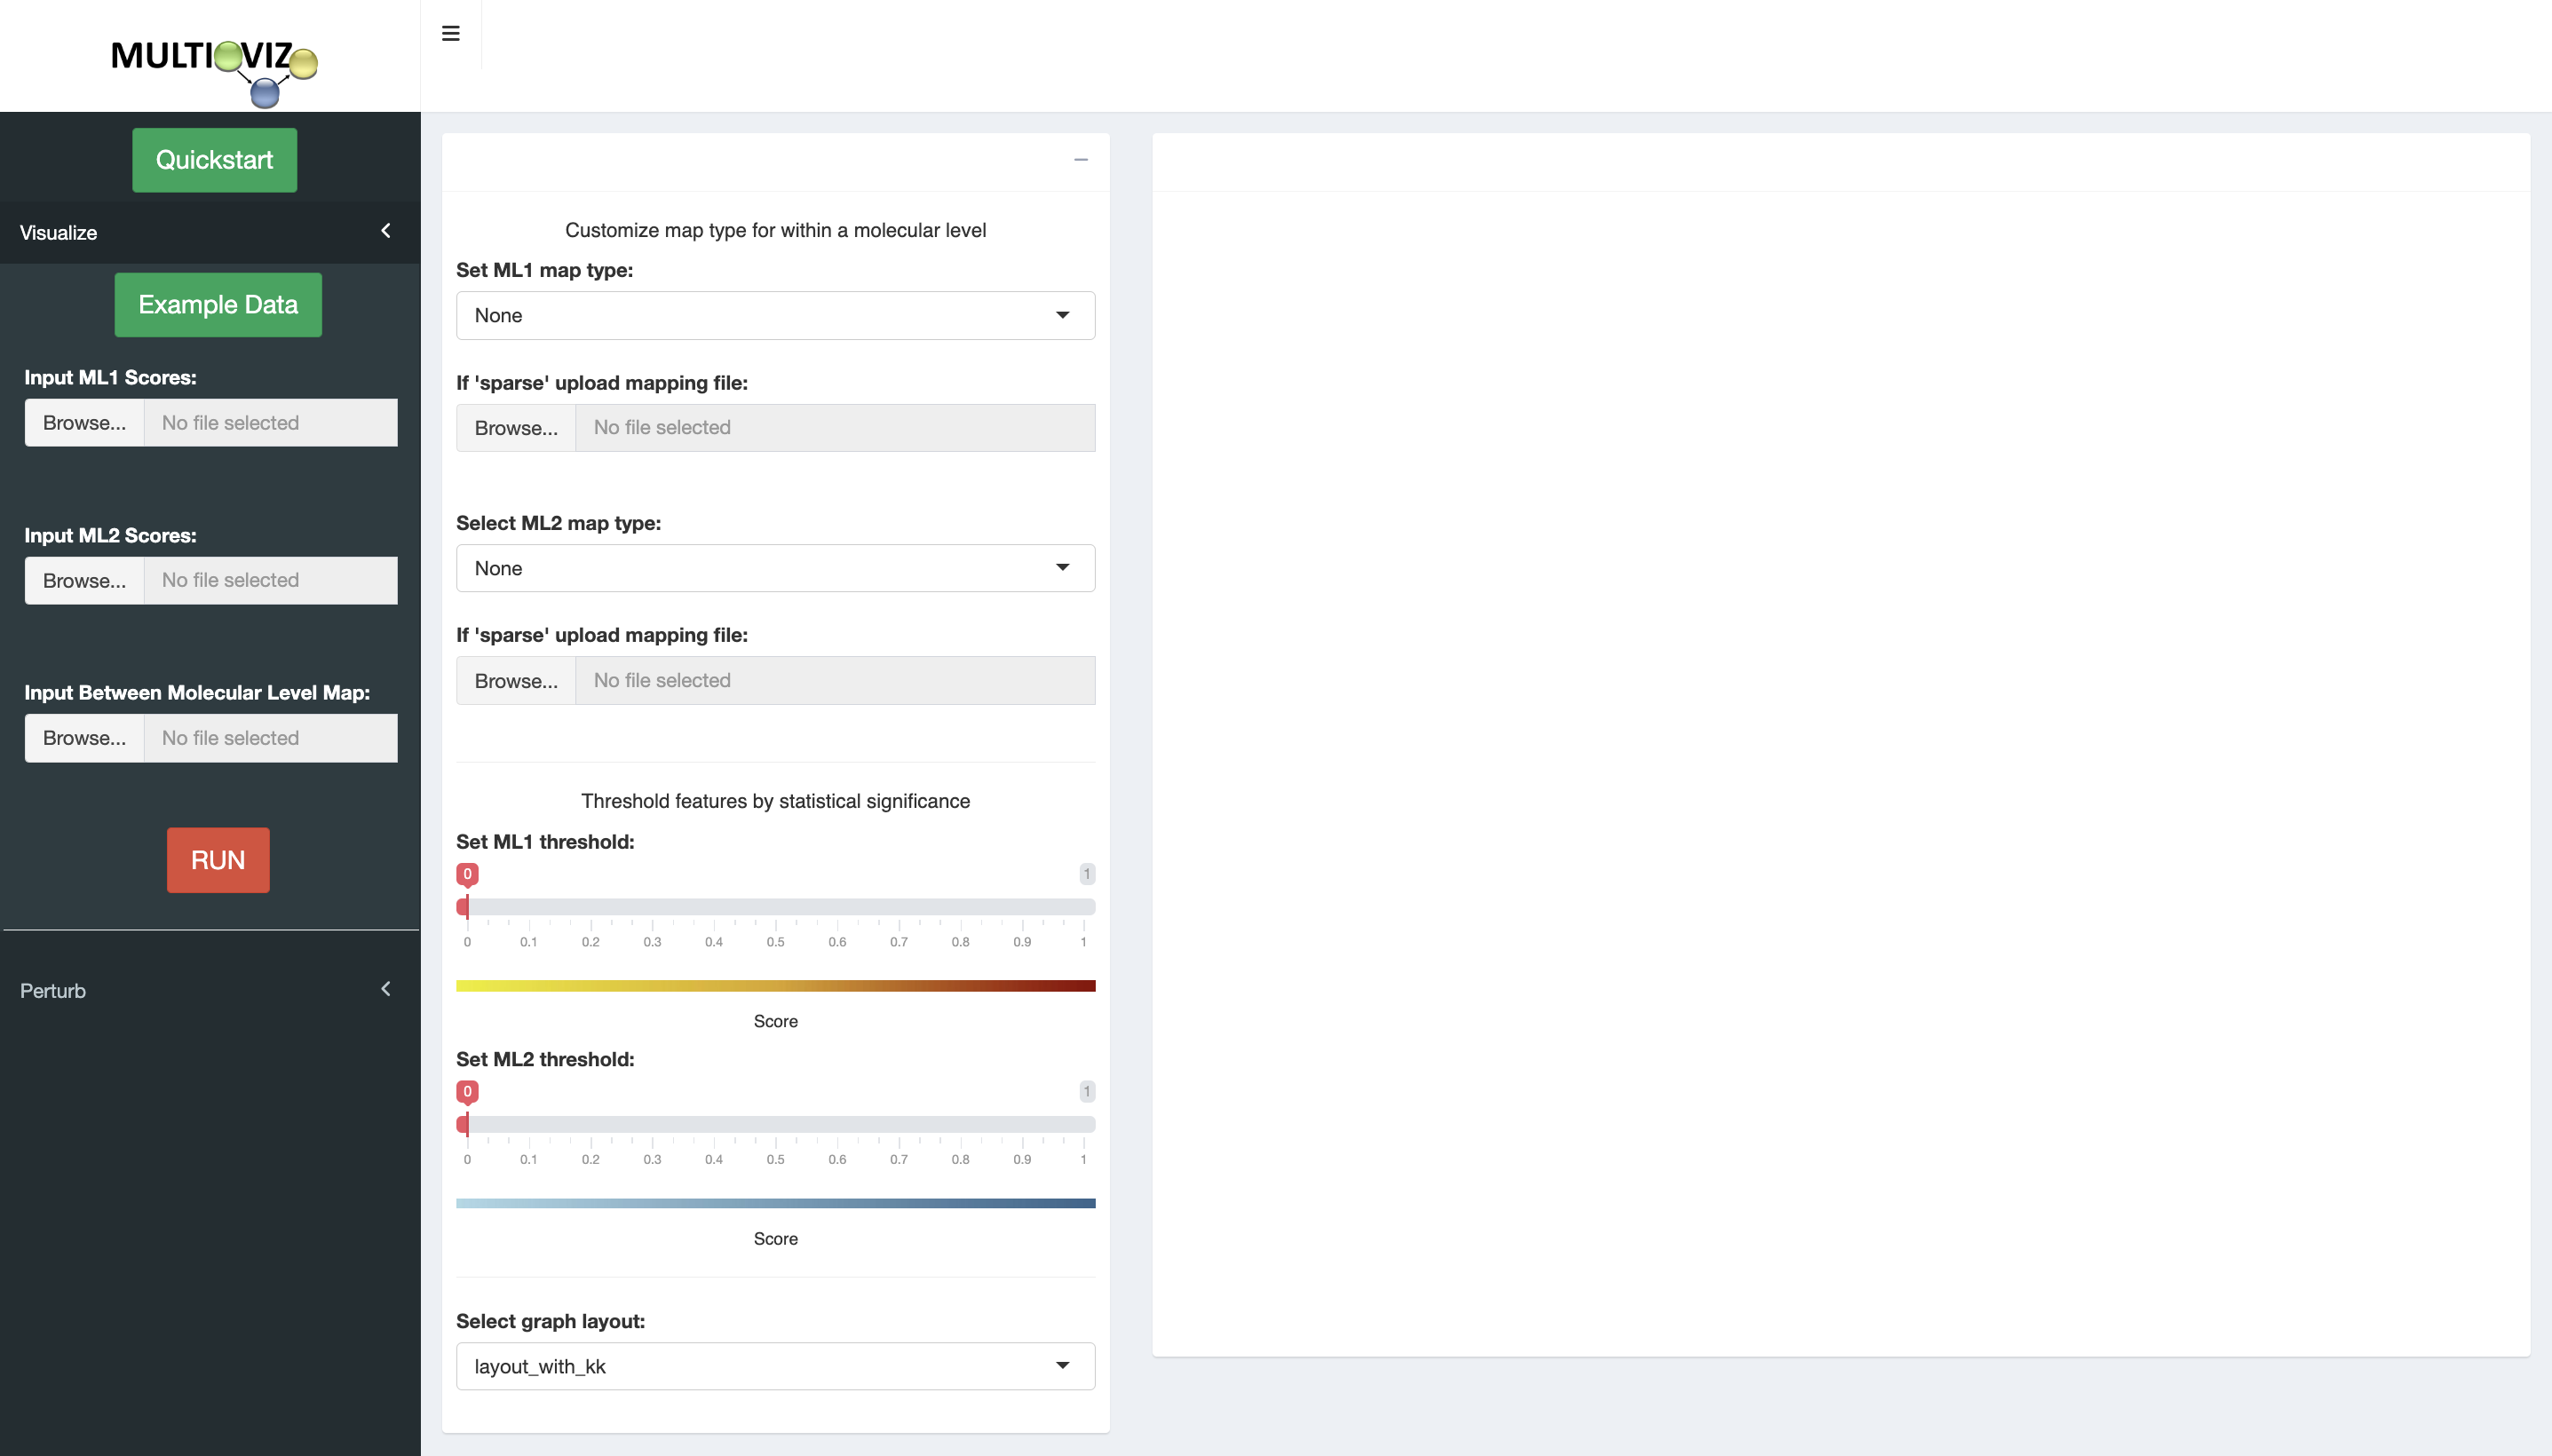
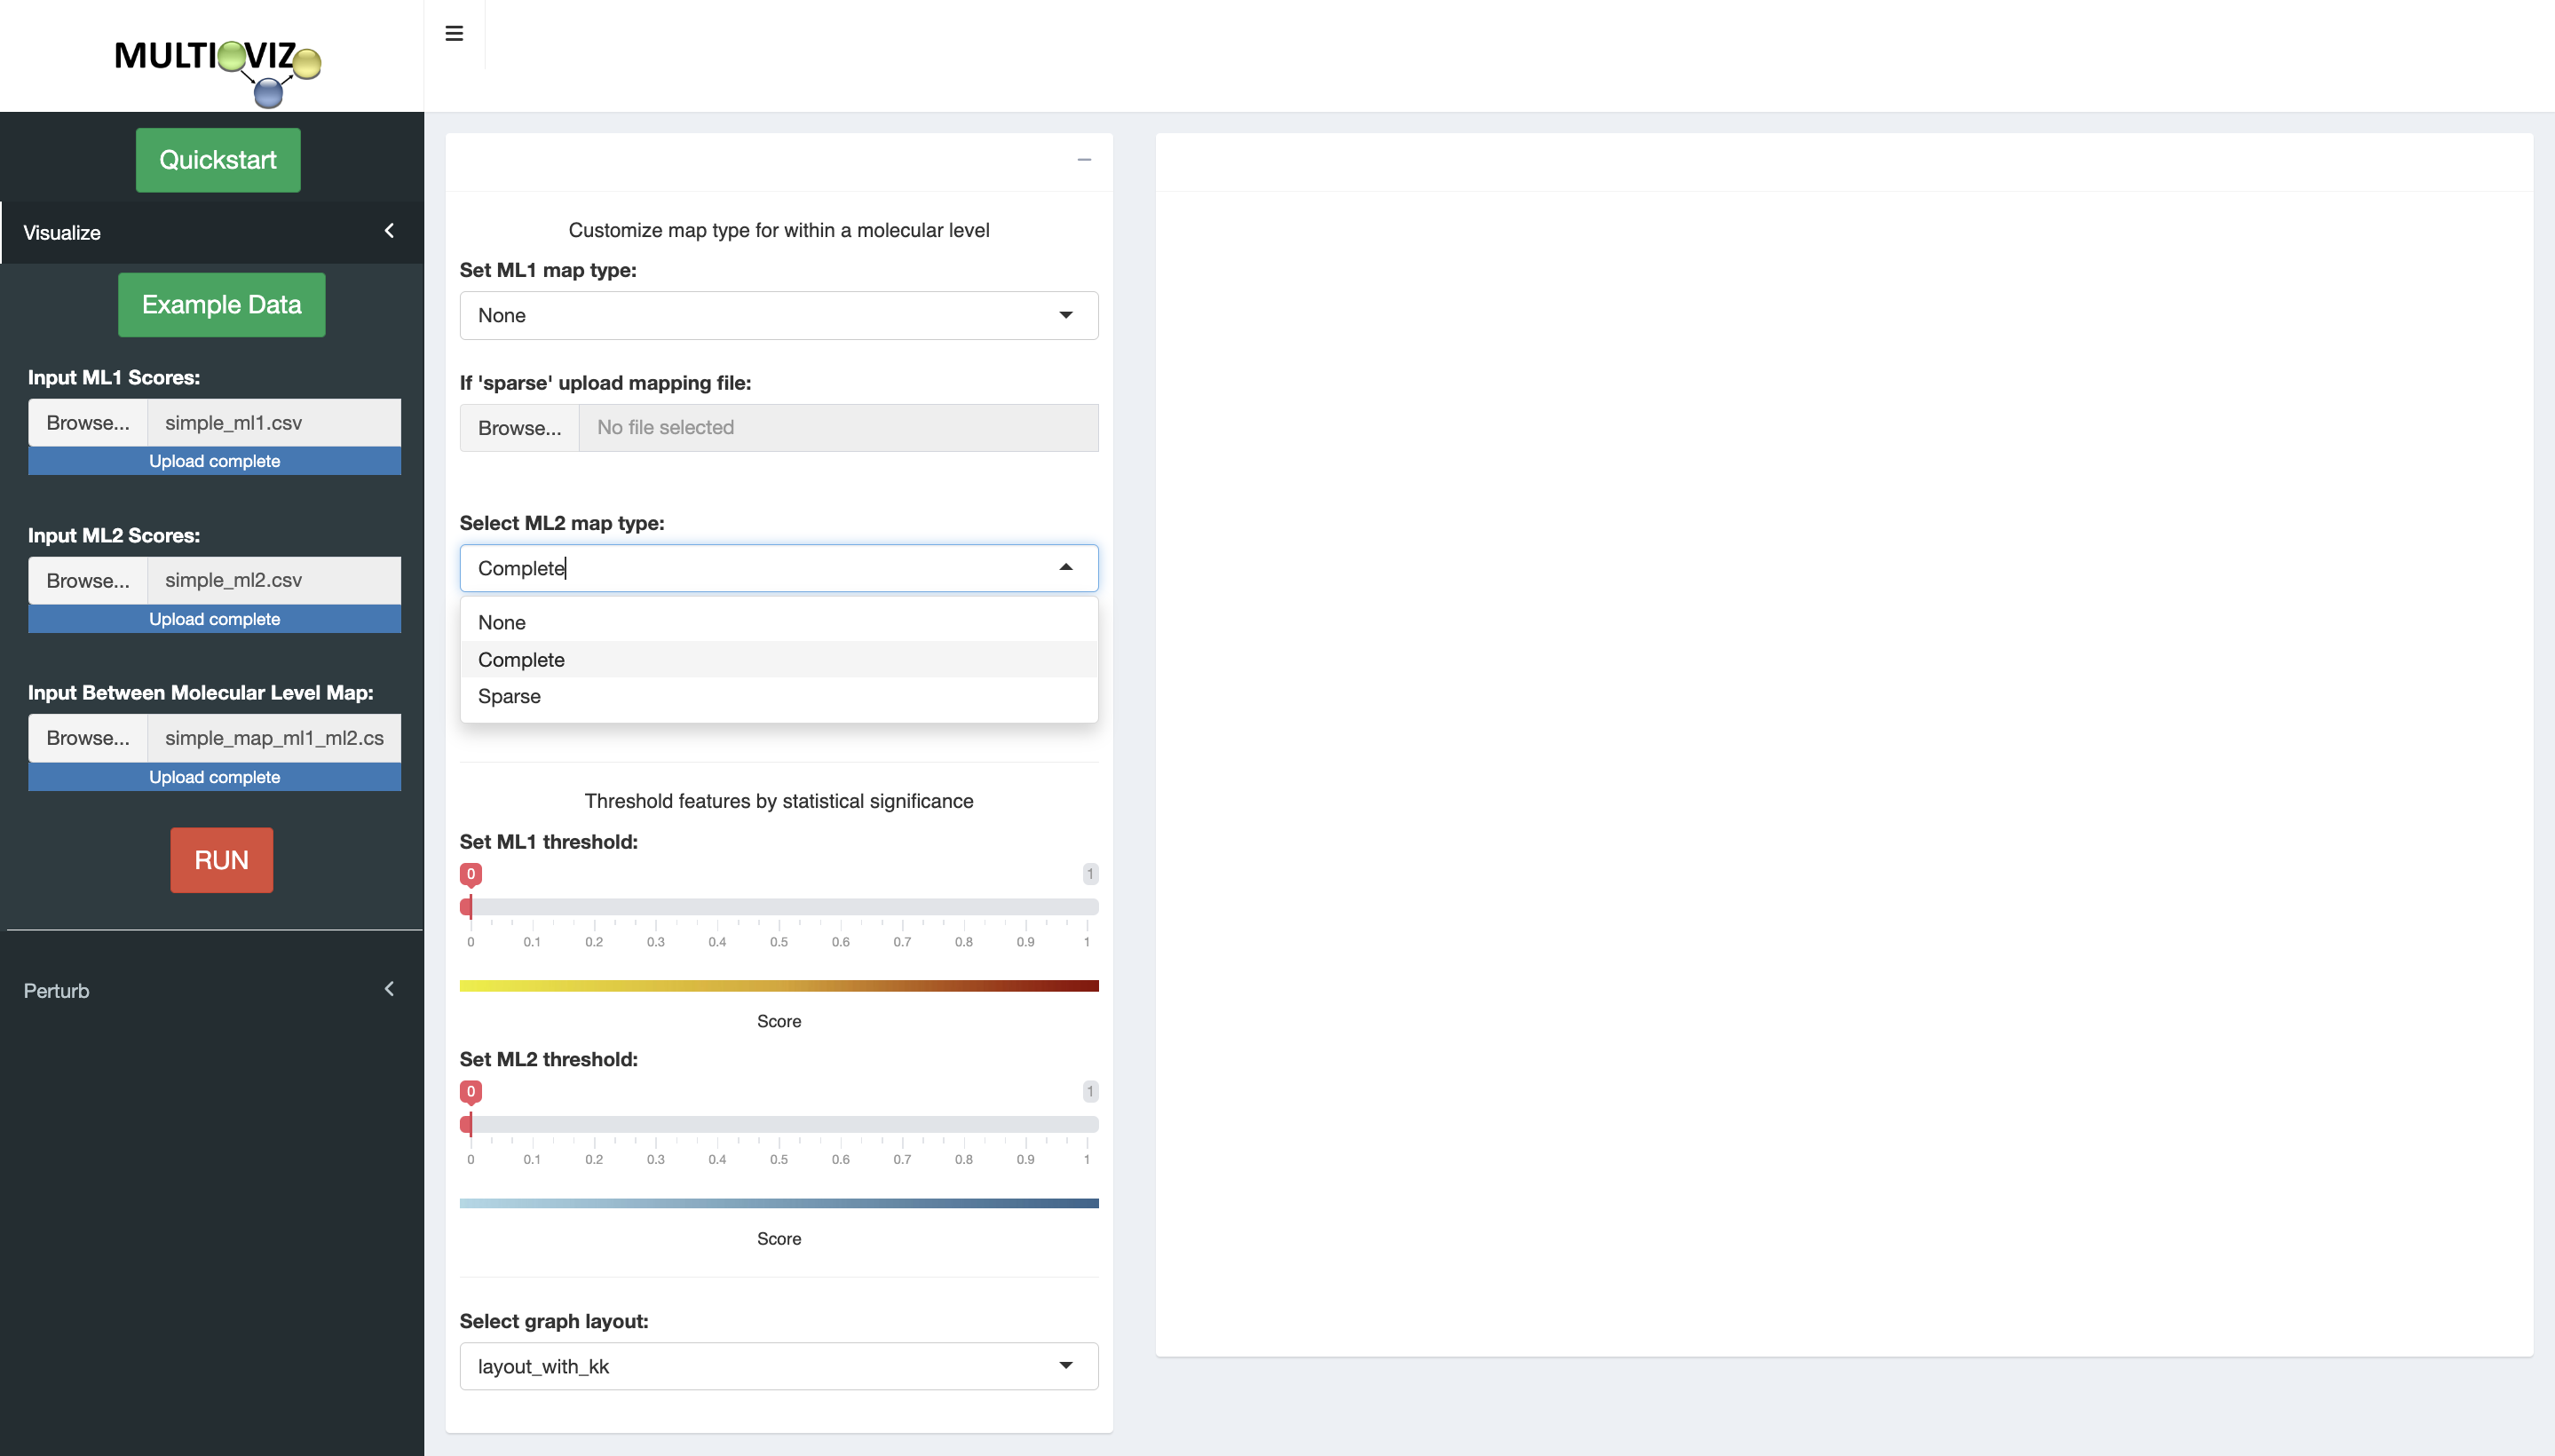
- Input files for ML1, ML2, and maps between molecular levels

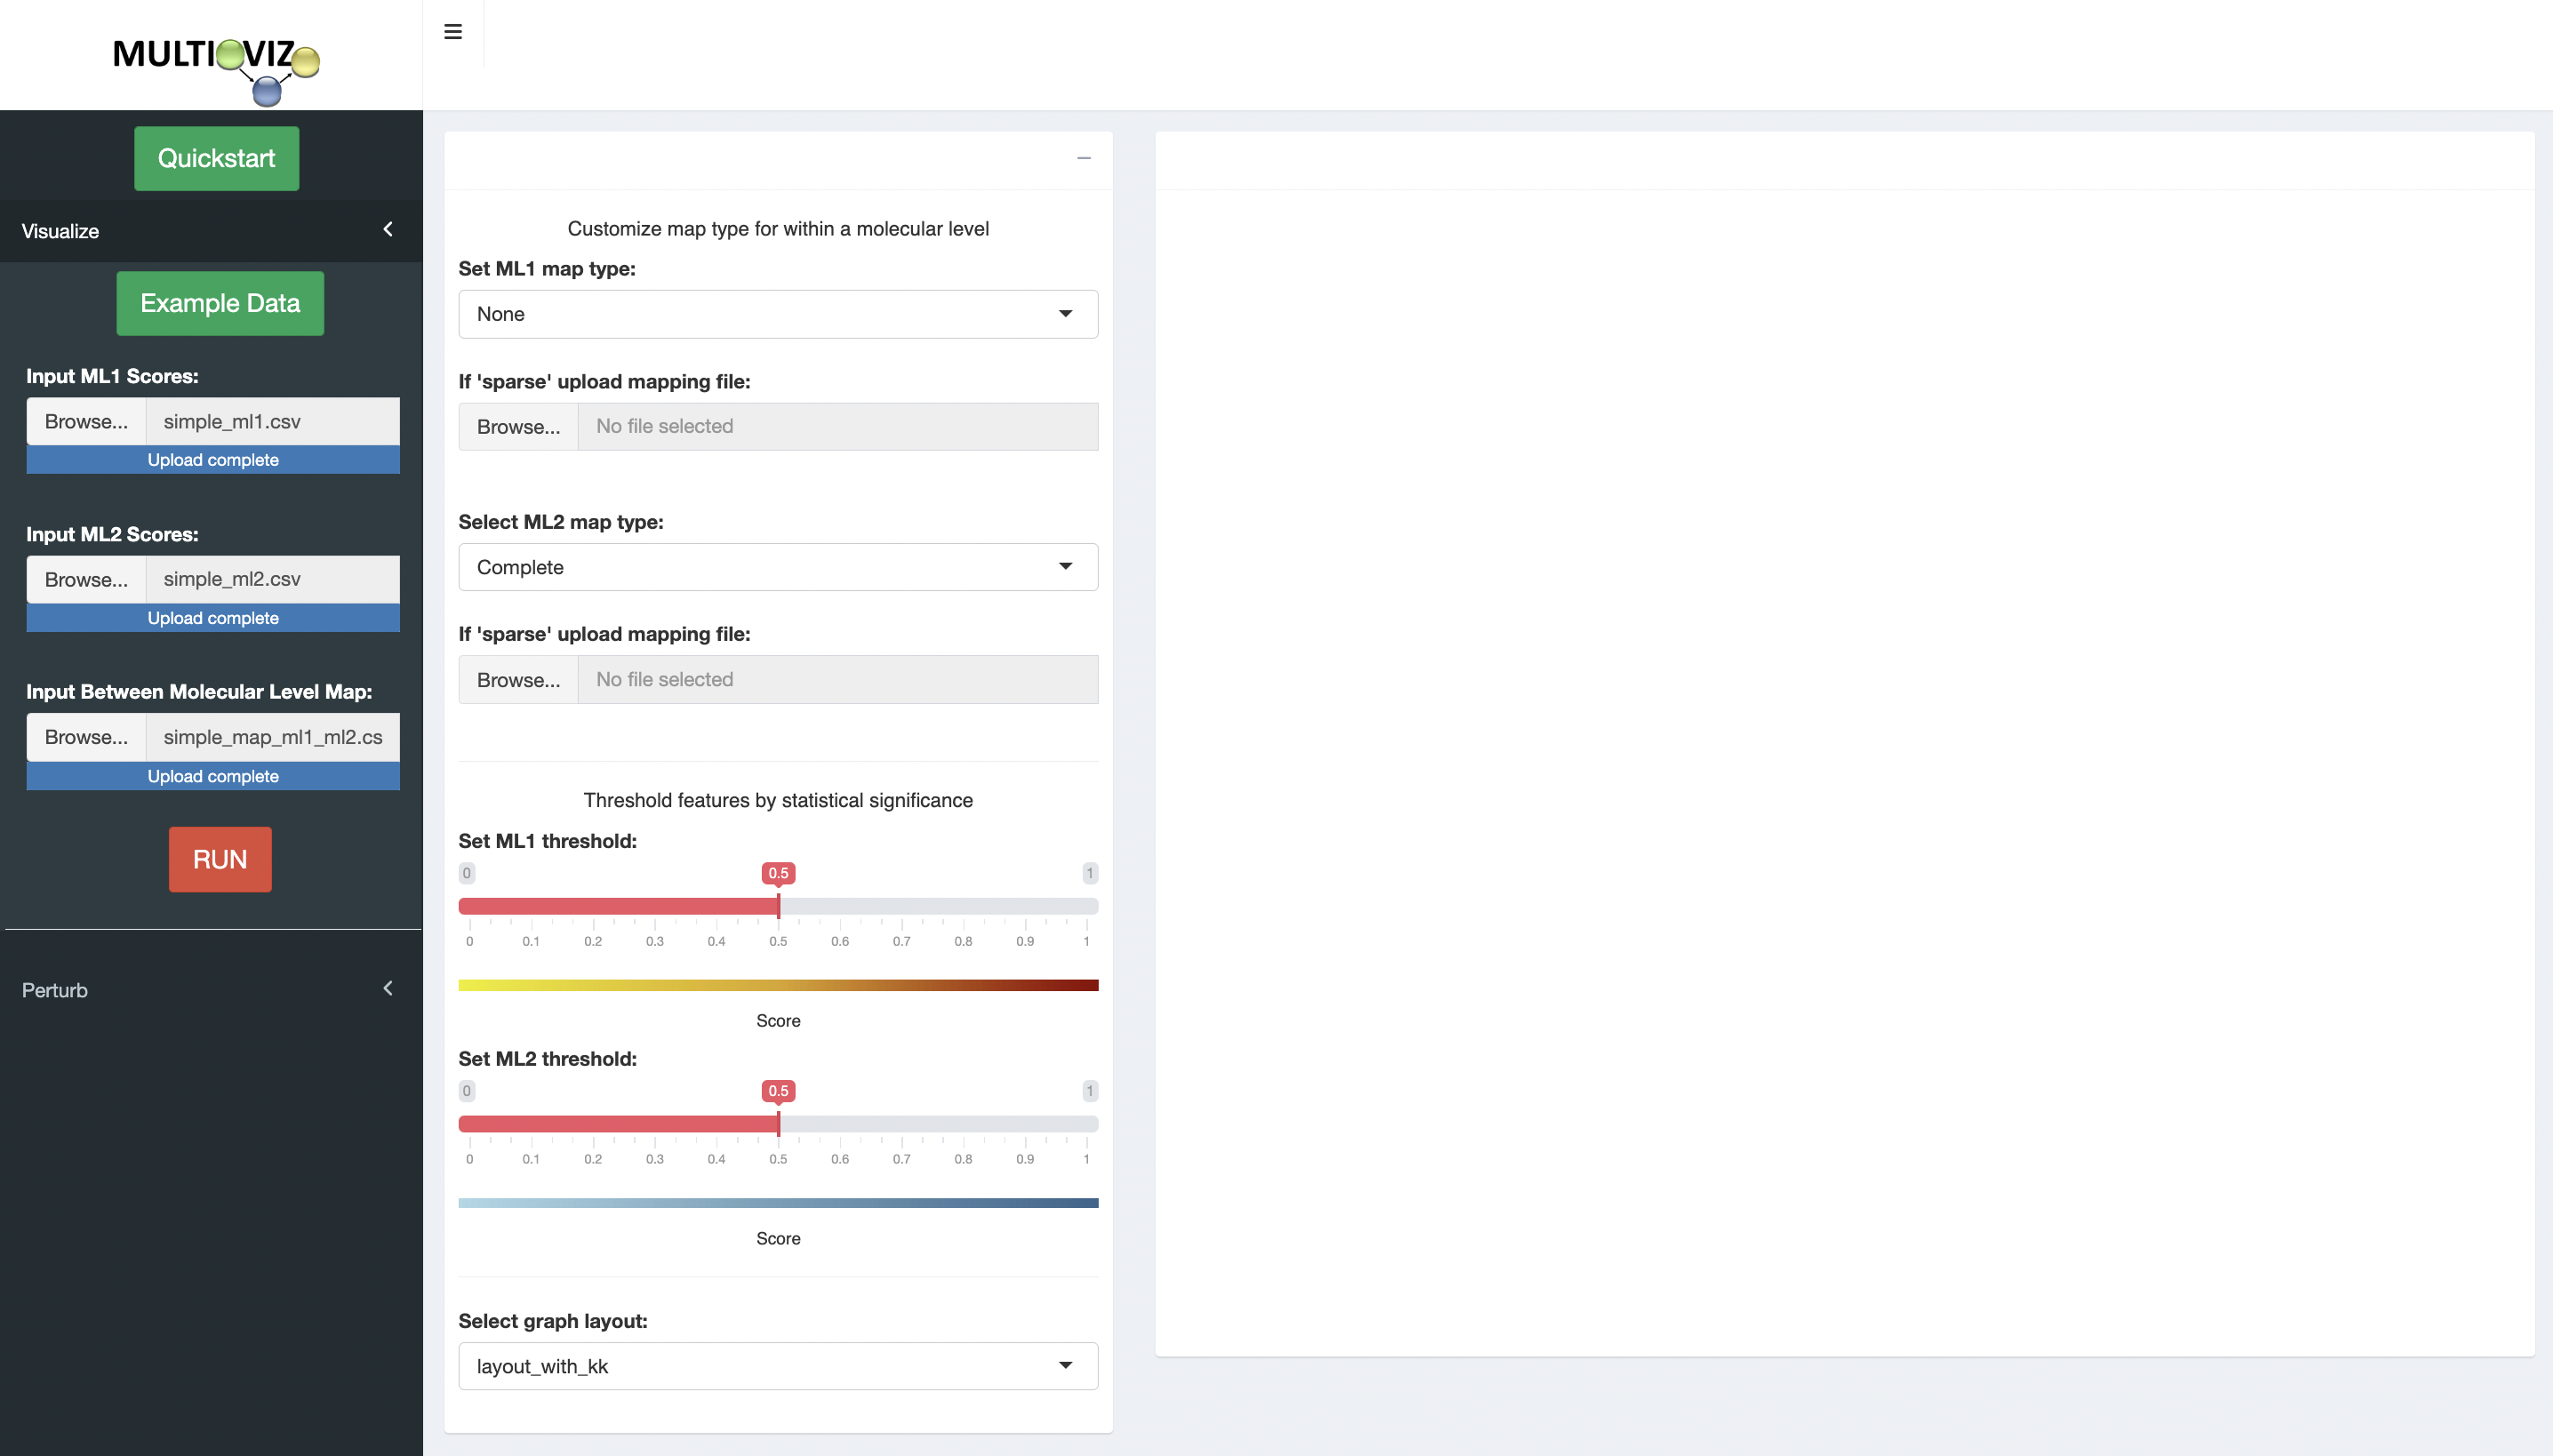
- Select degree of mapping within molecular levels
- Threshold features in each molecular level by statistical significance
- Set GRN layout
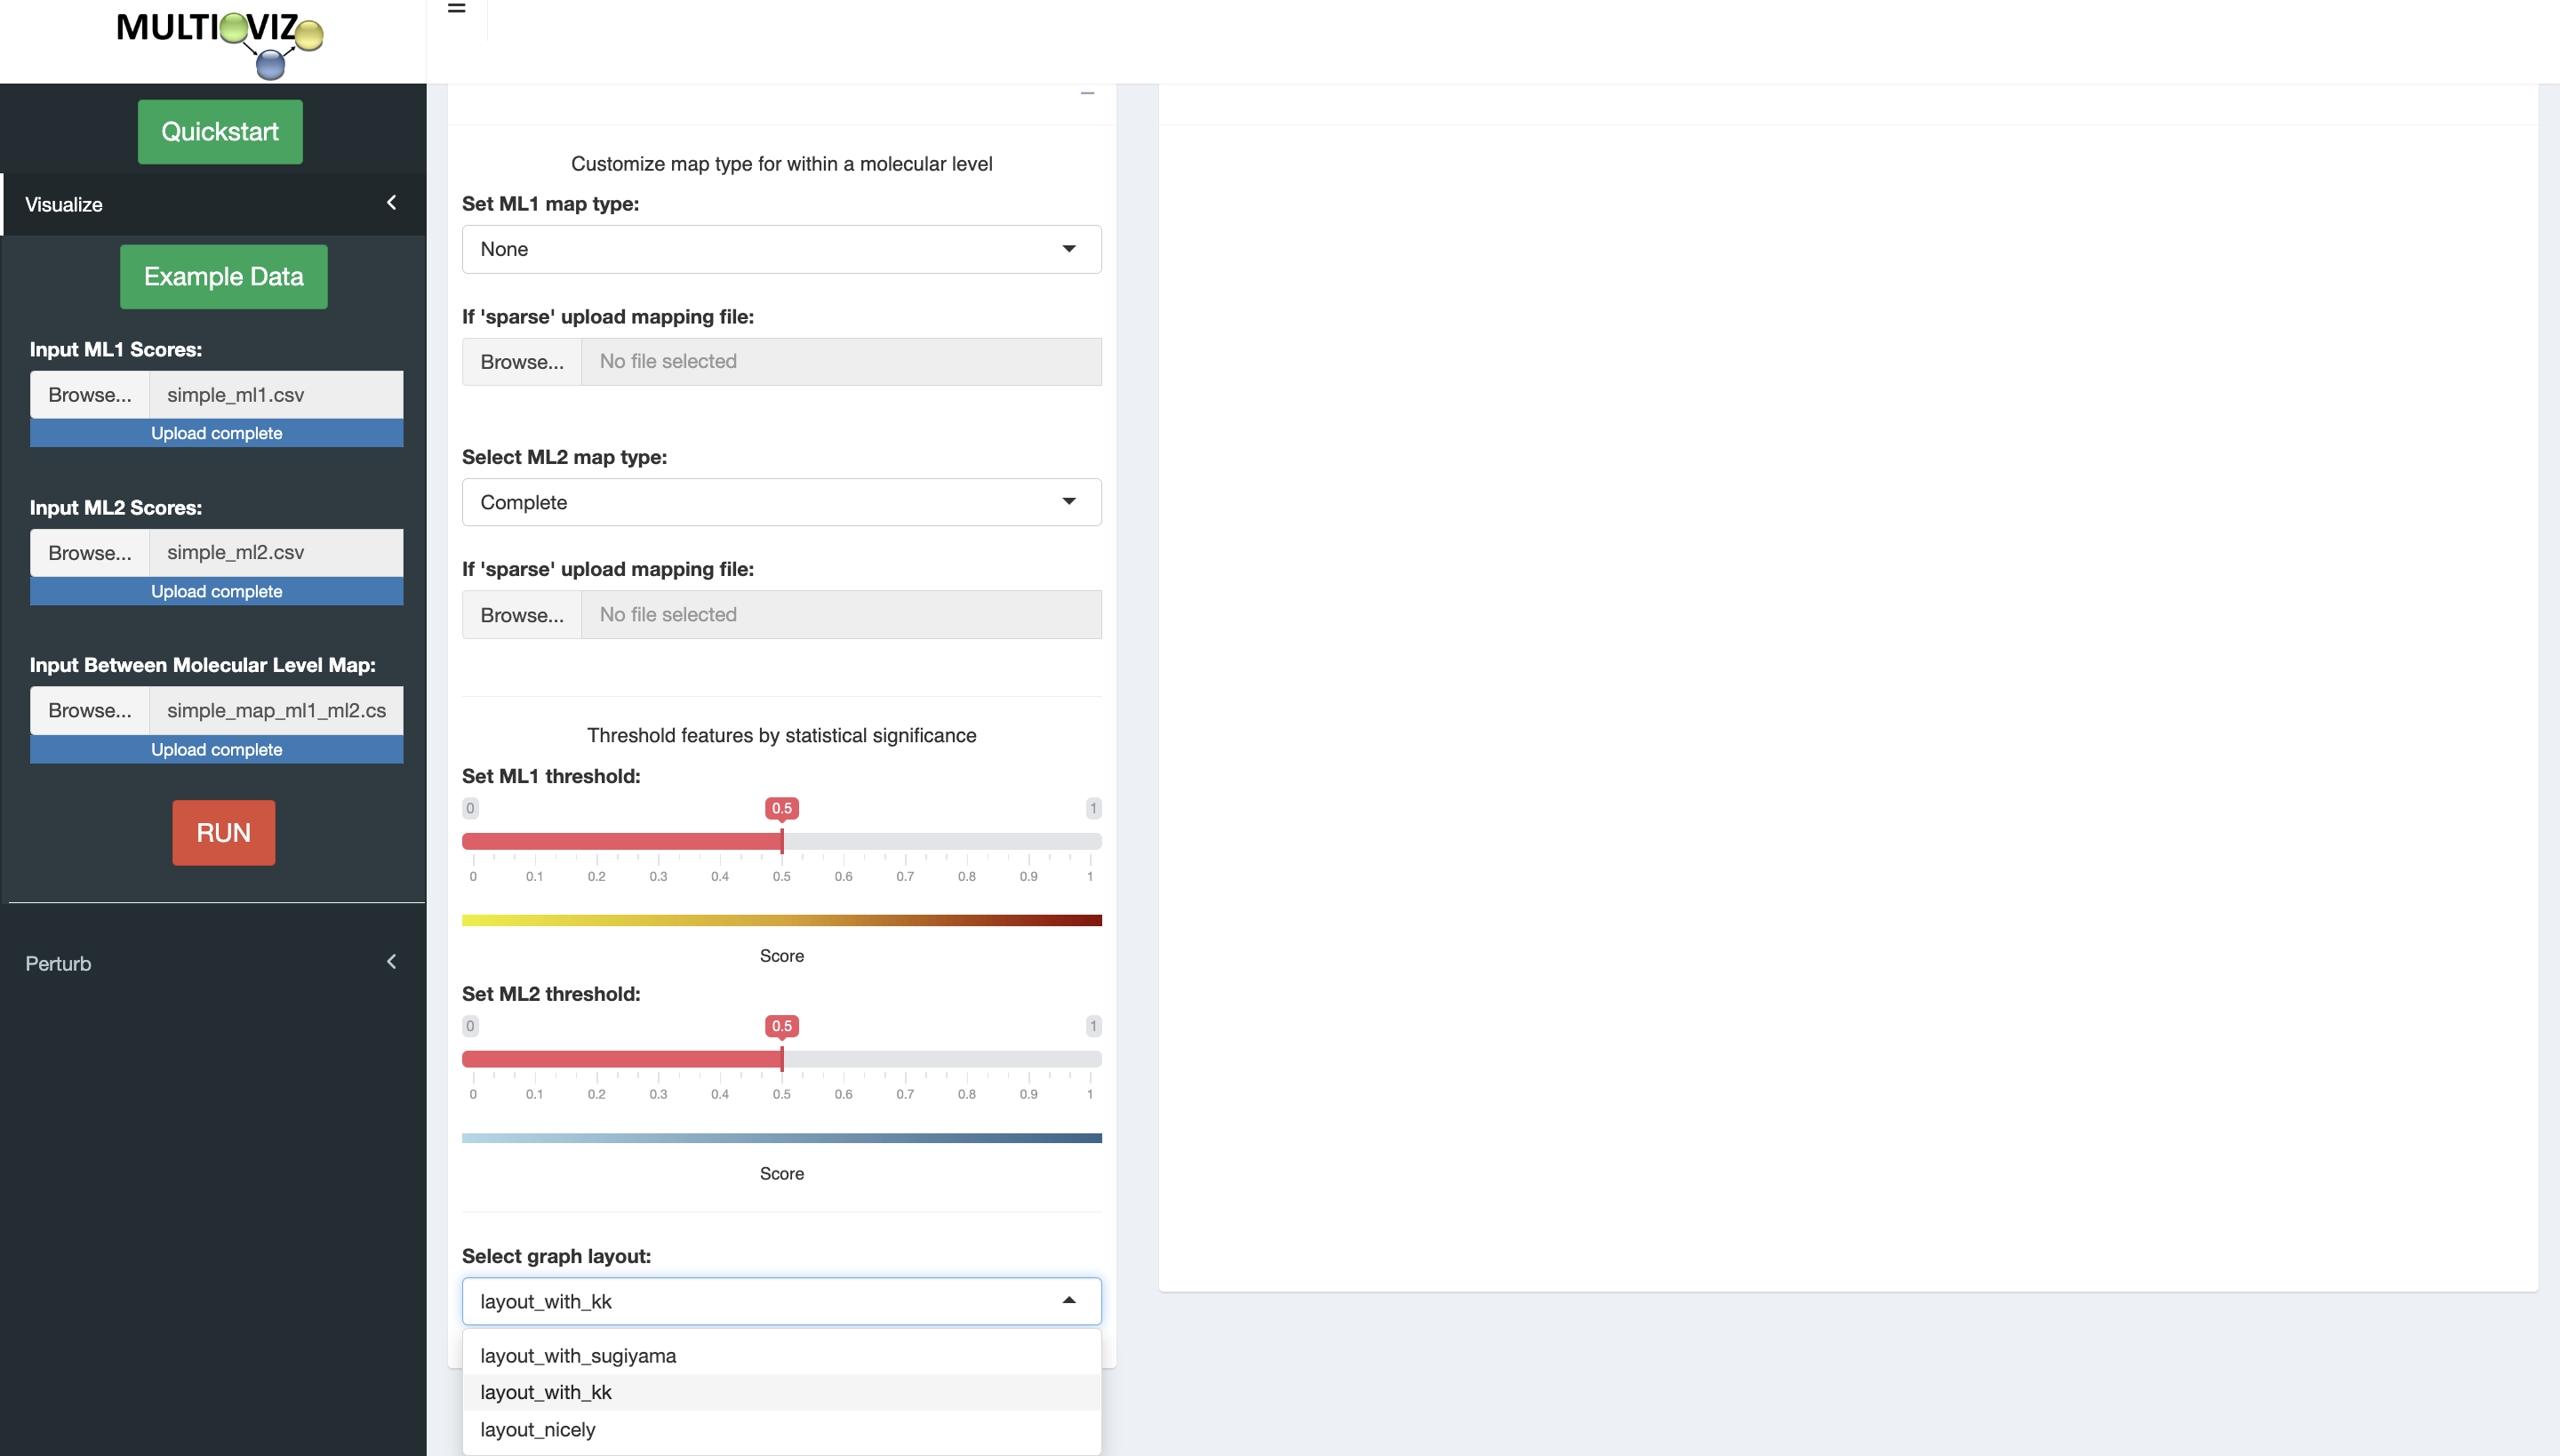
- Click "RUN" to visualize GRN


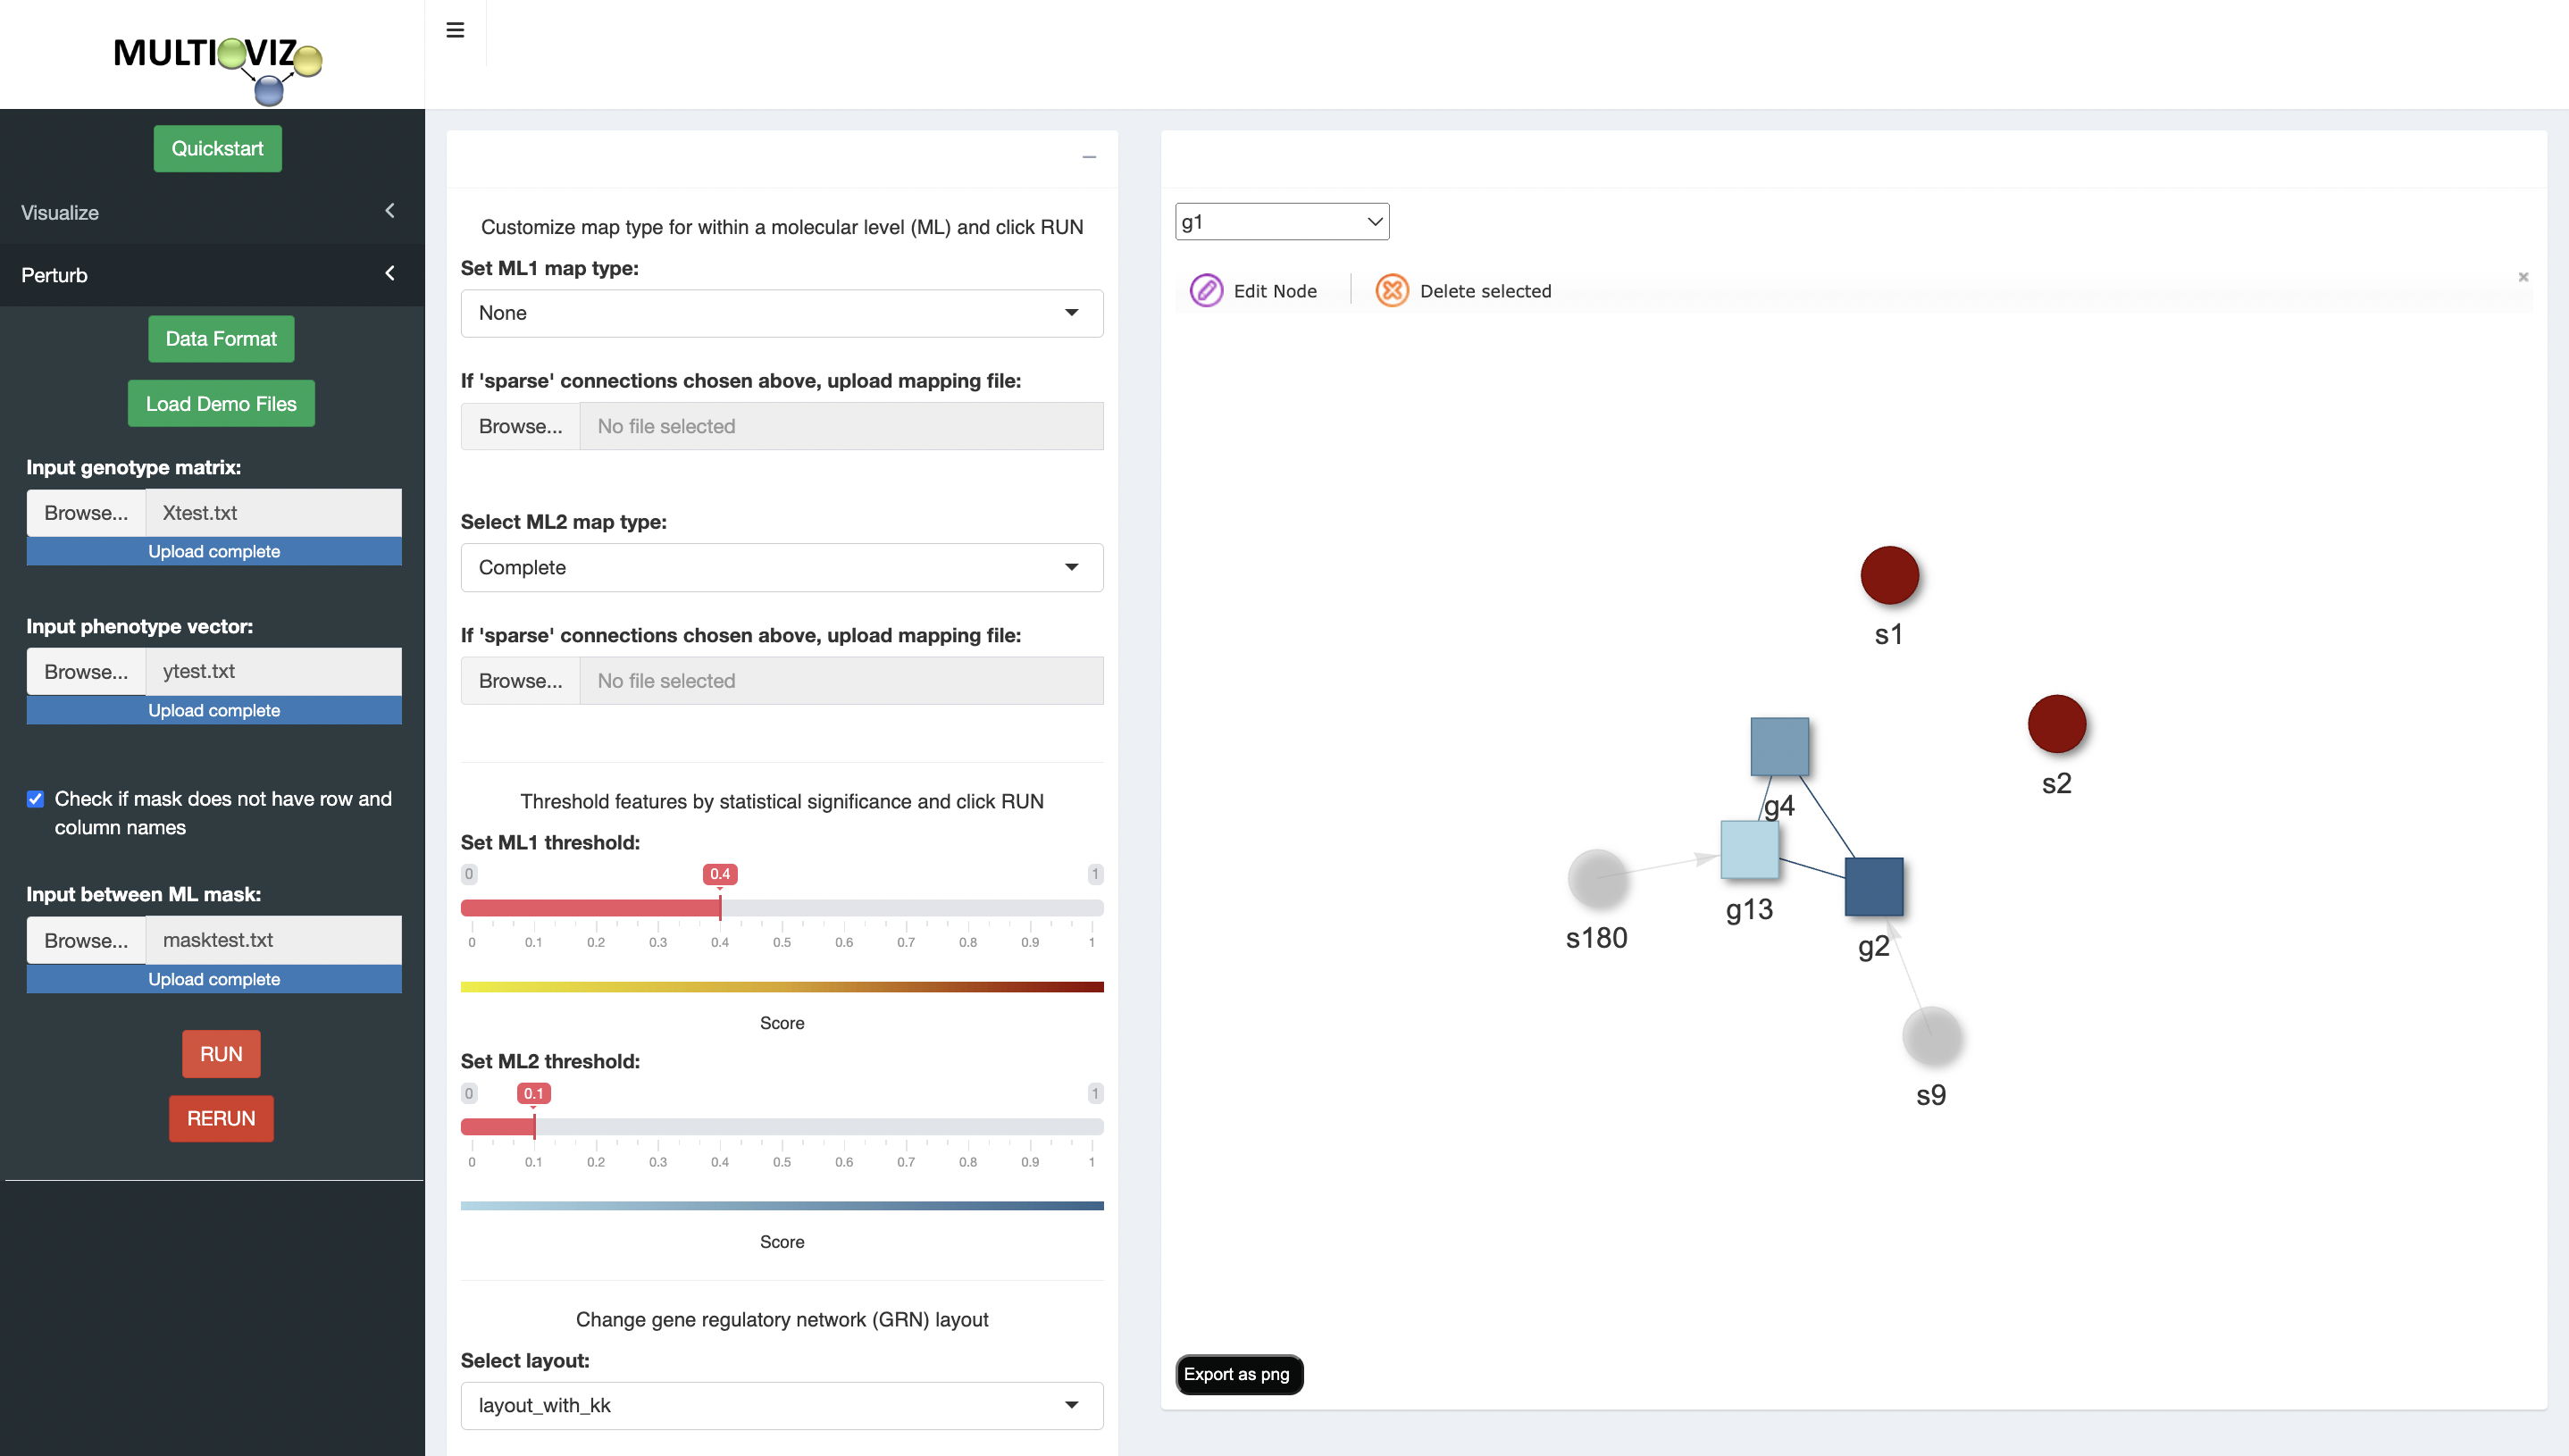
To faciliate in silico hypothesis testing, Multioviz allows users to manually delete nodes and edges, and then rerun the ranking model to generate a new network with different significant molecular features.

- Click on the perturbation drop down the left panel
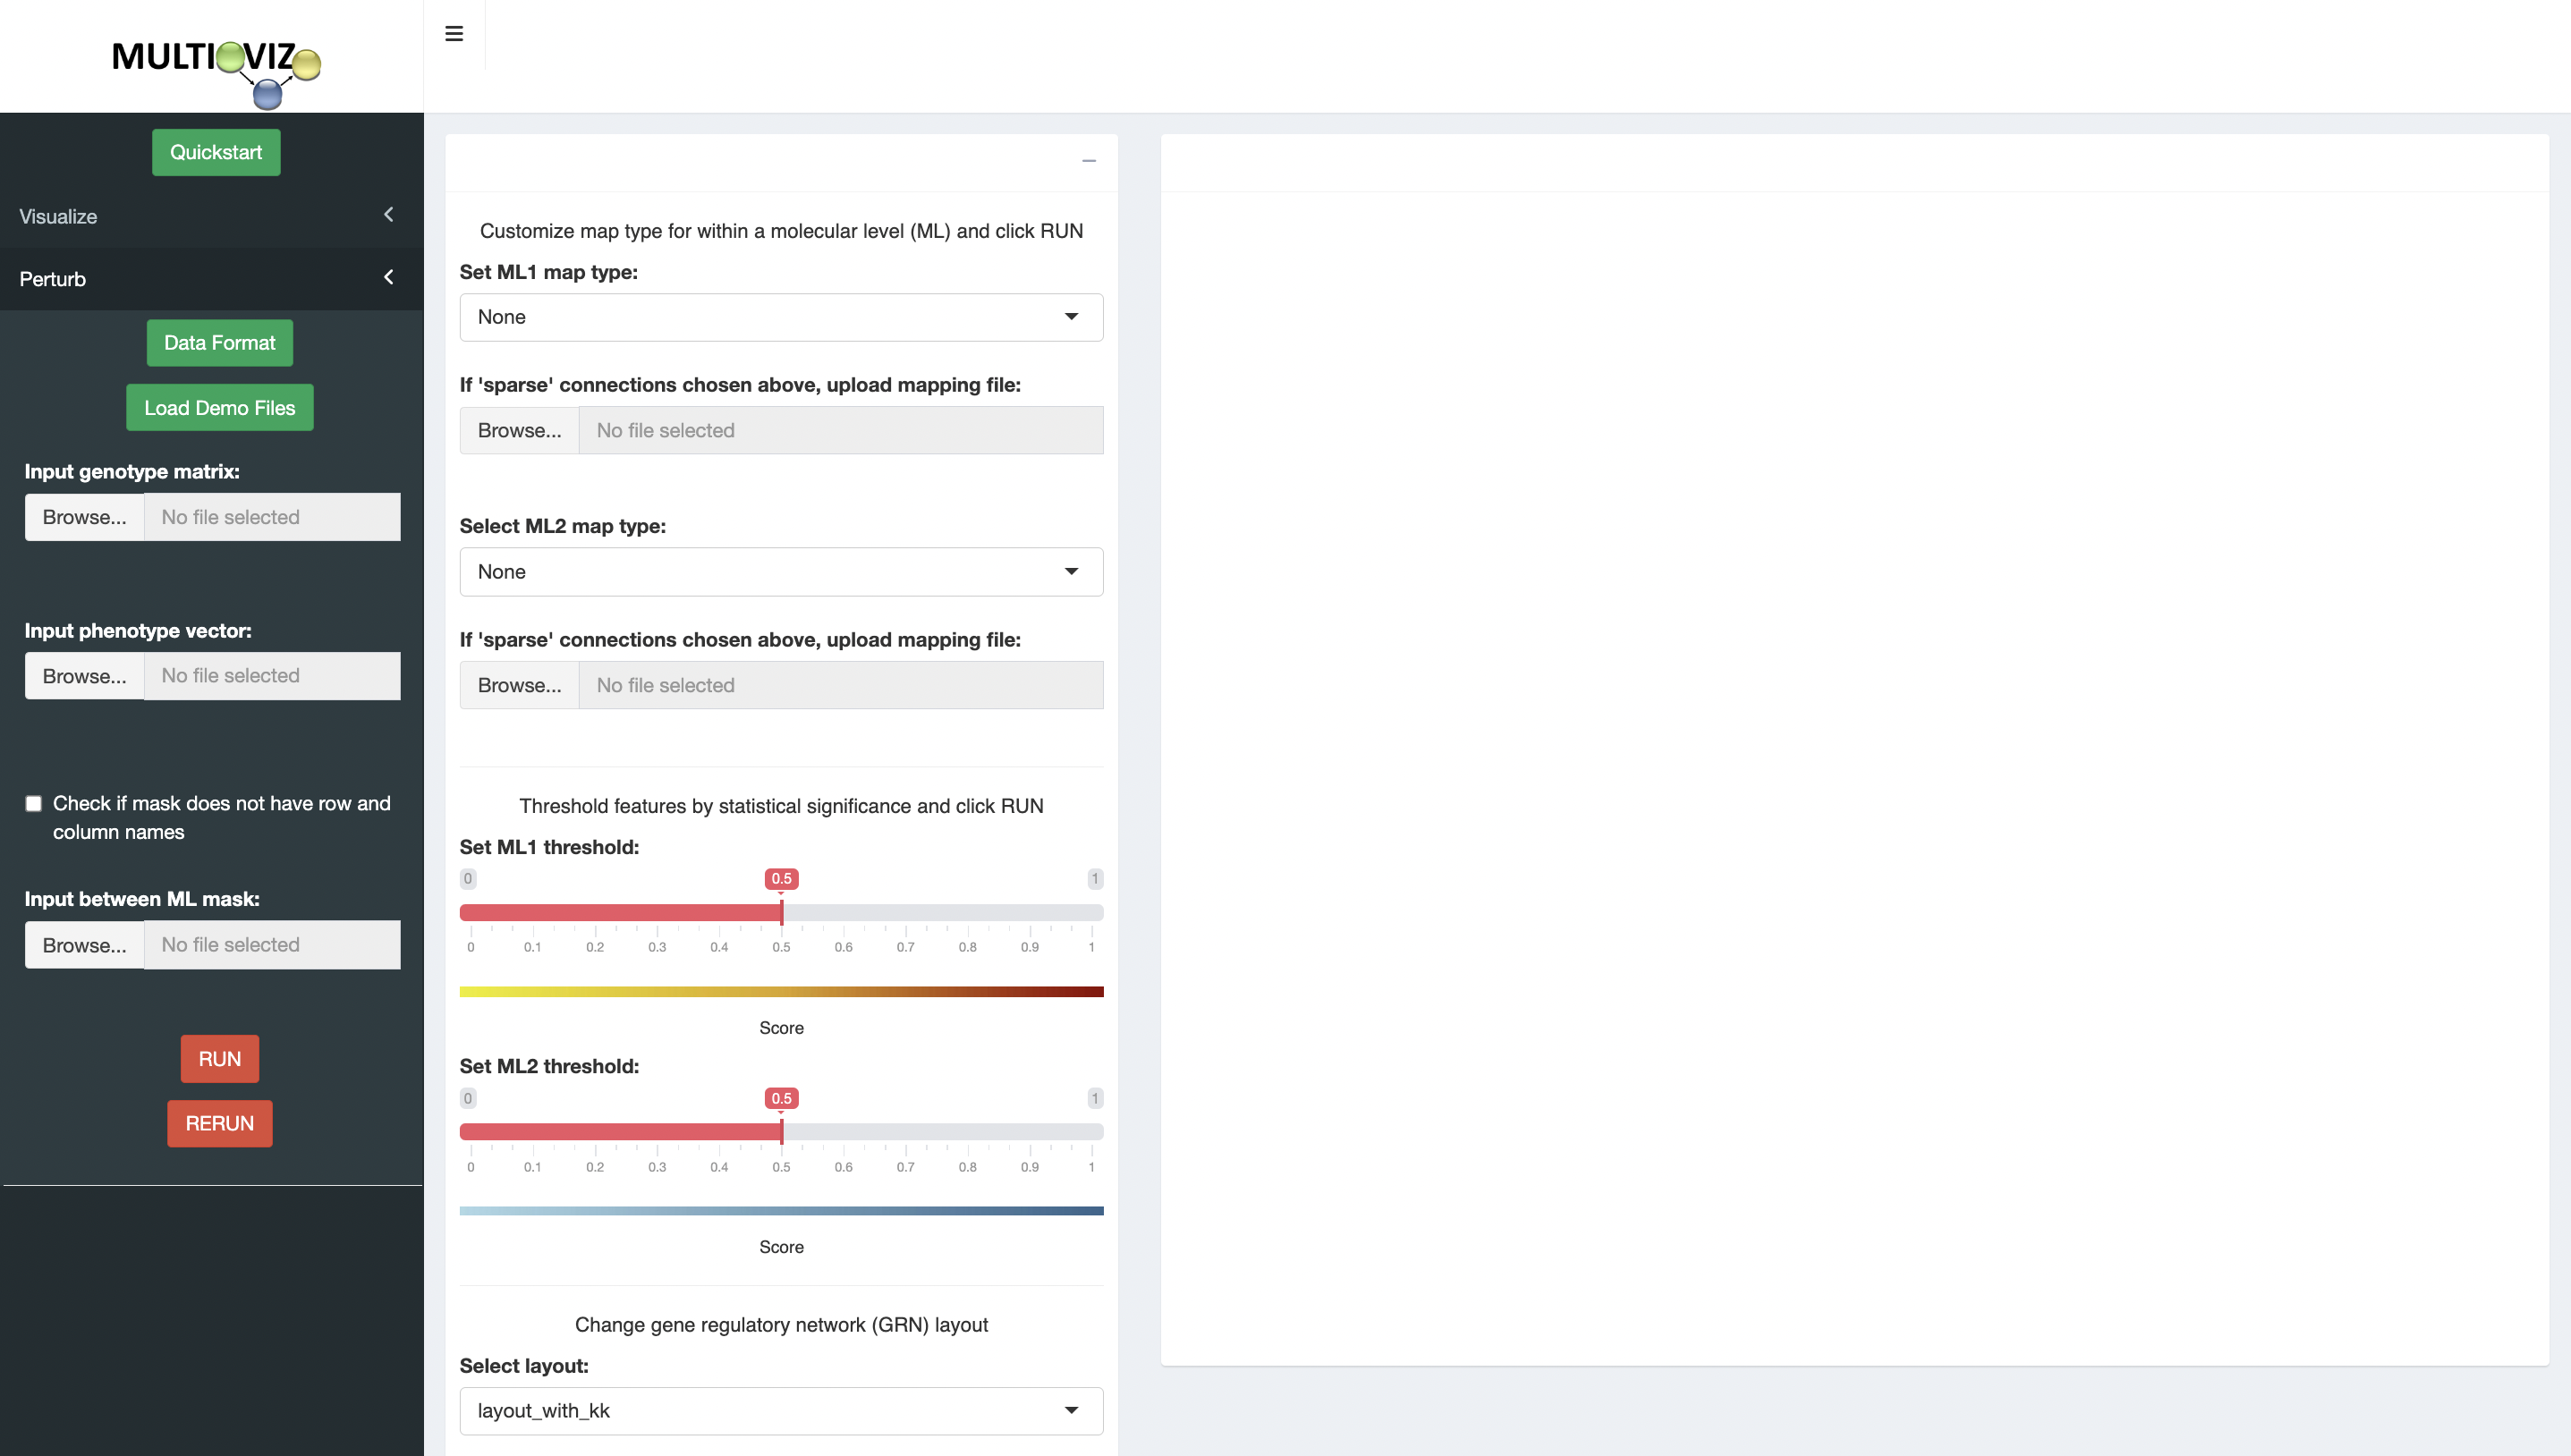
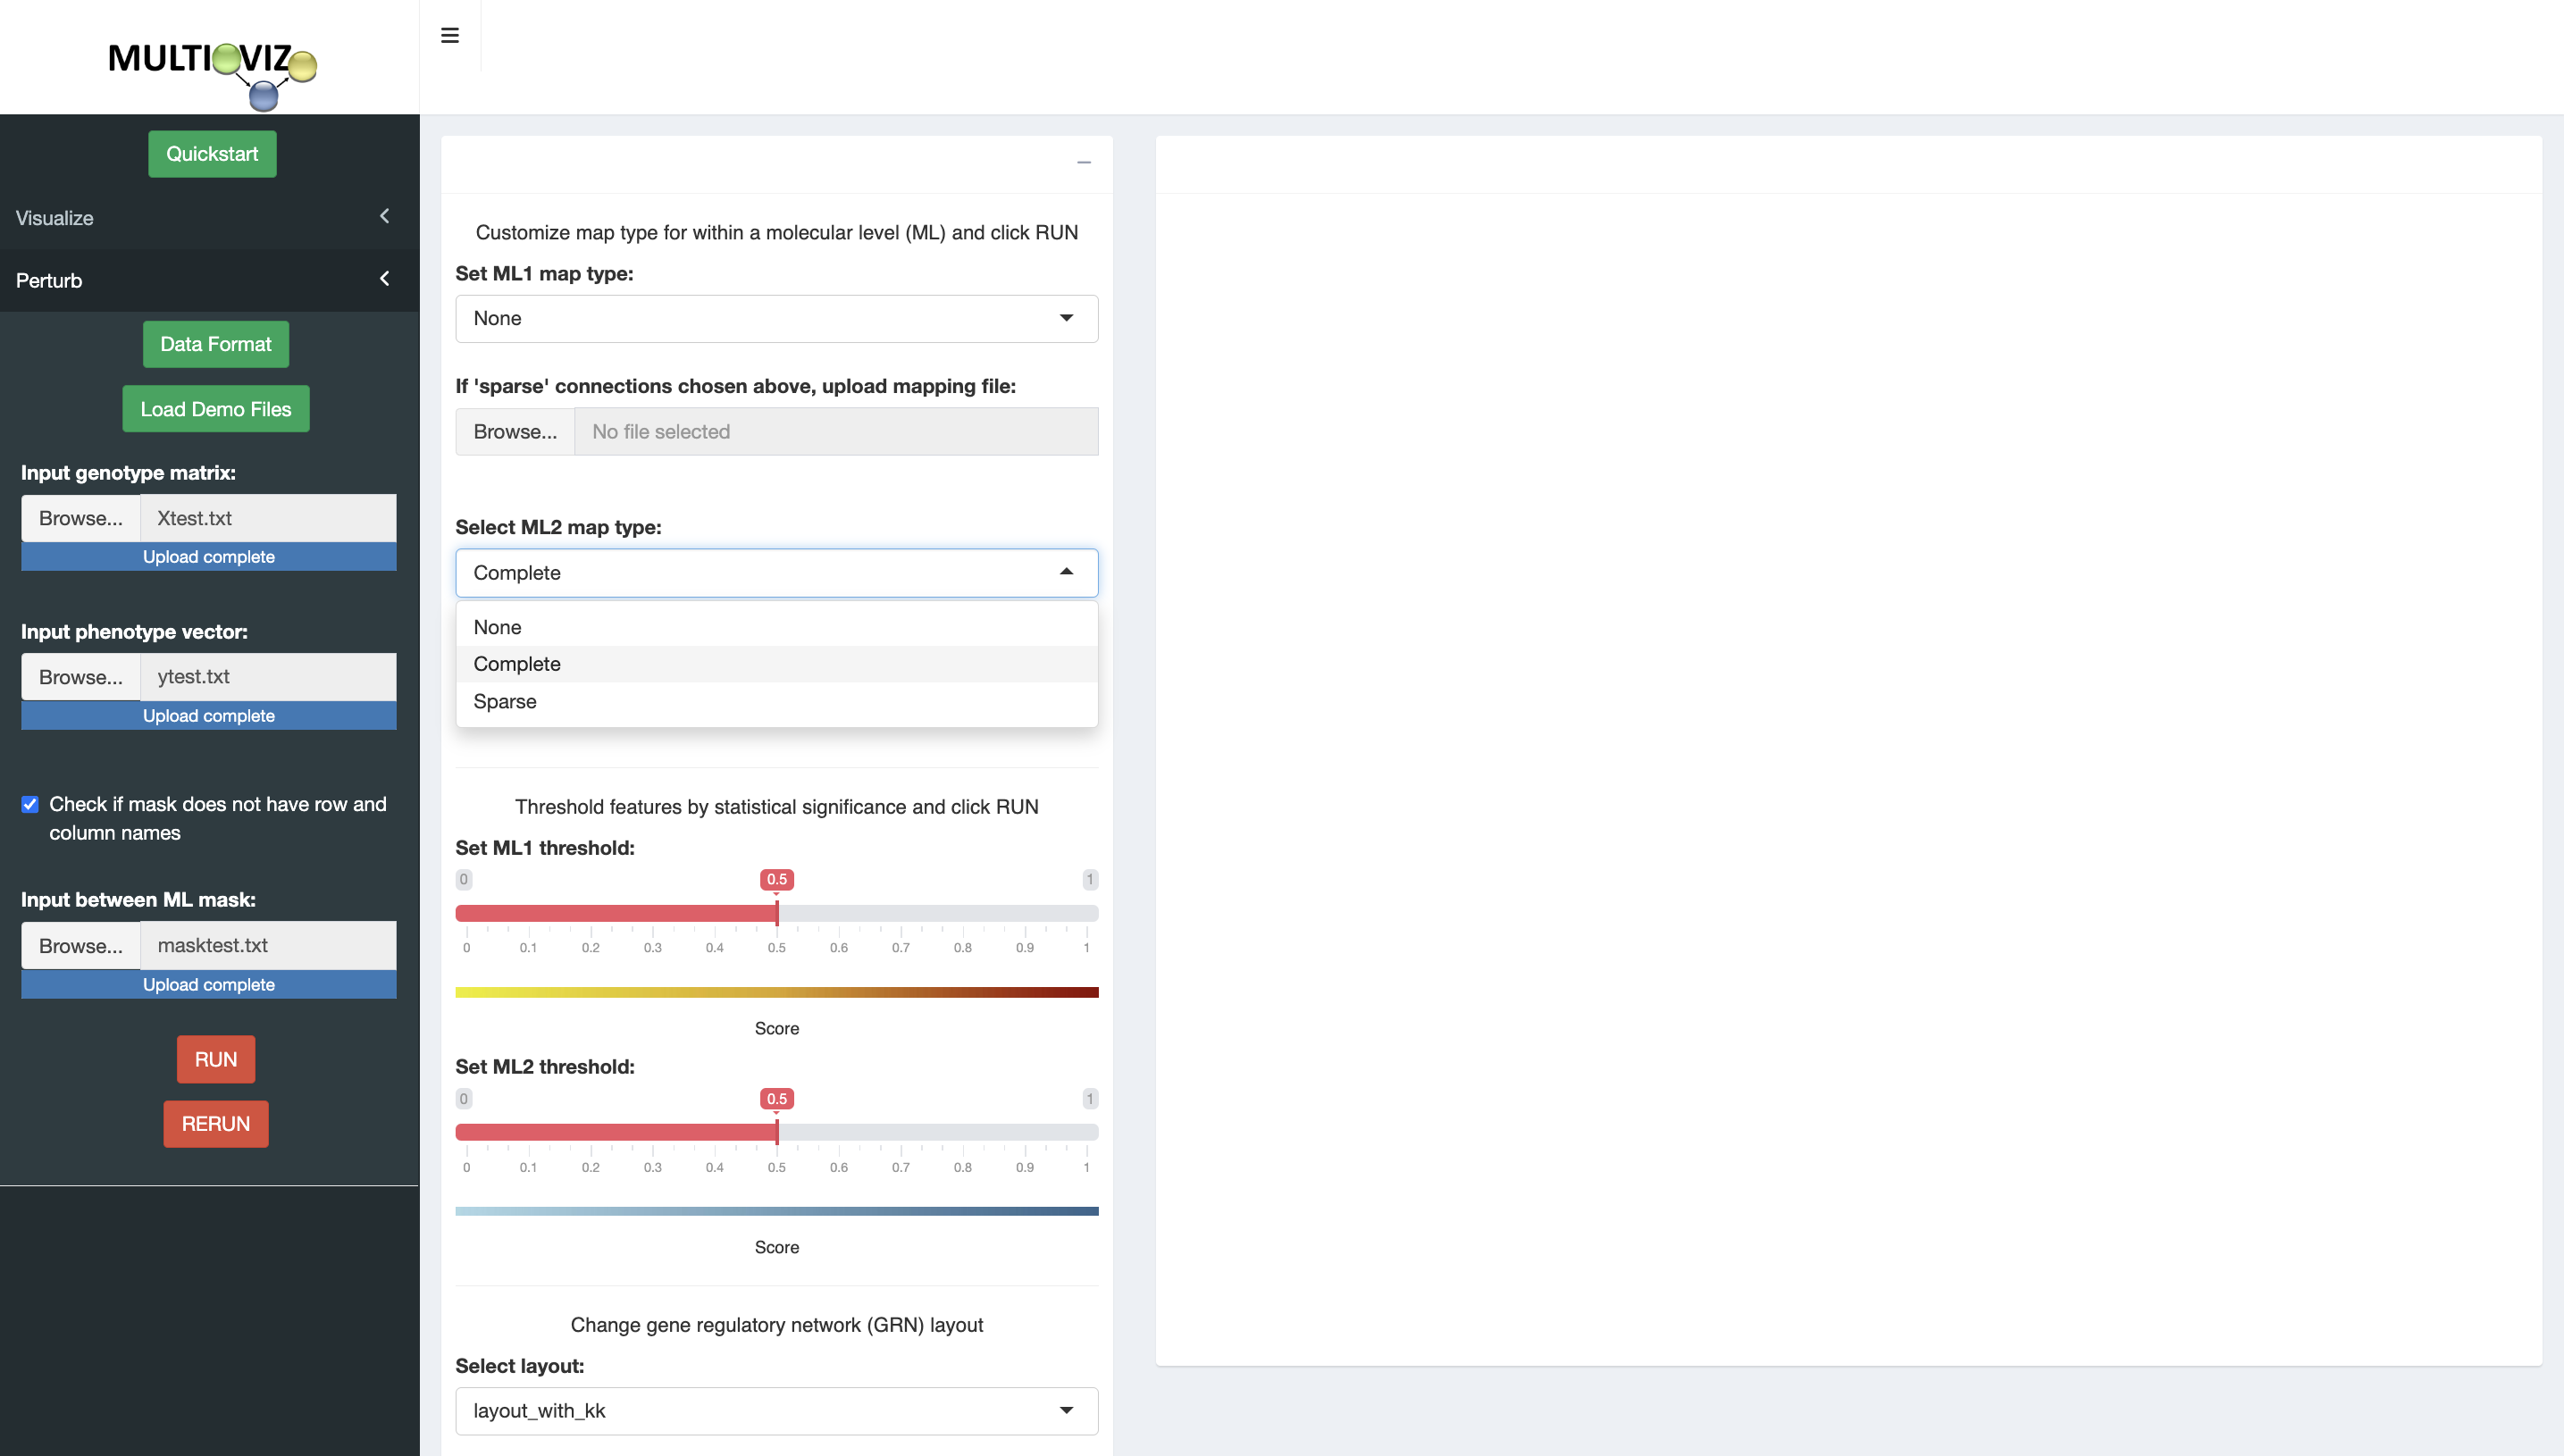
- Input X, y, and mask files for perturbation

- Select degree of mapping within molecular levels
- Threshold features in each molecular level by statistical significance
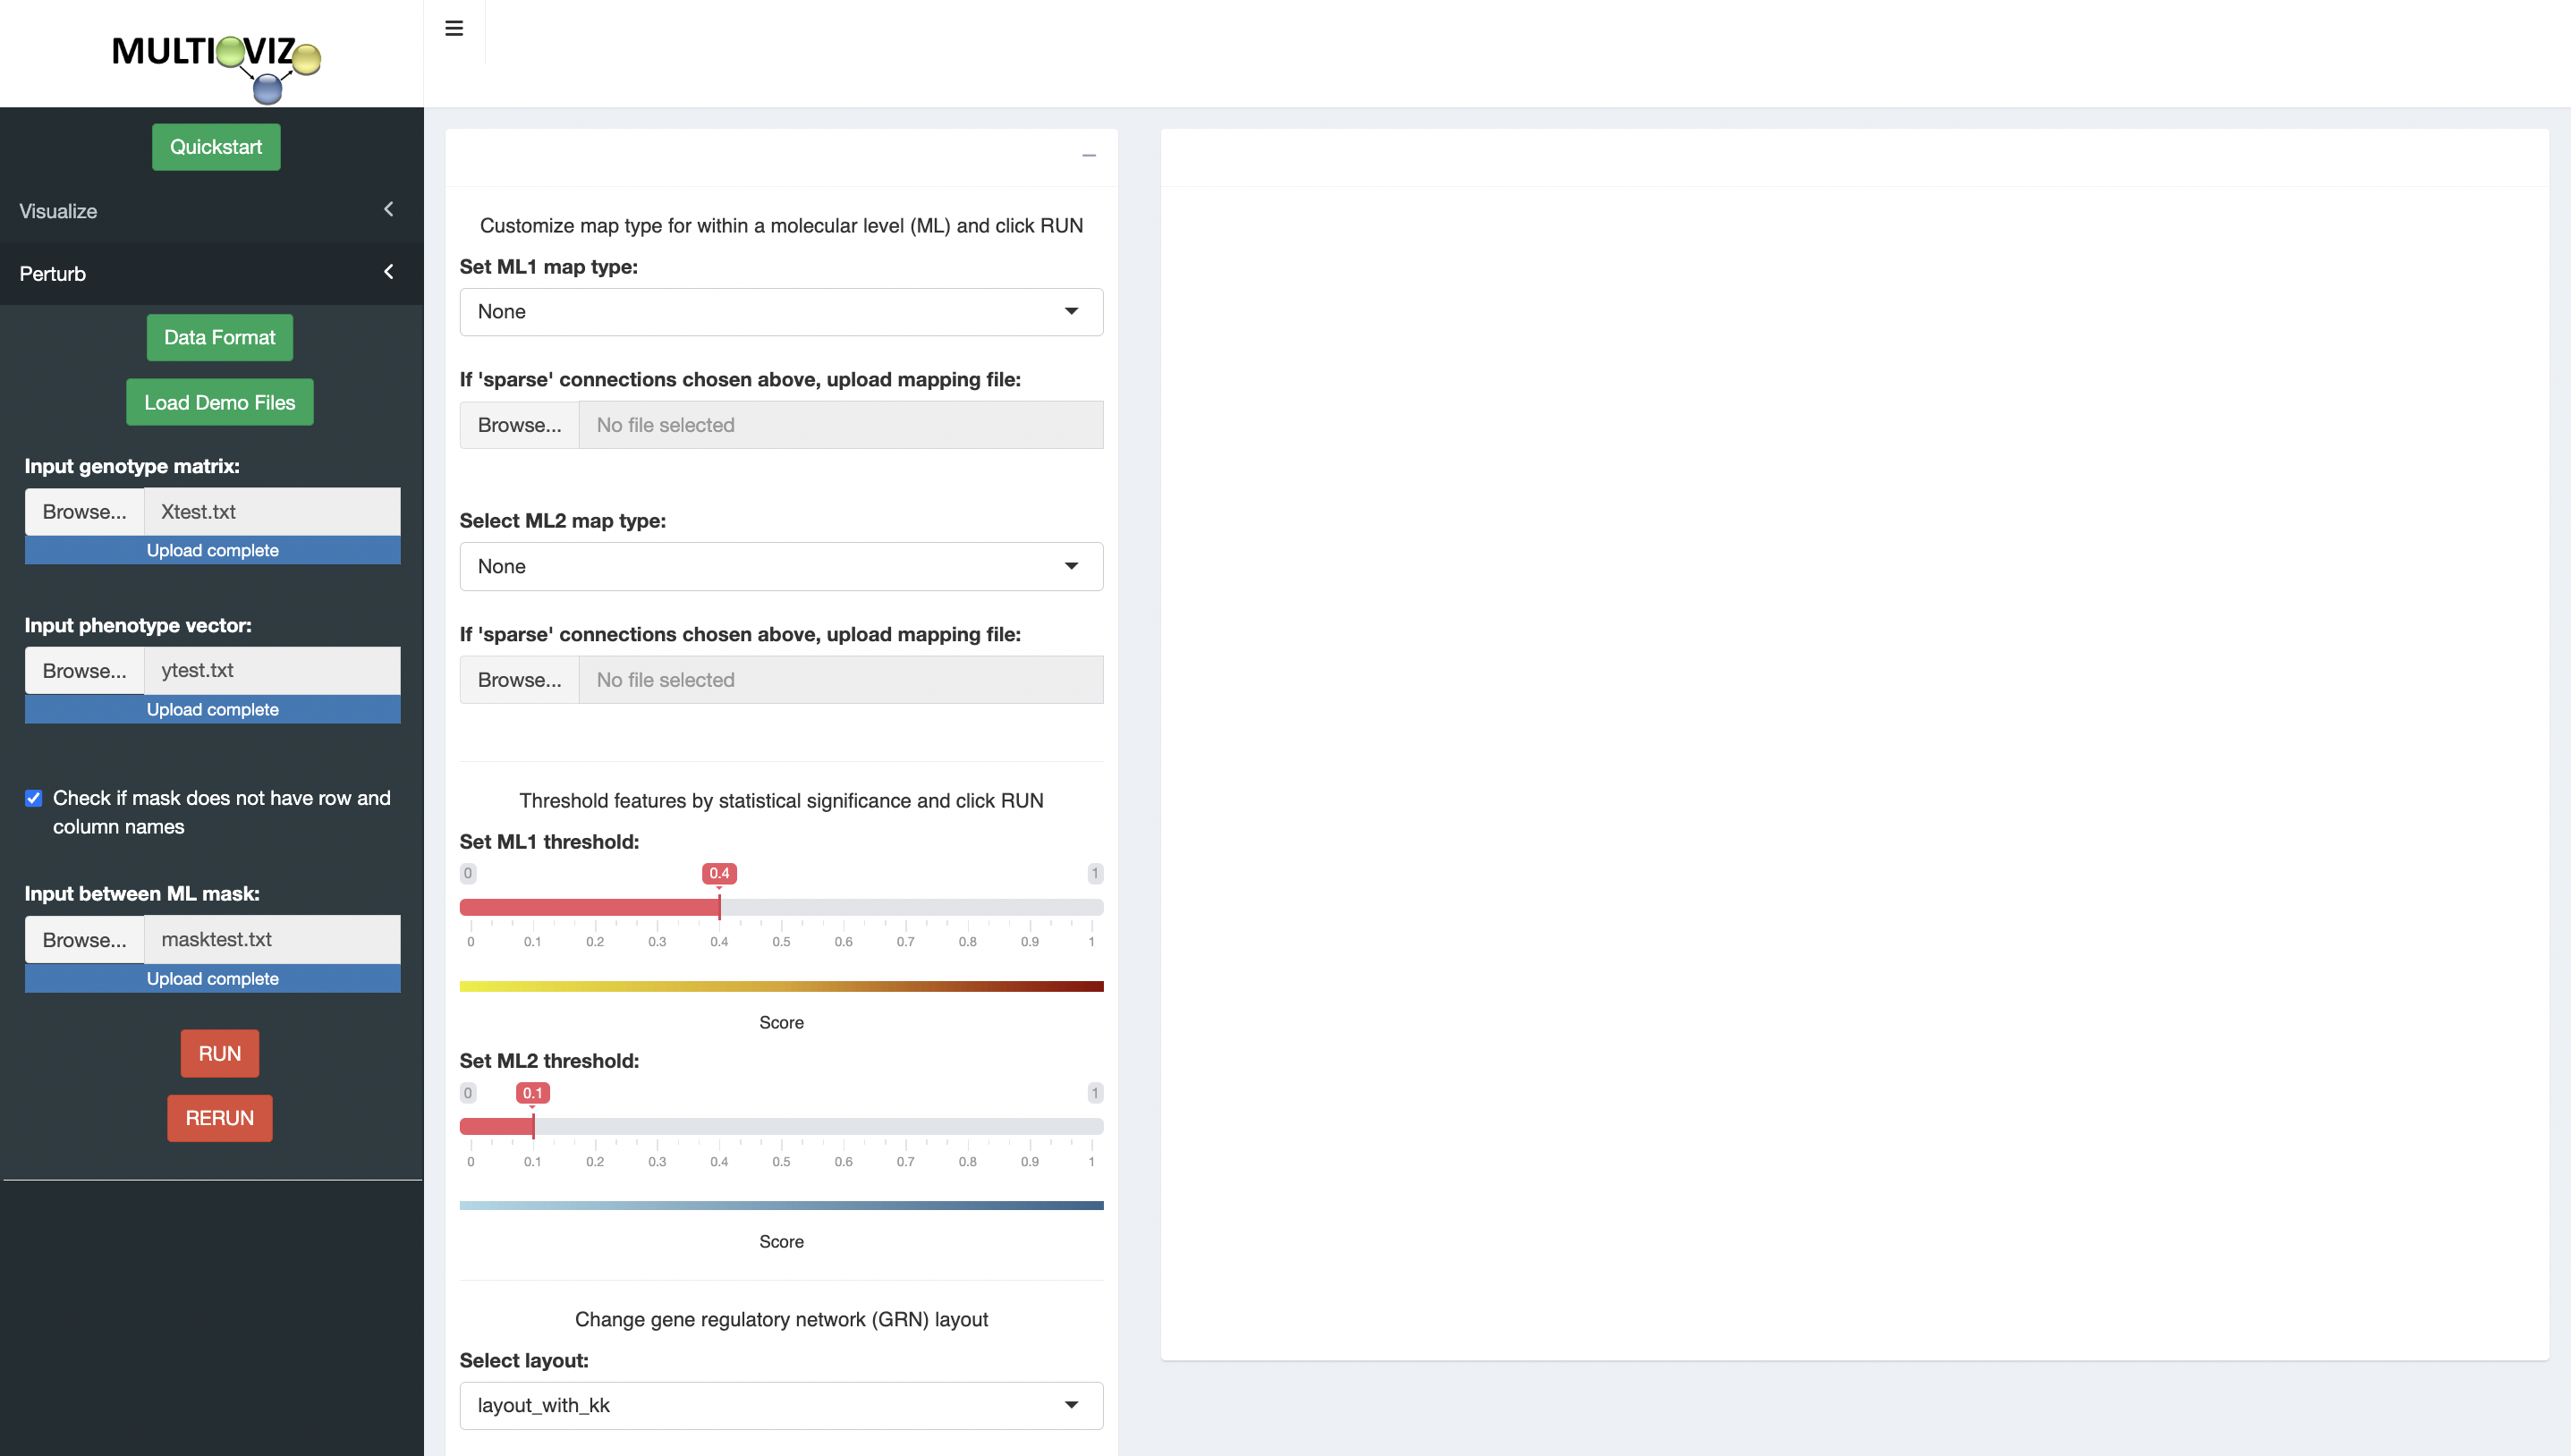
- Set GRN layout
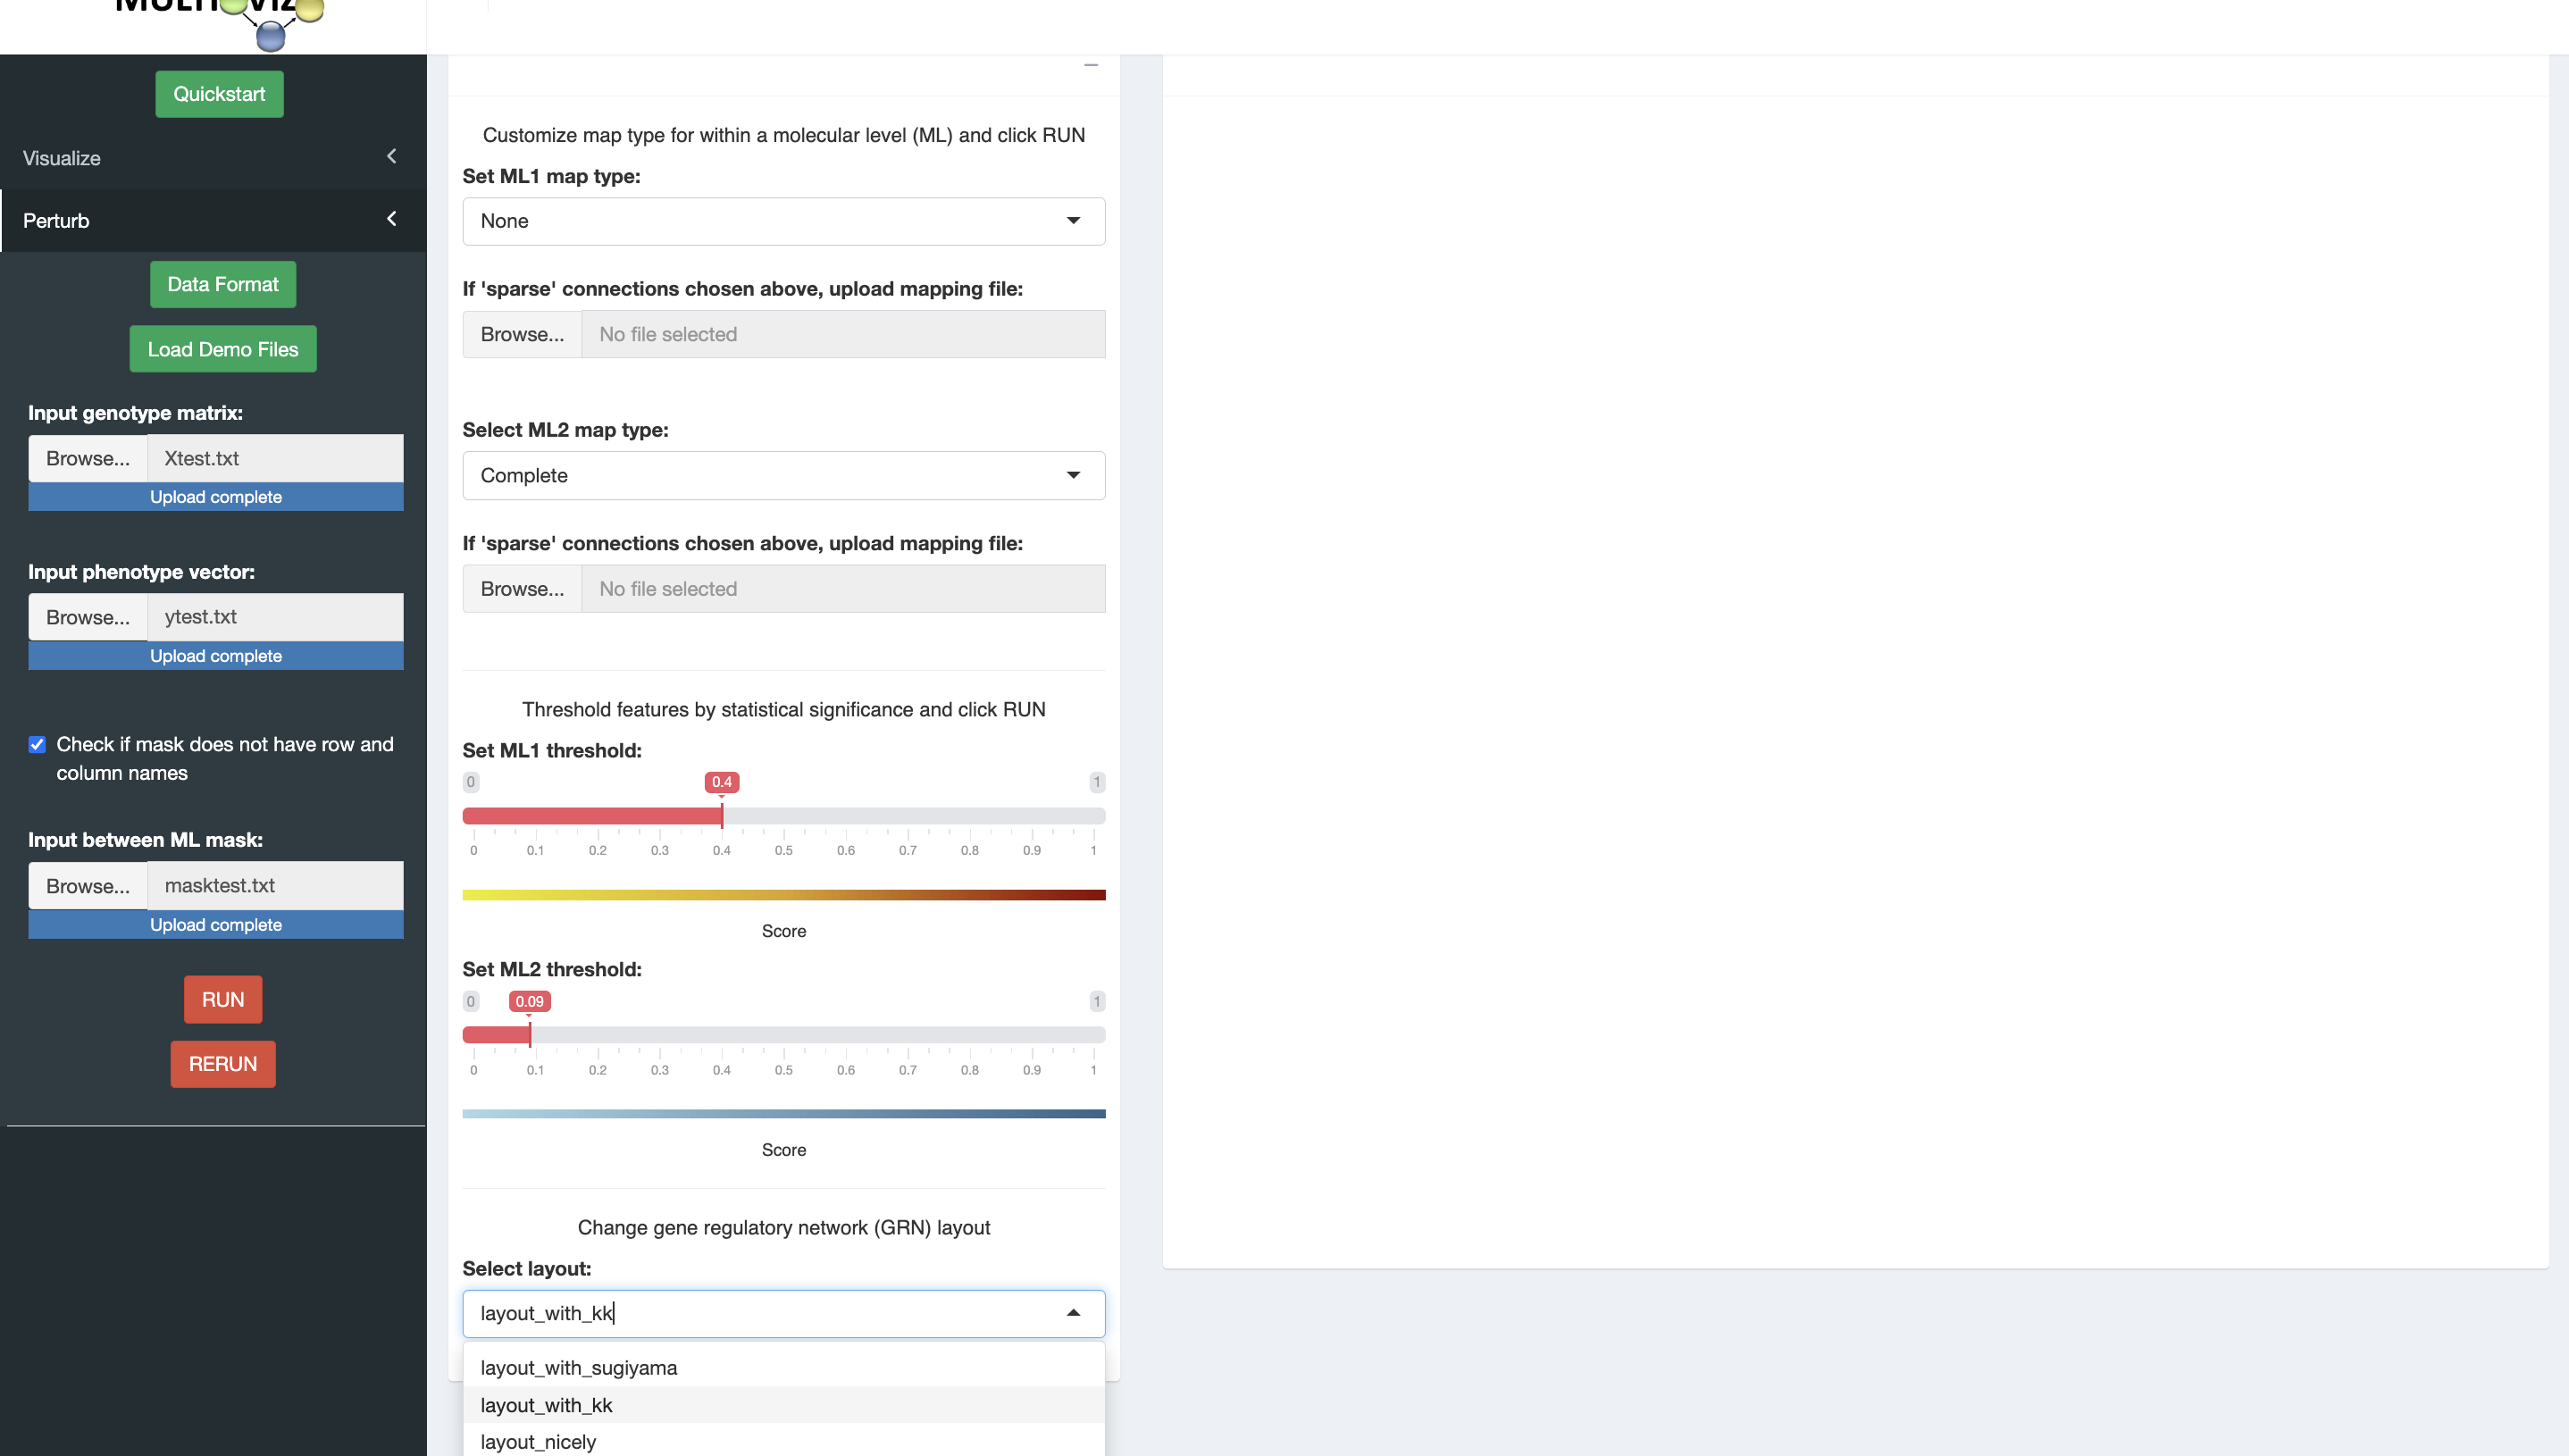
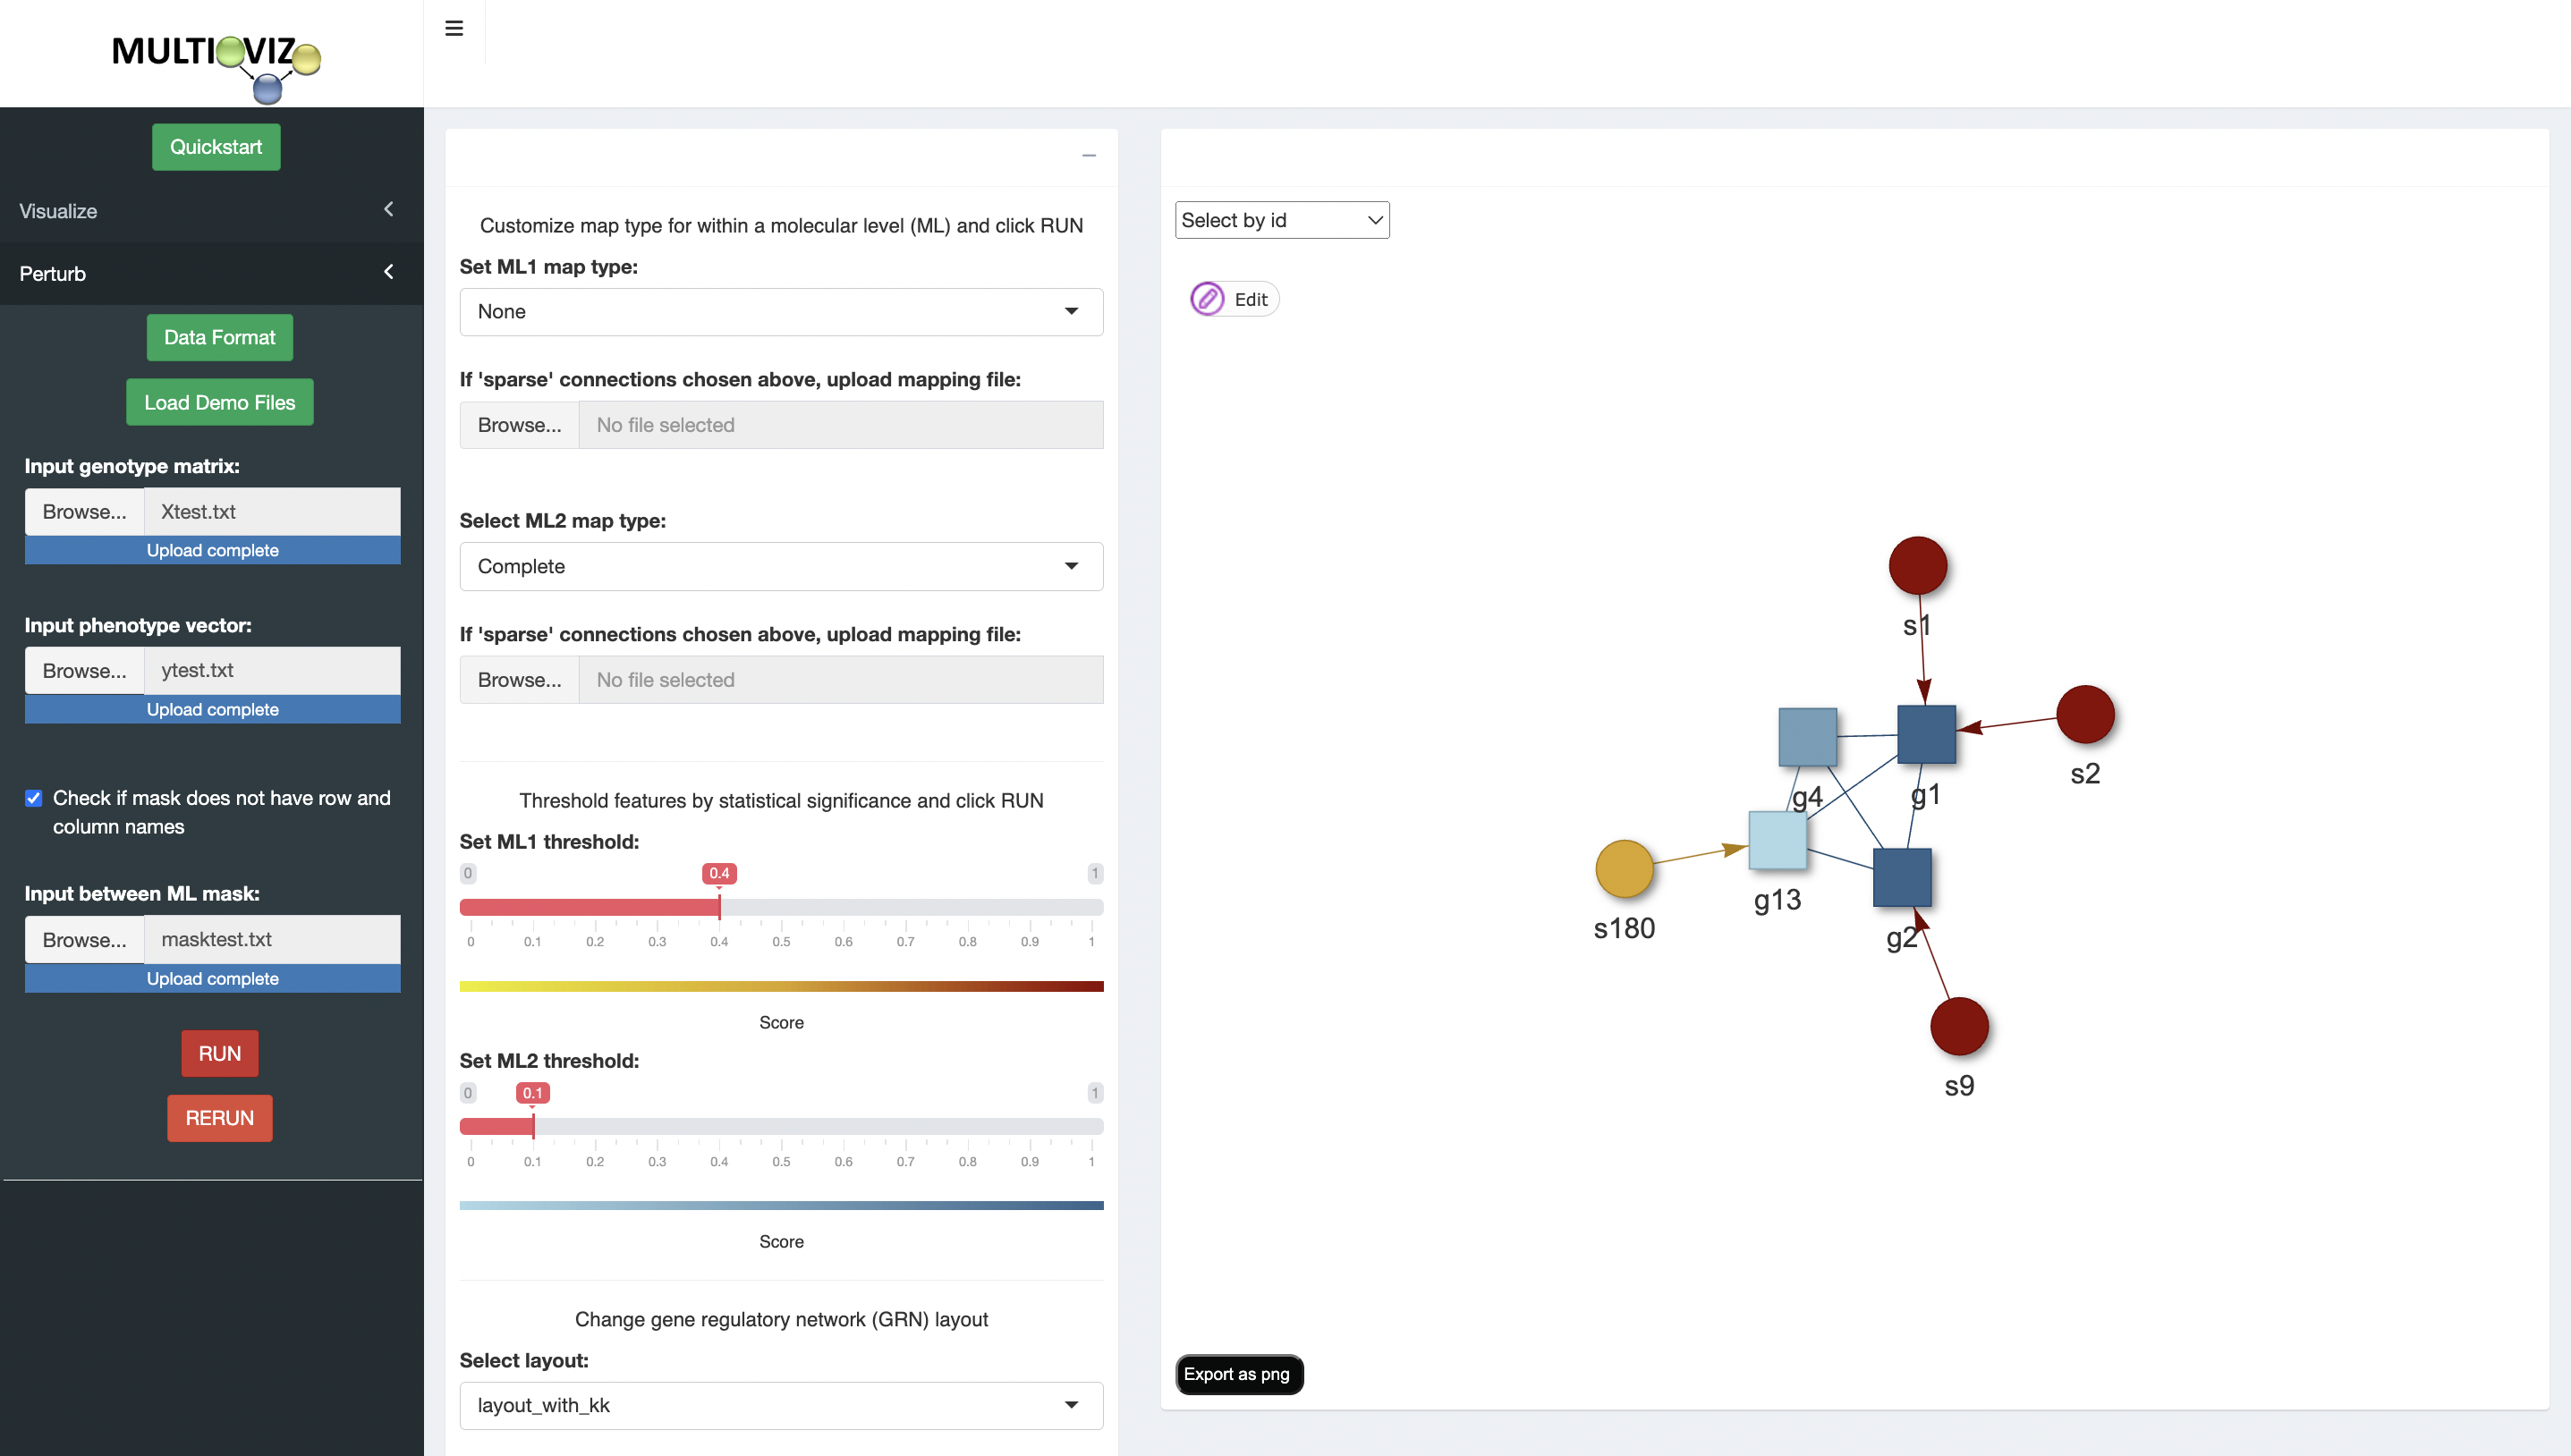
- Click "RUN" to generate GRN
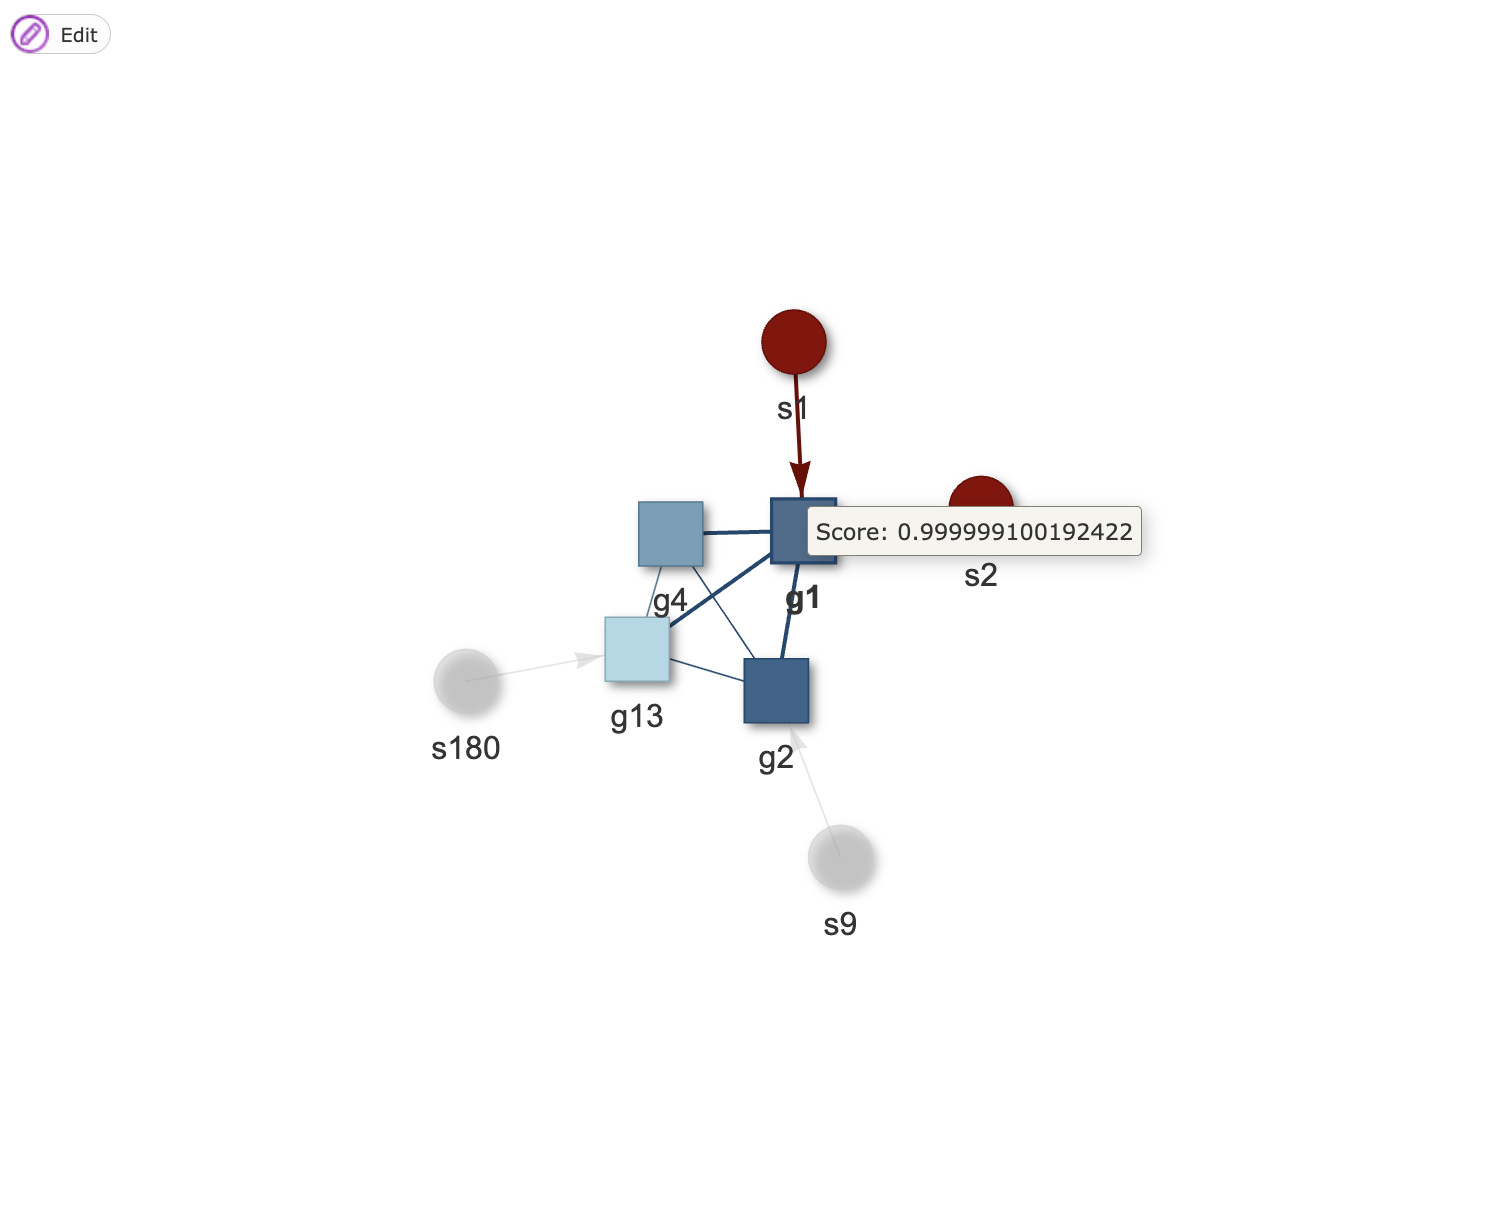
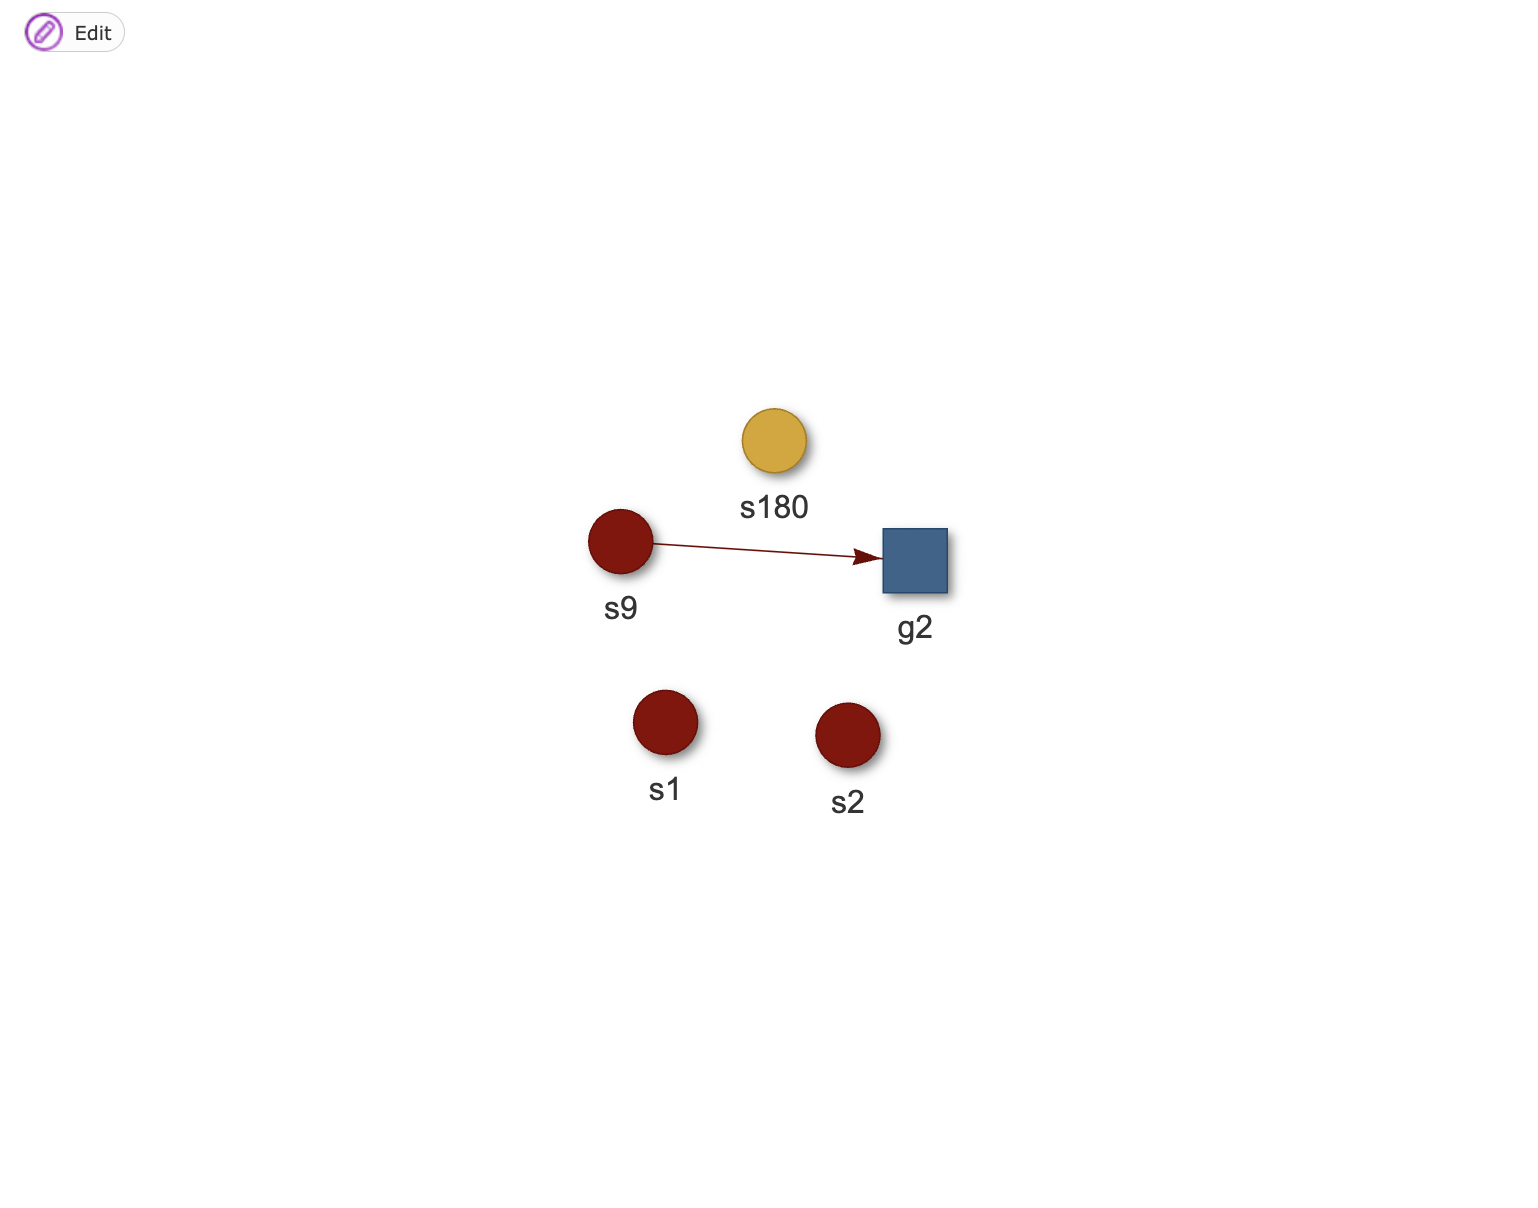
- Select features(s) to delete and click "Edit"
- Click "Delete selected" to manually remove node
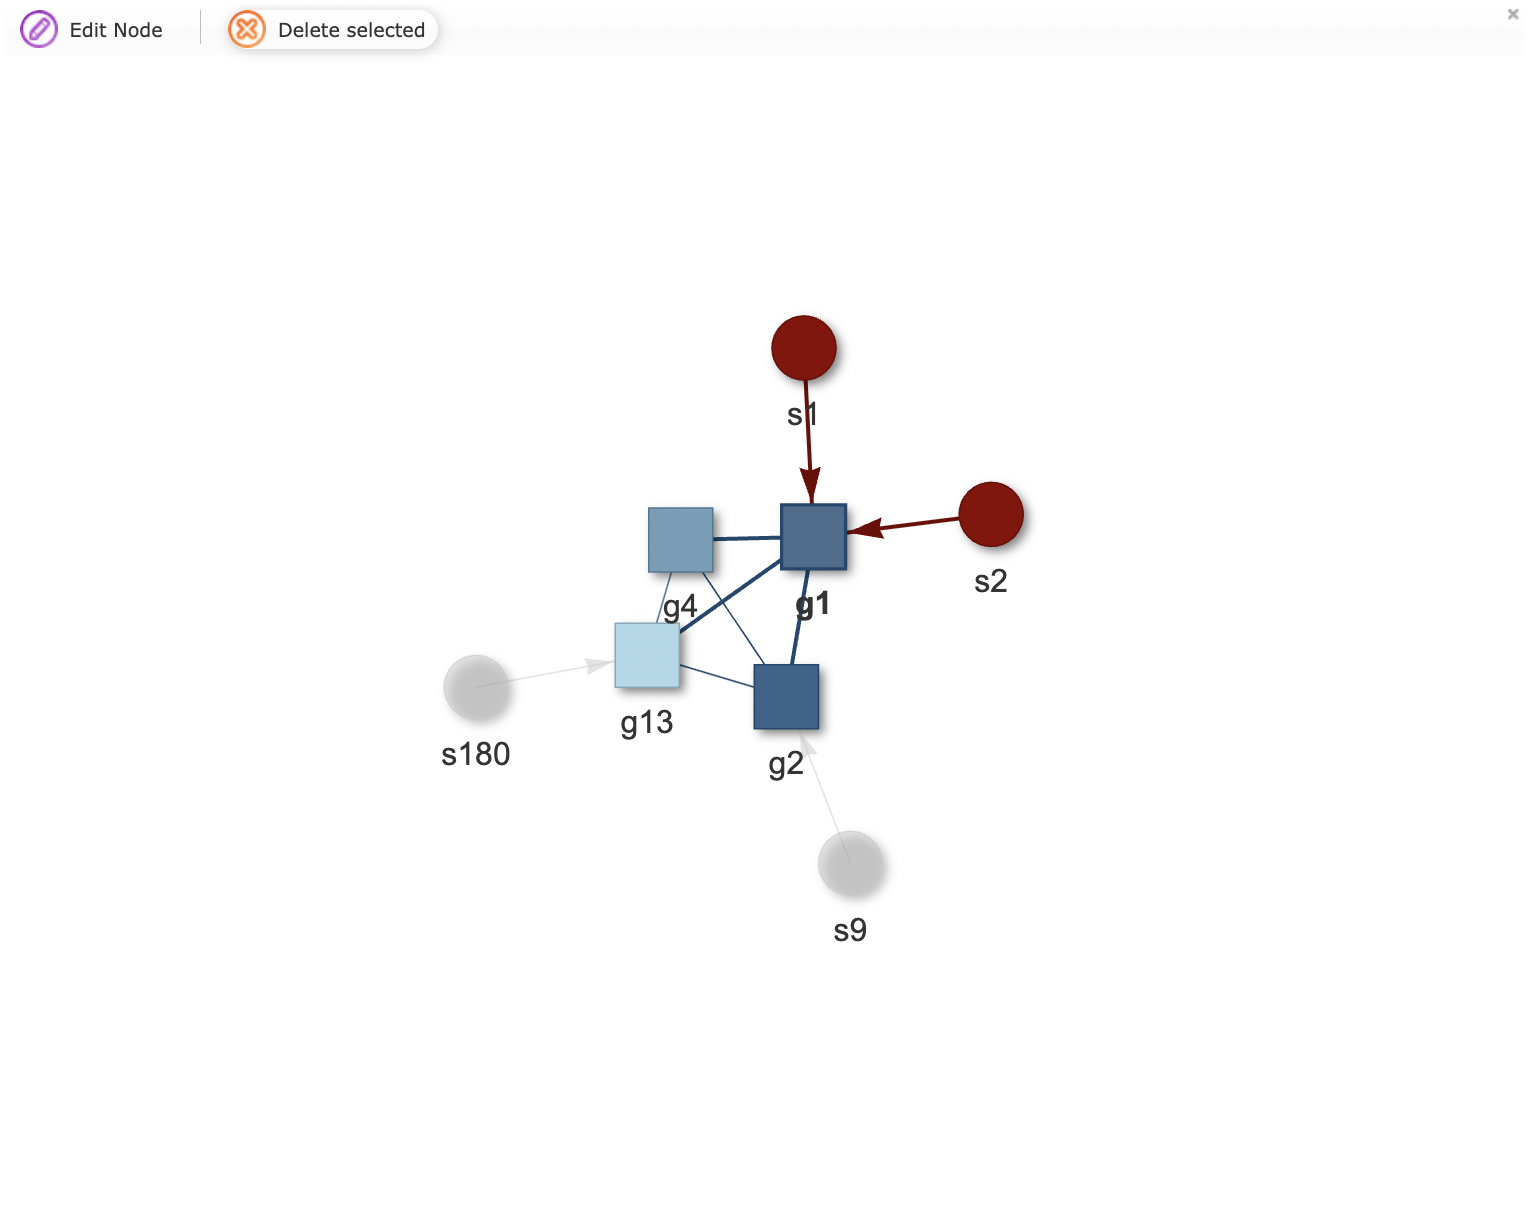
- Click "RERUN" to generate new GRN
- Explore perturbed GRN


The multioviz package contains a runMultioviz() function that allows users to connect the perturbation and visualization capabilities of the Multioviz platform with their computational method that performs feature selection and prioritization. The function accepts 3 parameters runMultioviz(X, y, mask) to run user data with BANNs, and 4 parameters runMultioviz(X, y, mask, userScript) to run user data with the user's own feature selection and prioritization method.
Once the multioviz package has been installed, run Rscript demo.R in the command line for a demo.
 example")
- Write script with a
runModel()function - Save X, y, and mask files as .rda files
- Load in X, y, and mask files
> load('path to X.rda file')
> load('path to y.rda file')
> load('path to mask.rda file')
- Save path to the user script as a variable
> userScript = "'path to user script'"
- Run app with runMultioviz(X, y, mask, userScript) function
> runMultioviz(X.rda, y.rda, mask.rda, userScript)
- Follow perturbation steps from the section above
H. Xie, L. Crawford, and A.M. Conard. Multioviz: an interactive platform for in silico perturbation and interrogation of gene regulatory networks. bioRxiv. 2023.10.10.561790.
For questions or concerns with the Multioviz platform or software, please contact Ashley Mae Conard, Lorin Crawford, or Helen Xie.
We welcome and appreciate any feedback you may have with our software and/or instructions.