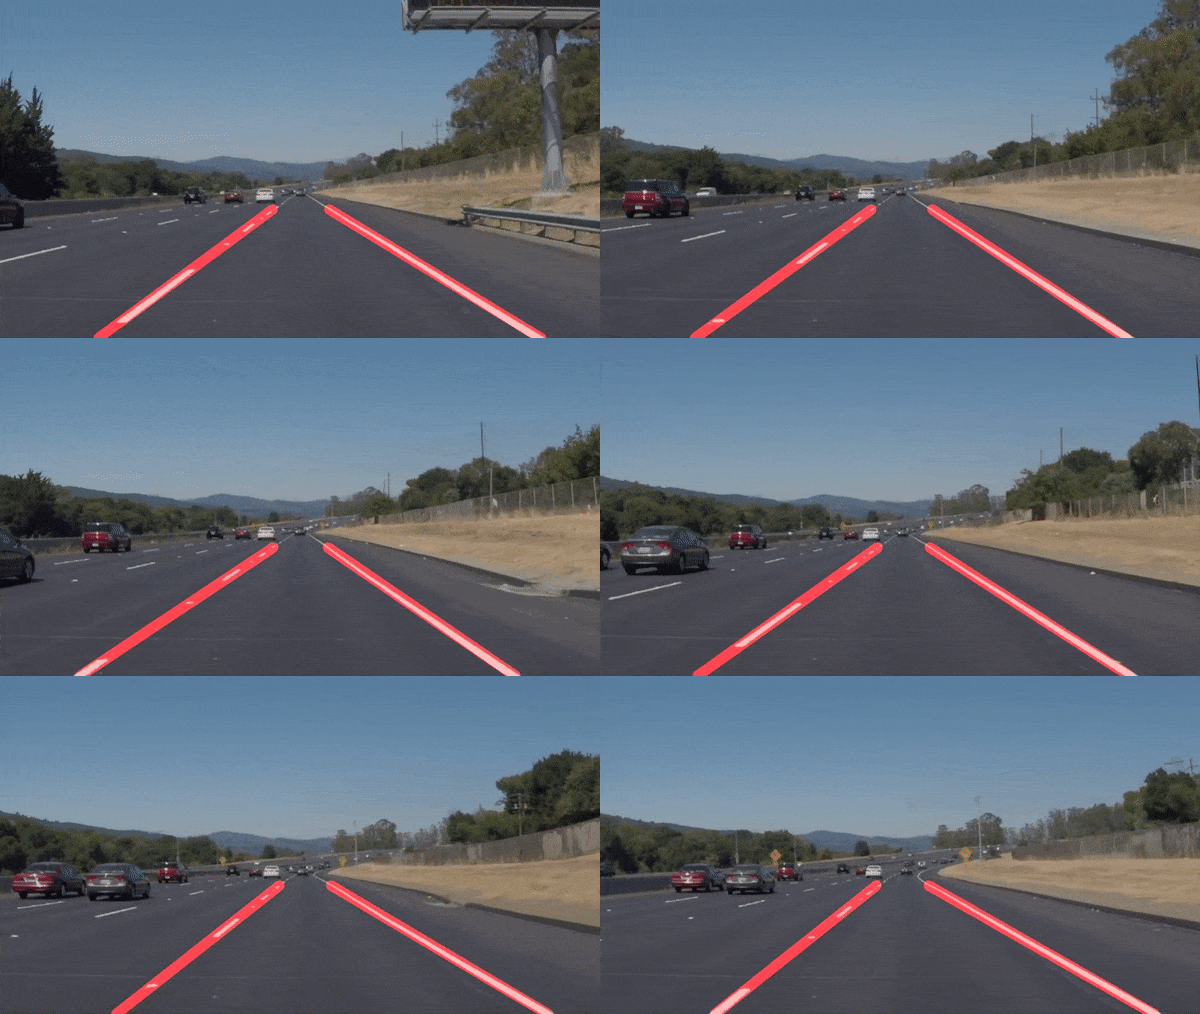
When we drive, we use our eyes to decide where to go. The lines on the road that show us where the lanes are act as our constant reference for where to steer the vehicle. Naturally, one of the first things we would like to do in developing a self-driving car is to automatically detect lane lines using an algorithm.
In this project we will detect lane lines in images using Python and OpenCV. OpenCV means "Open-Source Computer Vision", which is a package that has many useful tools for analyzing images.
Pipeline consisted of 7 following steps:
- Convert image to gray-scale
- Apply Gaussian Blur to smoothen edges
- Apply canny to obtain edges on smoothed gray image with the chosen high and low thresholds
- Set vertices of the region of interest
- Apply an image mask according to chosen set of region of interest coordinates
- Obtain a list of hough lines within a region of interest according to given set of hyperparameters and plot them into a blank image (all black)
- Superimpose the lanes found on to the original image
There are multiple lines detected for a lane line. We should come up with an averaged line for that. In order to draw a single line on the left and right lanes, I created the draw_lane_lines() function the following way:
- All obtained hough lines being separated into two heaps denoting left and right lanes according to their slope ('m' in y = mx + b equation). The left lane should have a positive slope, and the right lane should have a negative slope. Therefore, we'll collect positive slope lines and negative slope lines separately.
- Average slopes and intercepts (m's and b's in y=mx+b) within each heap. It yields data for 2 linear functions at maximum (one for left and one right lane)
- Draw those averaged lines across the full extent of the region of interest
Note: In the image, y coordinate is reversed. The higher y value is actually lower in the image. Therefore, the slope is negative for the left lane, and the slope is positive for the right lane.
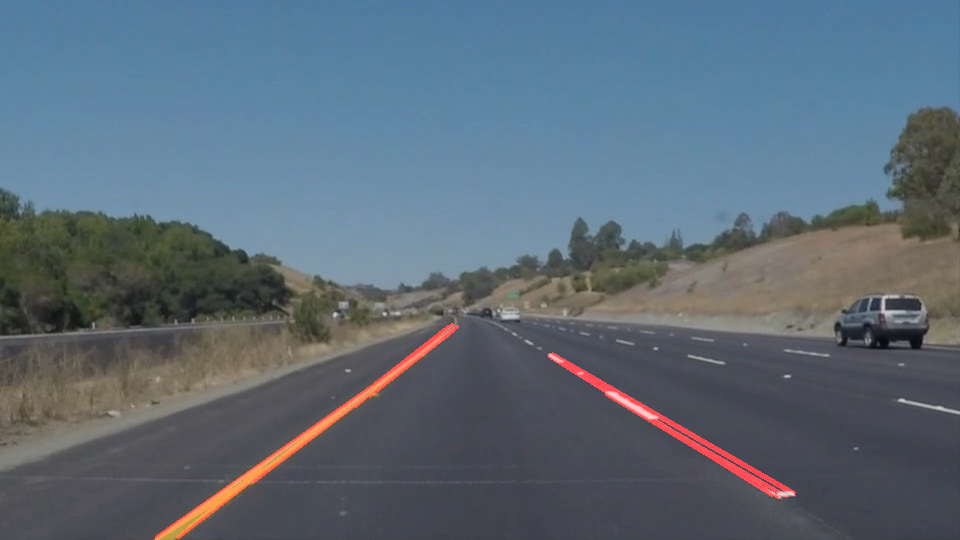
Potential shortcomings are mostly related to detection of false positives and possible lack of true positives.
-
Here we can see that canny function fails to detect the left lane while it is definitely present within the original image.
-
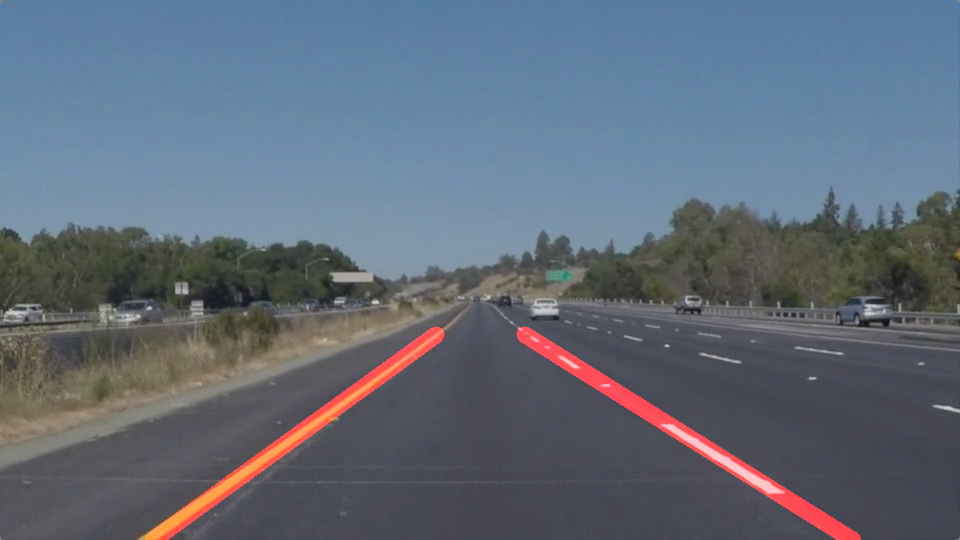
Another possible shortcoming is that averaged slopes and intercepts implicitly contain values of all lines participating in averaging and it can possibly lead to not exactly following the lanes markings.
An improvement for better performance with false positives / true positives would probably be to better tune the hyperparameters: kernel, thresholds, minimum line length, maximum line gap etc. But there is a danger to 'overfit' for some particular image class which would ultimately affect the overall performance. In my opinion, there is always a tradeoff, and, after all, it is probably better not to detect the existing lane line at all rather then falsely detect the non-existing one.
To address the average lines not exactly following the actual lanes probably requires some more sophisticated averaging techniques, maybe involving operations across the neighbouring frames.
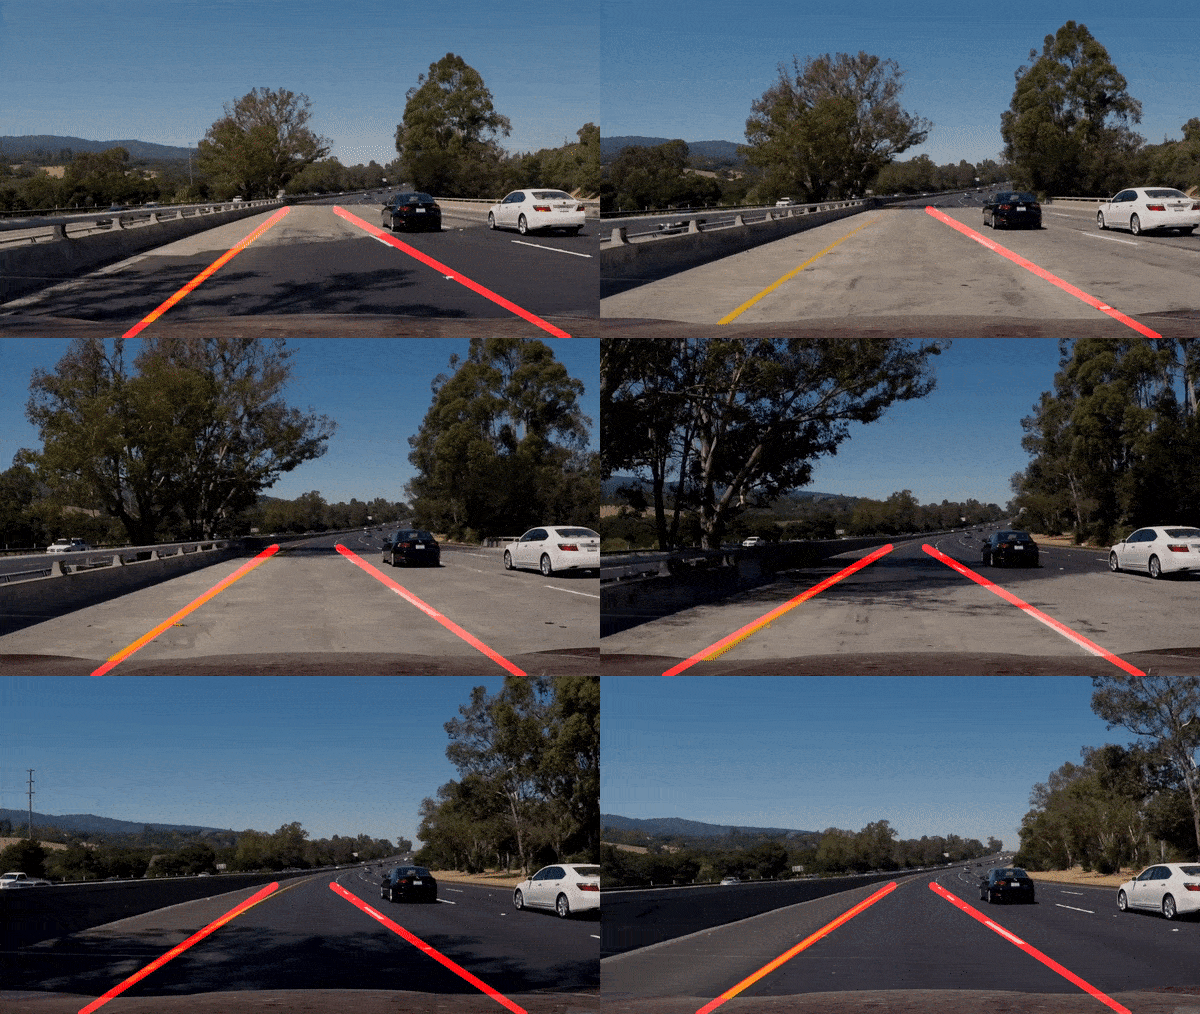
To improve detection I've implemented two techniques:
- filtering out of lines with too steep and too gradual slopes
- removing mostly vertical and horizontal lines, which are of no interest for the task
The repository contains the resulting video of an optional challenge as 'challenge.mp4'


