These images are now produced in tedana, which can be found here: https://github.com/ME-ICA/tedana
This "toolbox" is no longer maintained, updated and may not even work anymore. The figures are produced by default in the much improved multi-echo denoising package tedana.
meica_tool
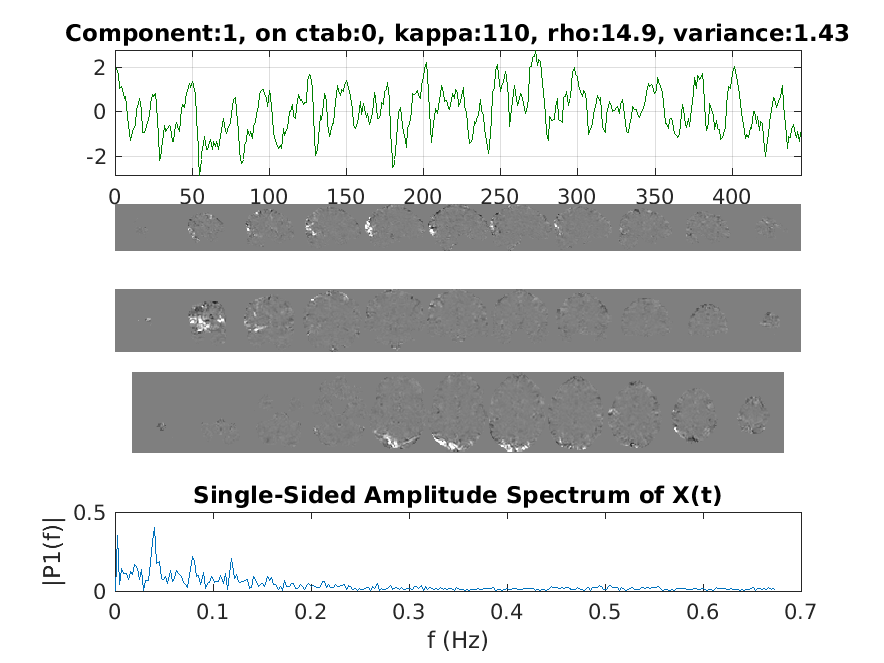
I've created a handy matlab script that works with meica.py (https://bitbucket.org/prantikk/me-ica) v3 - from the experimental branch.
It creates a series of figures that are useful for visualizing the output in a quick manner, including component timeseries from meica.py, color coded on whether they were:
- BOLD-like - green
- Non-BOLD - red
- r2 weighted - pink
- Ignored - black.
2017/09/22 update - now more 4ier - enjoy a fft plot.
Each plot includes brain slices of the component beta values (from TED/betas_OC.nii)
- motion parameters and framewise displacement
- kappa vs rho scatter plot, where size is proportaional to variance, colors as above
- kappa vs rho line plot
- Bar plot of variance explained
- tSNR figures, with histograms
It then creates a bar plot showing the relative variance of each of those categories.
Its (still) ugly code, but effective...for now.
Current dependencies include:
But these few functions will eventually be packaged together and included.
Usage
- Add to matlab path
- run meica_component_displayer(tr), where tr is the repitition of your EPI timeseries in seconds.
- select the meica.py output folder, ex. meica_nback_e1.label
- wait a bit
Example Figures


Thanks to bramila framewise displacement and detrend code (from https://git.becs.aalto.fi/bml/bramila/tree/master) for dvars calculation