A bioinformatics web tool built with streamlit and scanpy for genomics data processing and analysis 🧬🐍.
Deep neural networks have many potential use cases for genomic analyses including quality control, dimensionality reduction or even spatial transcriptomics. Nuwa aims to integrate several deep learning models in a visual, easy to use interface with other filtering and data analysis familiar to scanpy users.
Warning
Project is still in its infancy, not recommended for use in research or commercial use. Still missing support for exporting some python and R scripts.
Make sure docker and docker-compose are installed on your host machine.
Next, clone the repo:
git clone https://github.com/nuwa-genomics/Nuwa.git && cd Nuwa1.Make sure cuda drivers are installed on the host machine.
2.Install and configure Nvidia container toolkit for docker
3.Bring up containers using CUDA dockerfile:
docker-compose -f cuda.docker-compose.yml up -d --buildBring up containers using CPU dockerfile:
docker-compose -f cpu.docker-compose.yml up -d --buildThen visit http://localhost in your browser.
See our Documentation for more information and tutorials.
- Ensure system clock is correct if you encounter release file invalid error when building images:
E: Release file for http://archive.ubuntu.com/ubuntu/dists/focal-updates/InRelease is not valid yet (invalid for another 1min 55s). Updates for this repository will not be applied.
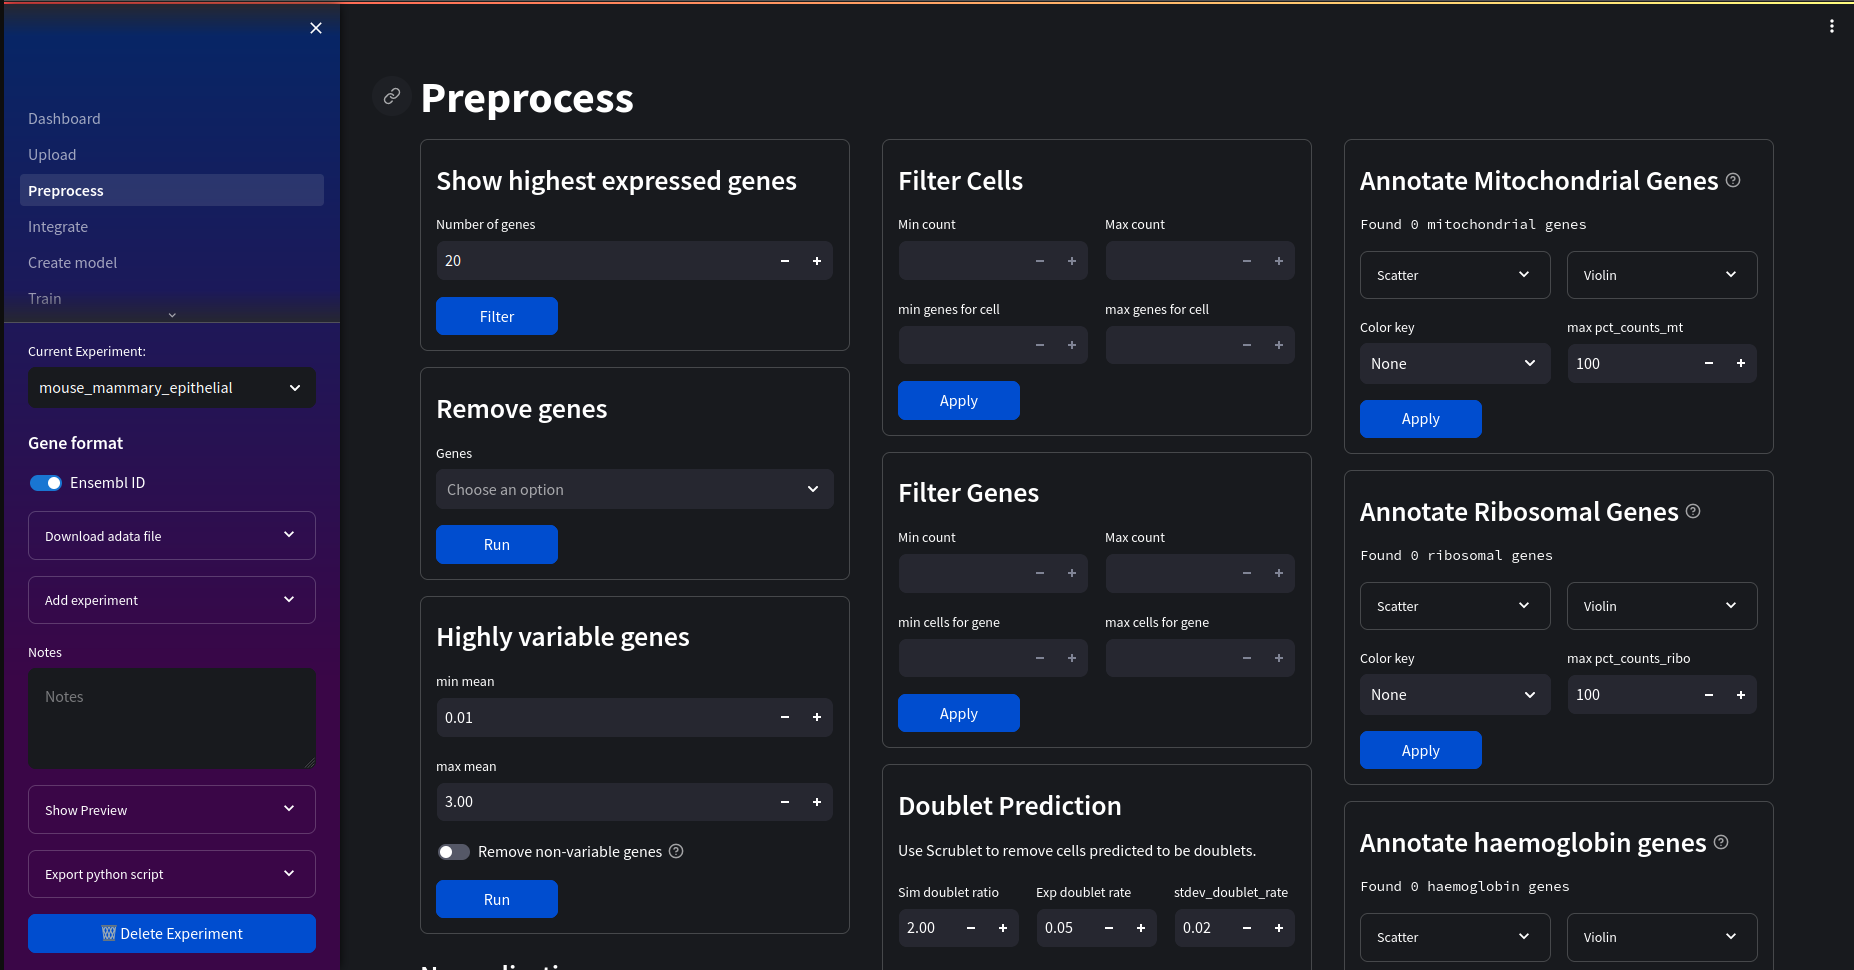
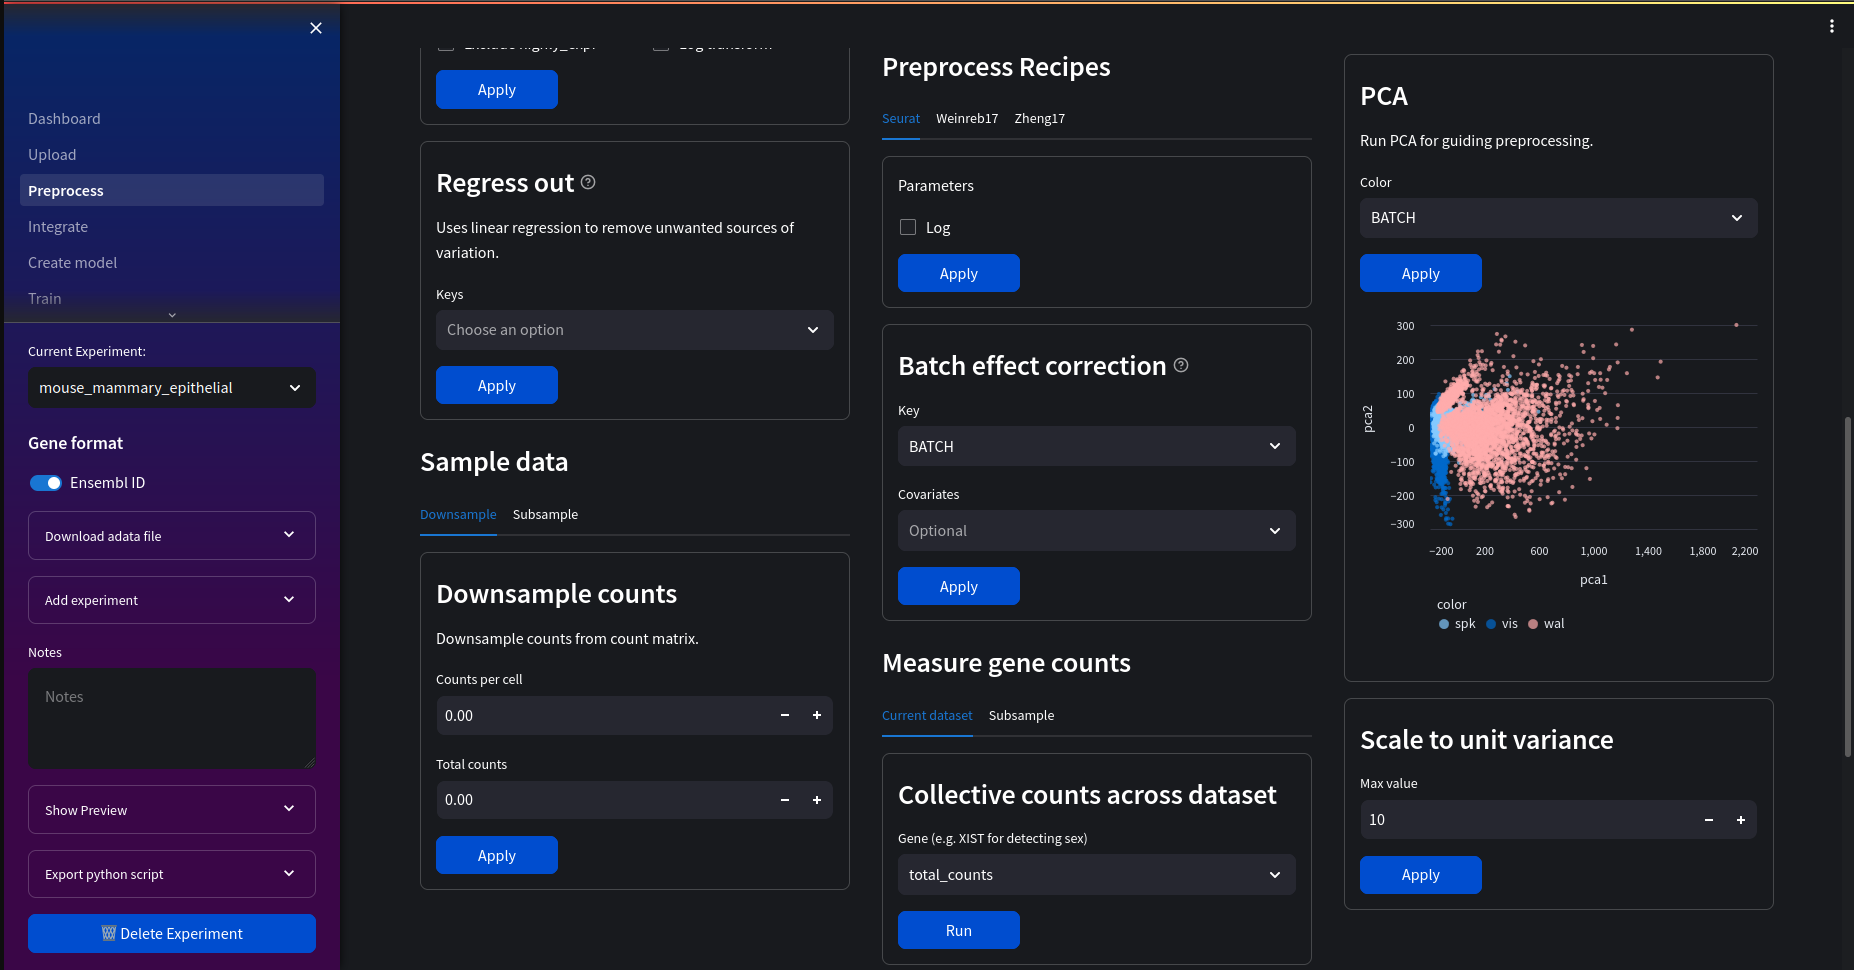
Preprocess 10x genomics reads using scanpy's preprocessing module:
- Filter genes and cell metrics
- Annotate and filter mitochrondrial, ribosomal and haemoglobin genes
- Show highly variable genes
- Show most expressed genes
- Normalize, logarithmize and scale data
- Doublet detection
- Batch effect correction
- Cell cycle scoring
- Apply recipes to quickly preprocess data
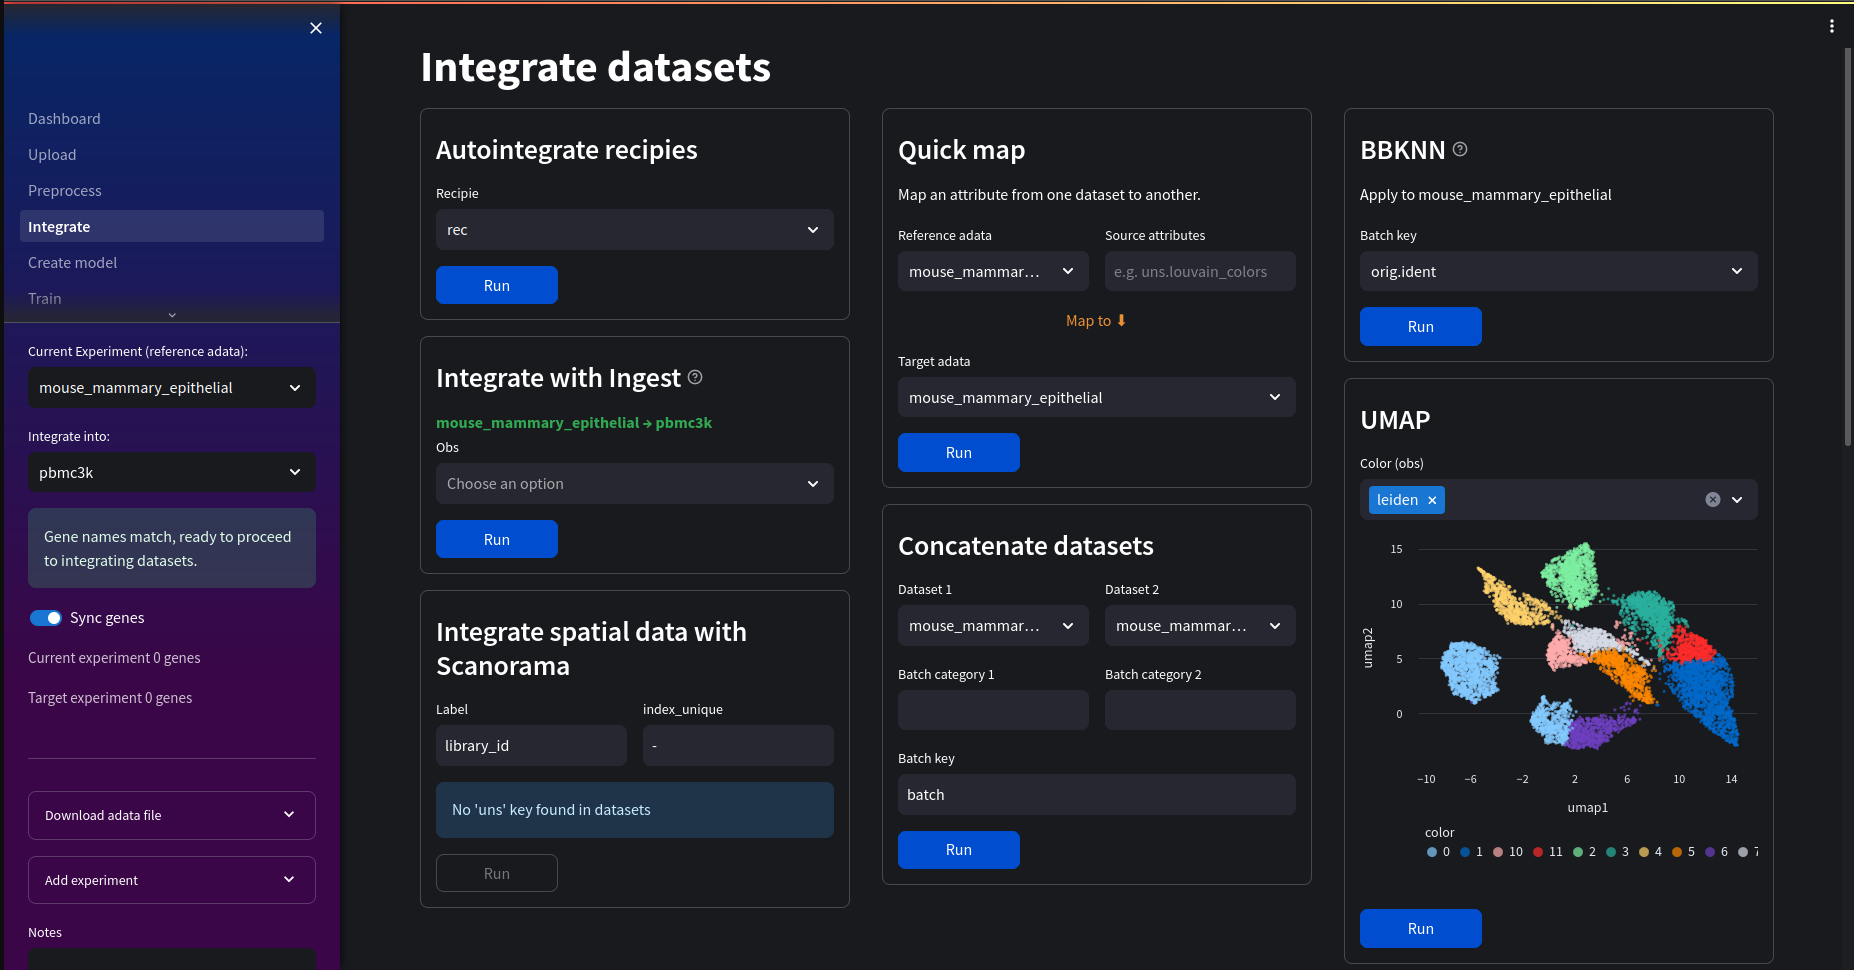
Integrate a variety of dataset types using Scanpy's external integration libraries and SCVI toolkit, along with useful pandas data manipulation for dataframes.
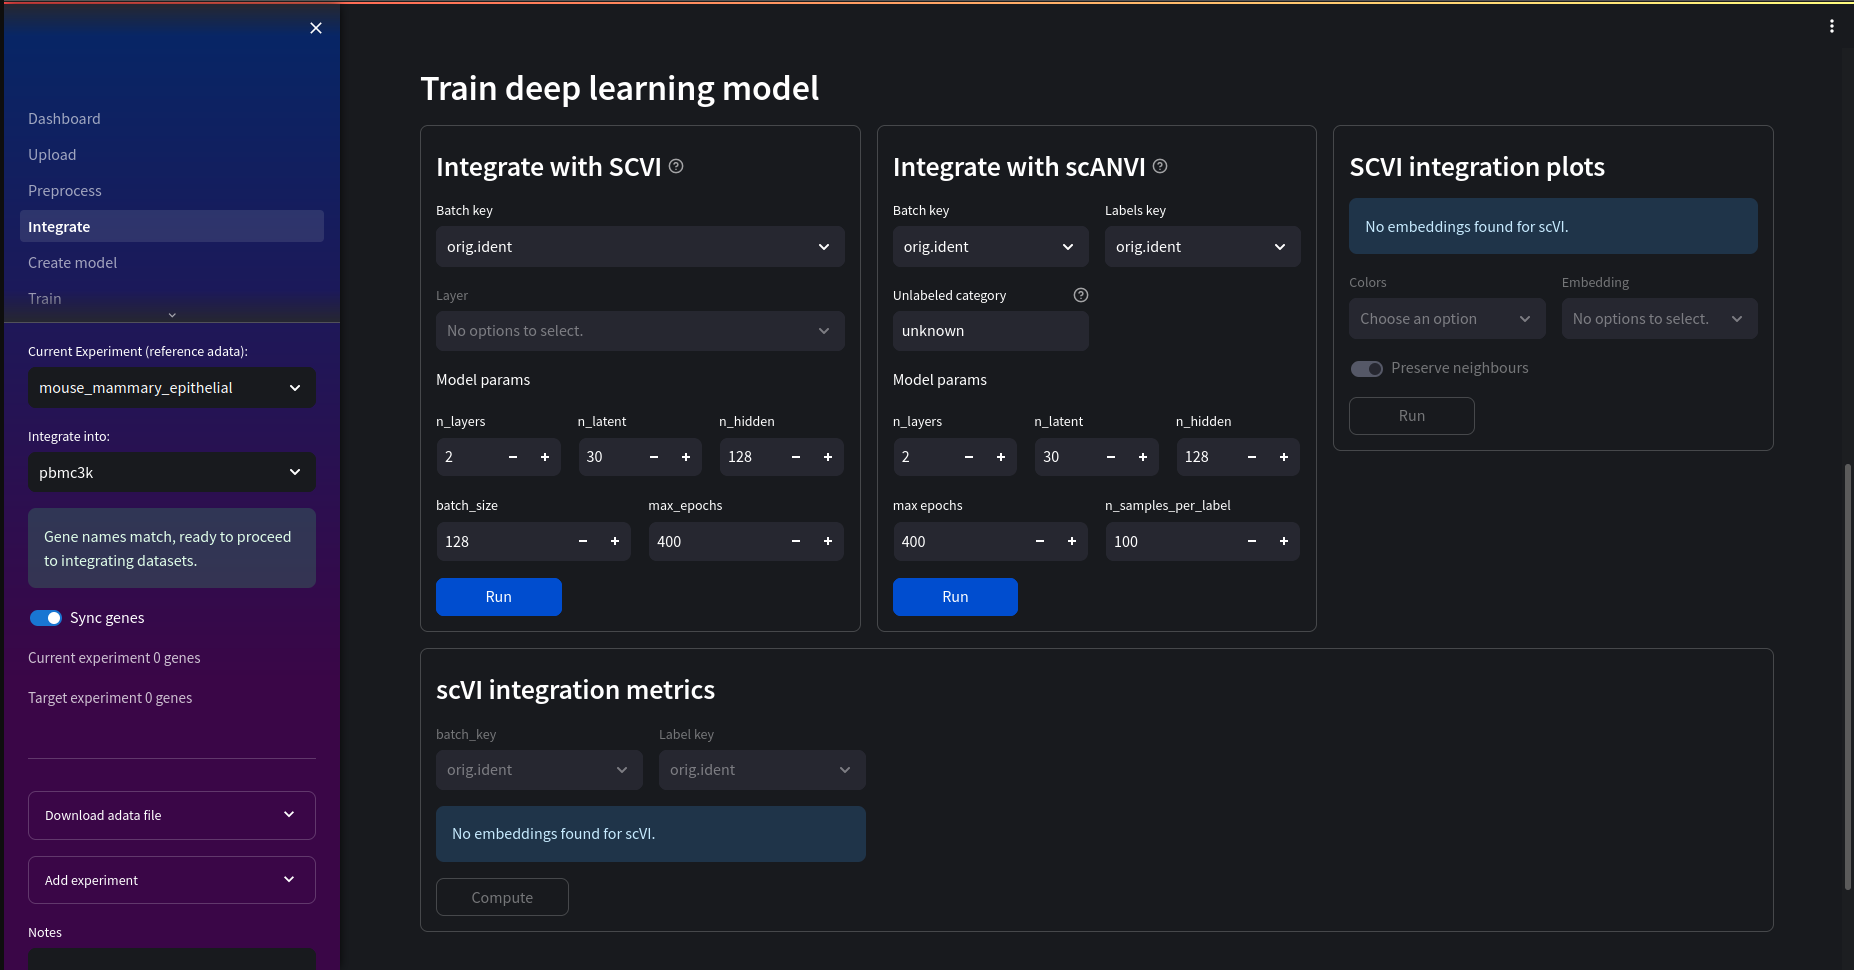
You can also train a deep learning model to integrate datasets using SCVI and scANVI.
Available models:
- Cite-seq dimensionality reduction for cluster analysis.
- Solo Remove doublets using semi-supervised autoencoders.
Automatically selects a Cuda capable GPU for faster training if one is available.
Cluster analysis consists of:
- Autoencoder cluster plot
- tSNE cluster plot
- Principal Component Analysis of selected genes
- Variance ratio of principal components
- Neighbourhood graph
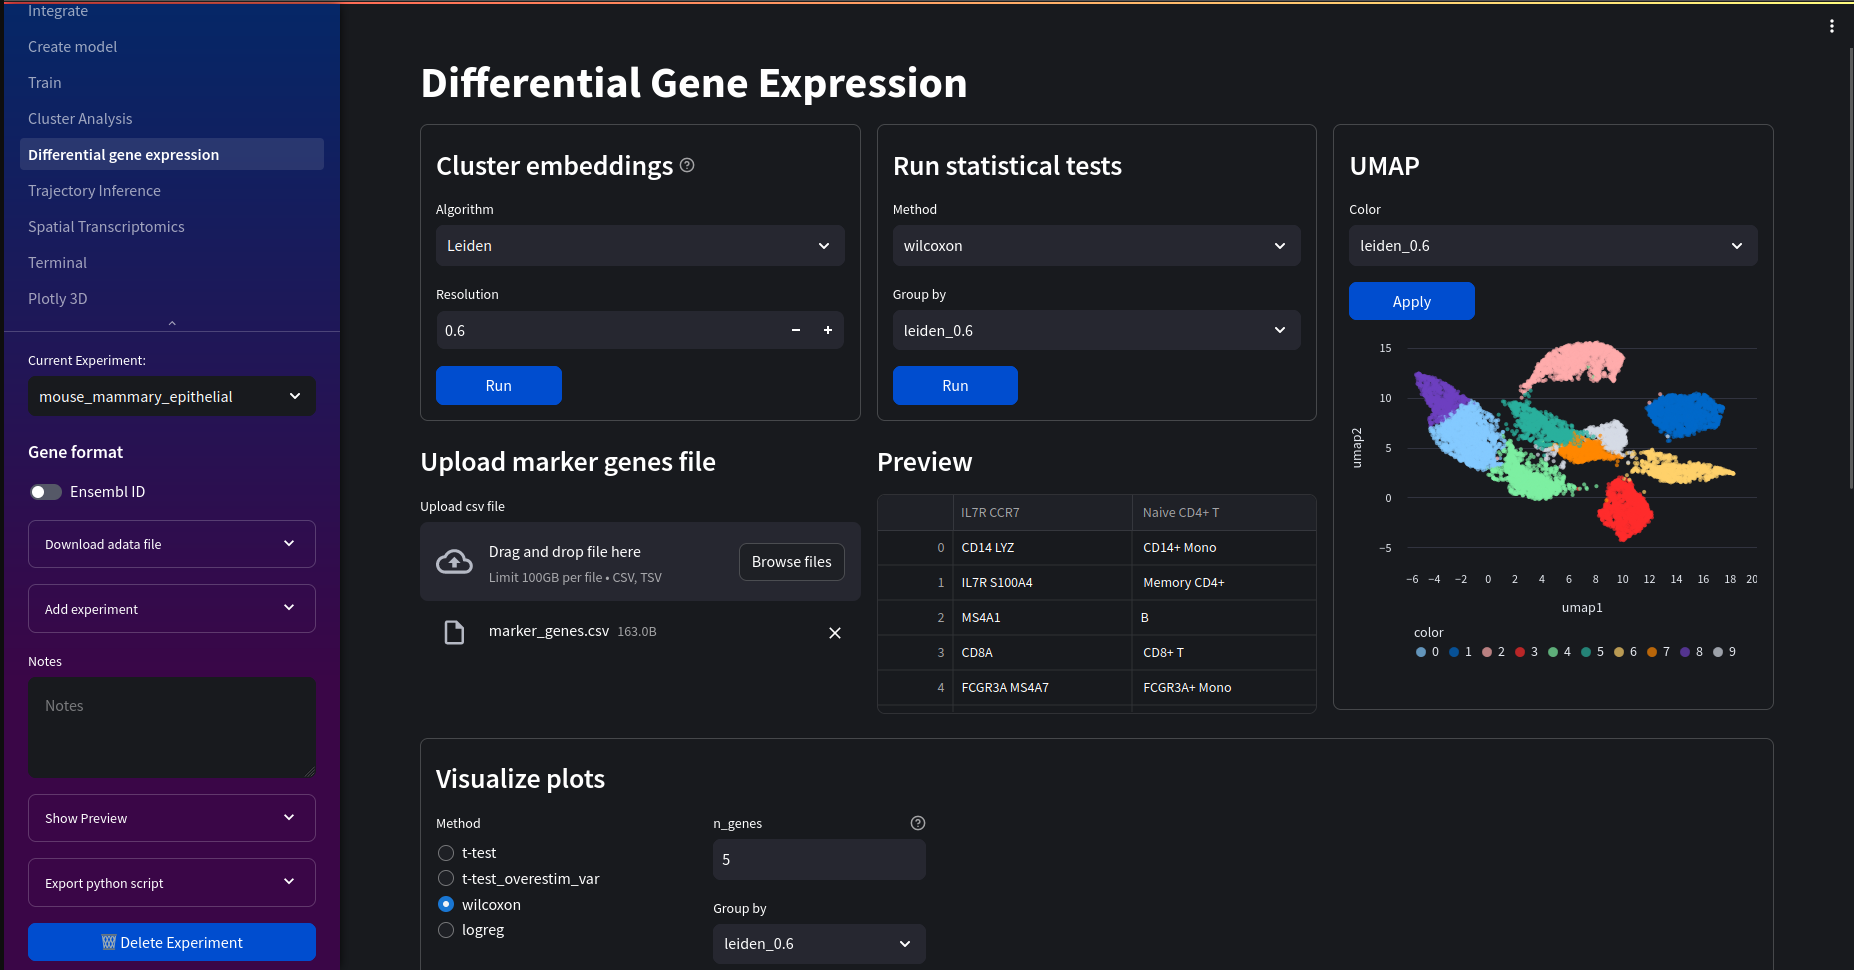
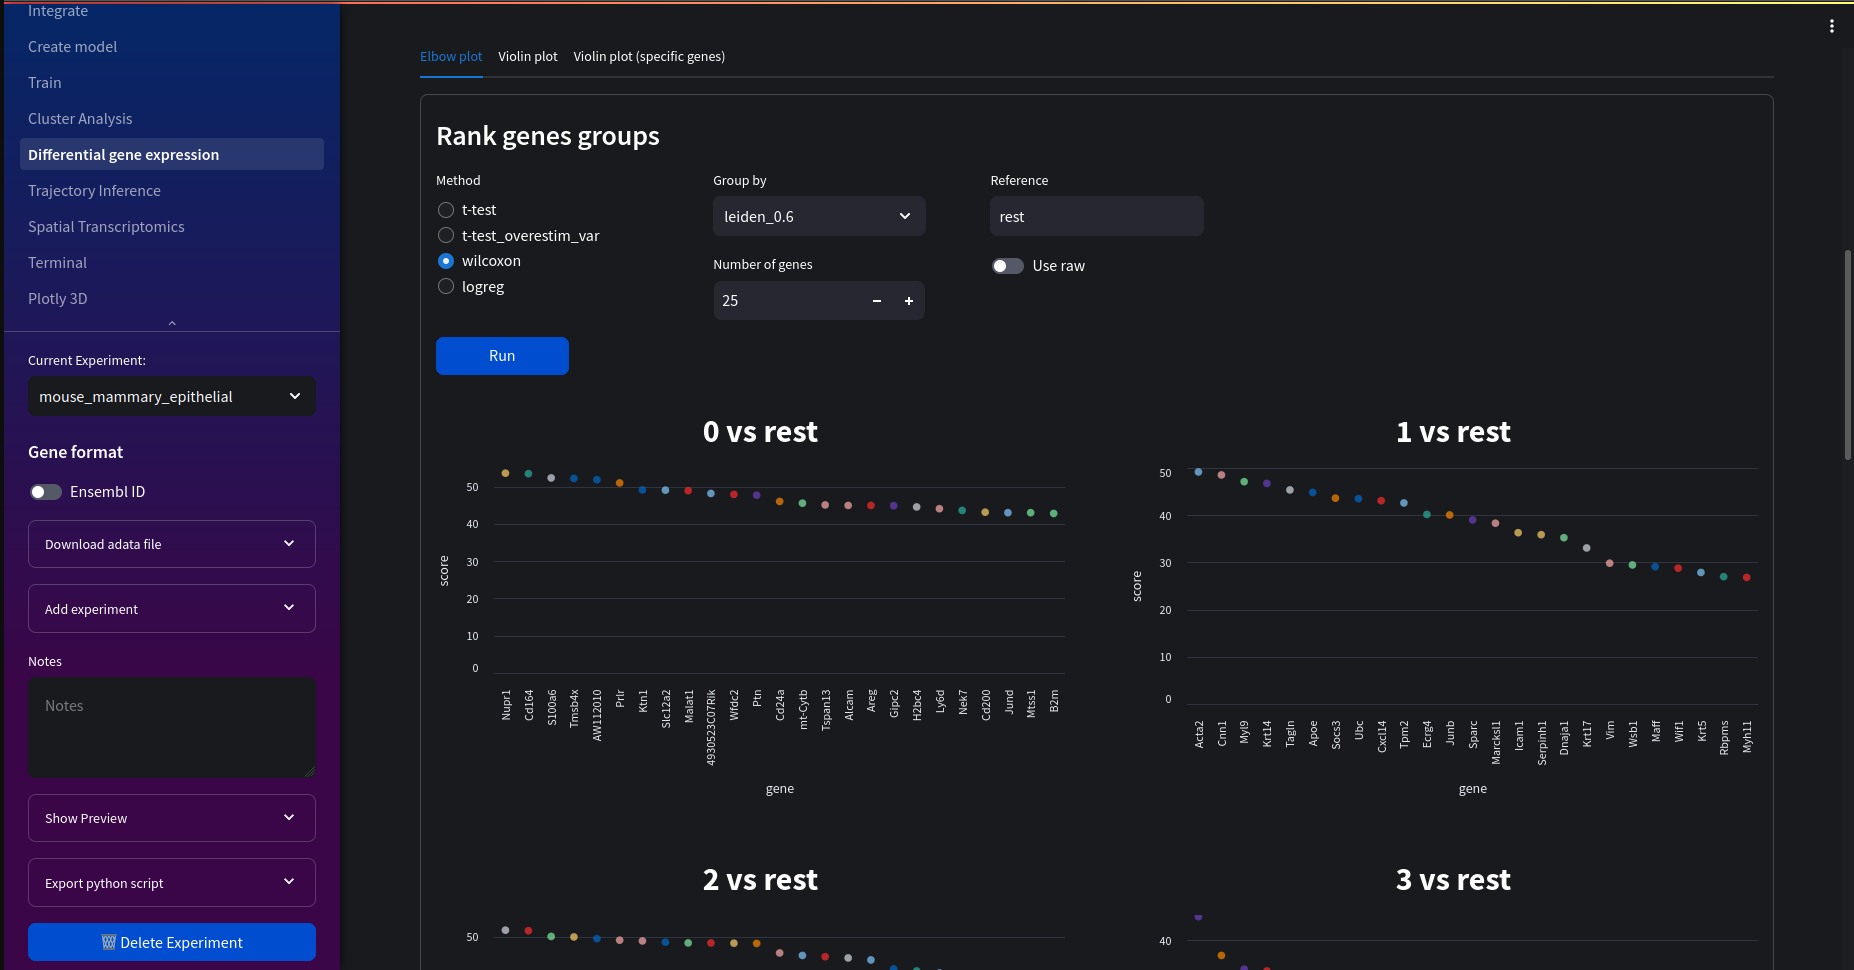
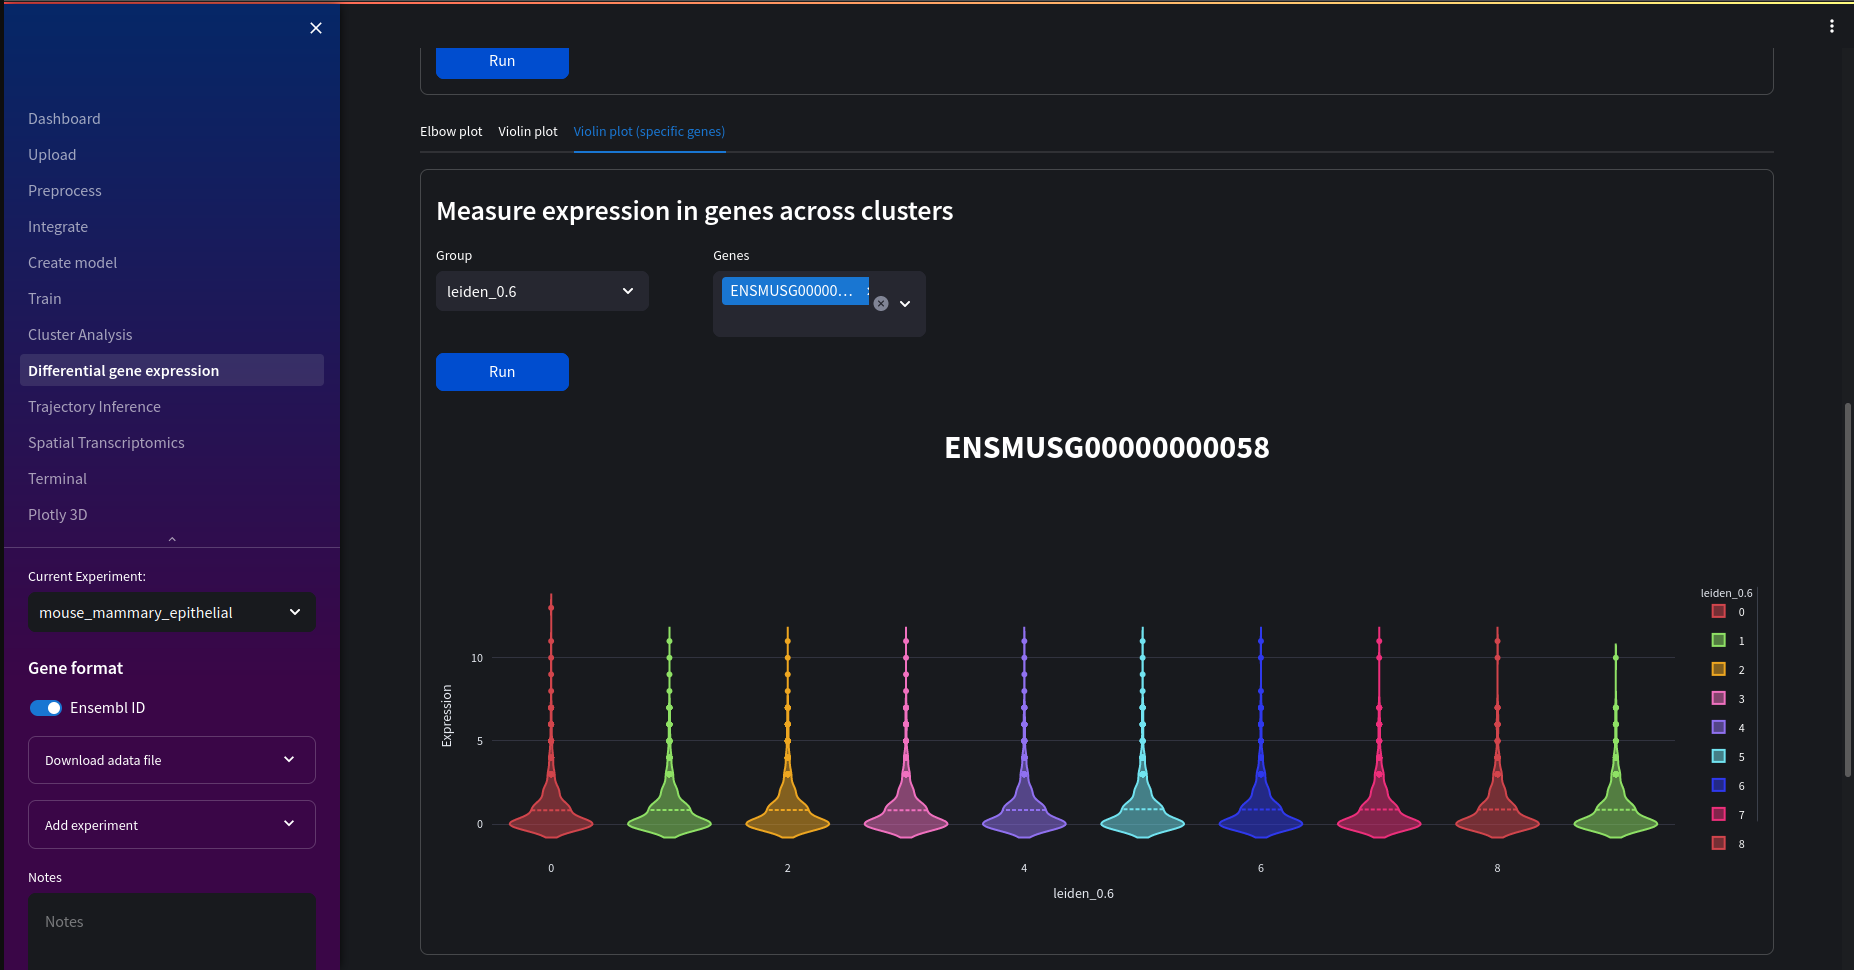
Differential gene expression looks at how genes are expressed compared to the rest of the dataset. This includes useful matrix plots, dot plots and violin vlots to visualise variable expression. You can also choose which clusters and statistical tests to run the DE analysis.
Elbow plots for comparing clusters:
Interactive violin plots for individual genes or clusters:
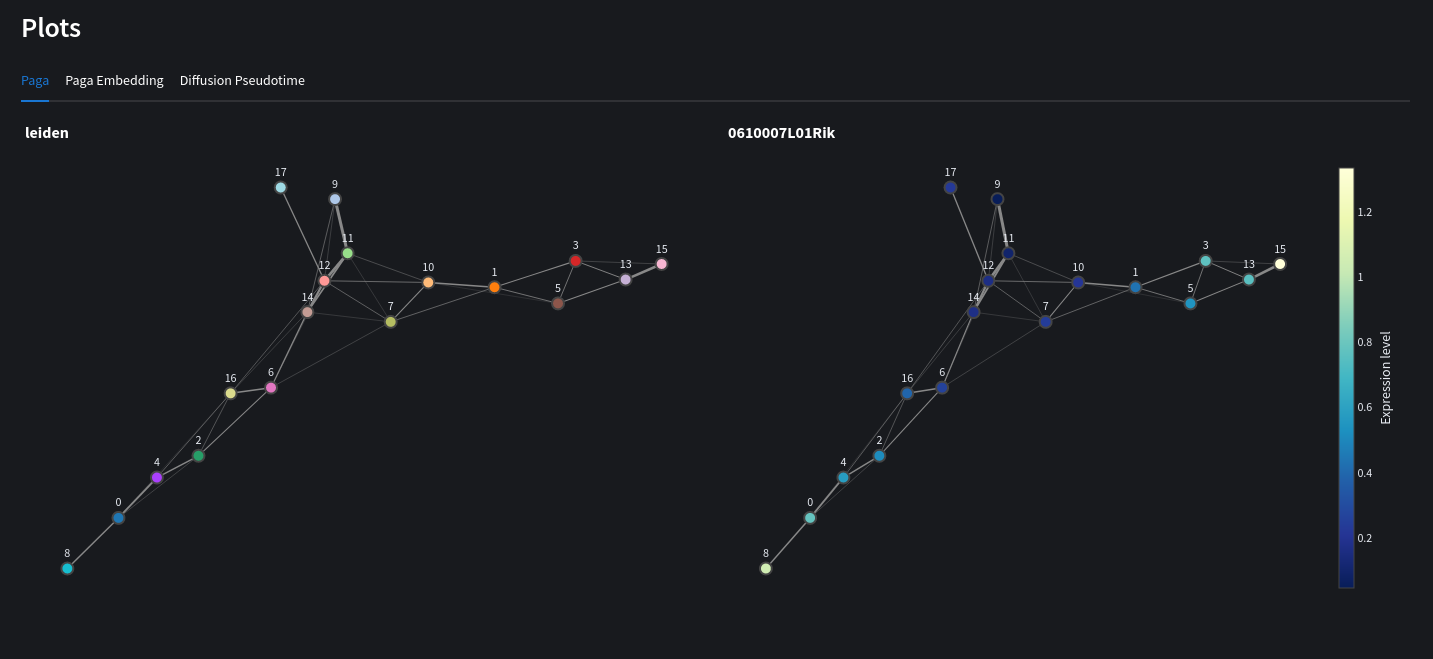
Trajectory inference gives key insights into cell differentiation through ordering the stages of development into a continuous sequence of clusters. Here you can:
- View PAGA graphs
- Embed PAGA into louvain graphs
- View diffusion pseudotime of selected genes
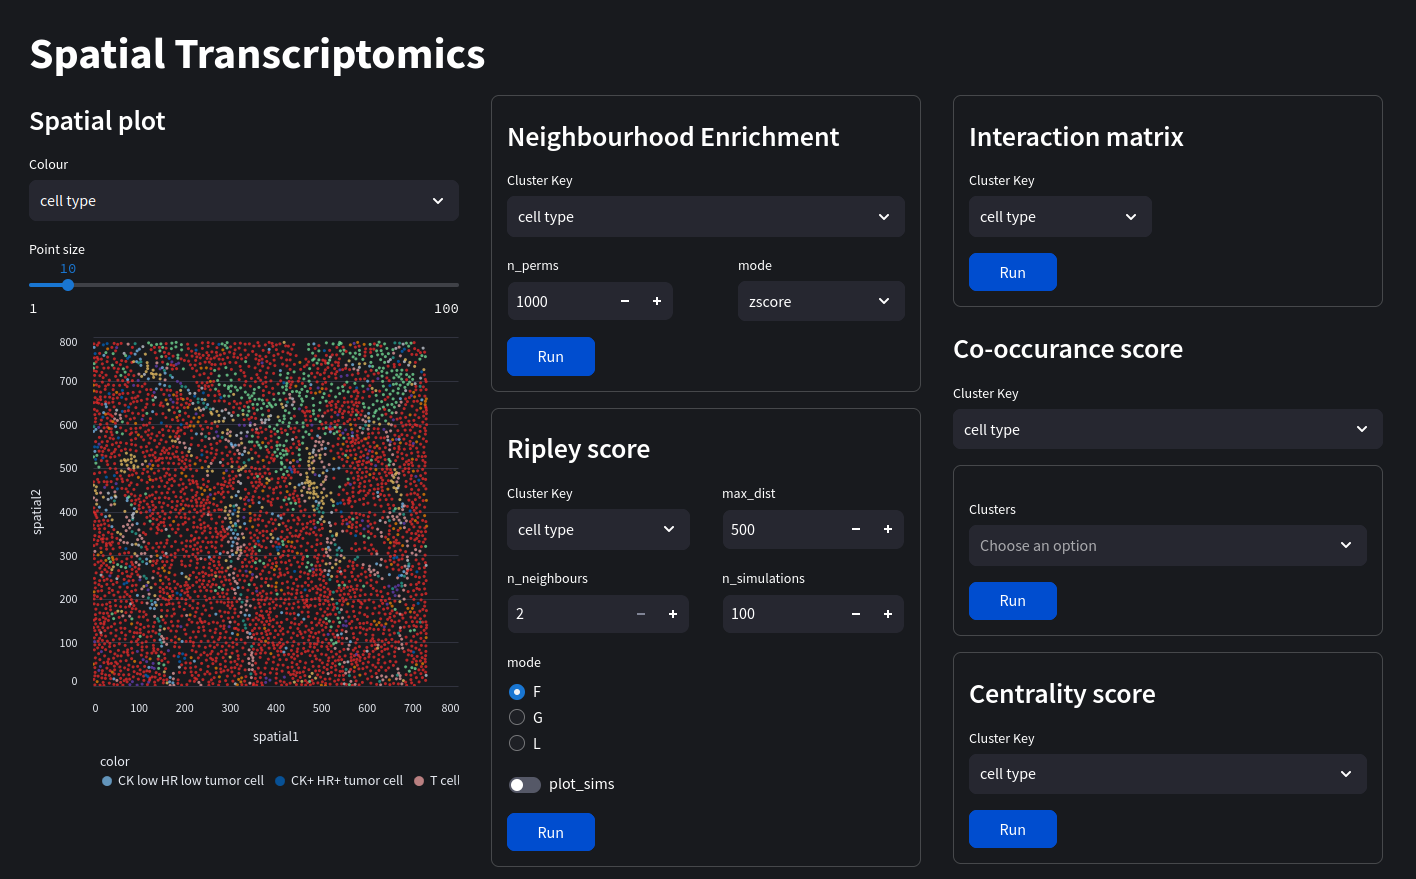
View expression profiles while retaining spatial information. Currently includes:
- Visualise spatial plots overlaid on histology images
- Neighbourhood enrichment
- Interaction matrices
- Centrality score
- Ripley score
- Co-occurance score
- Ligand-receptor interaction
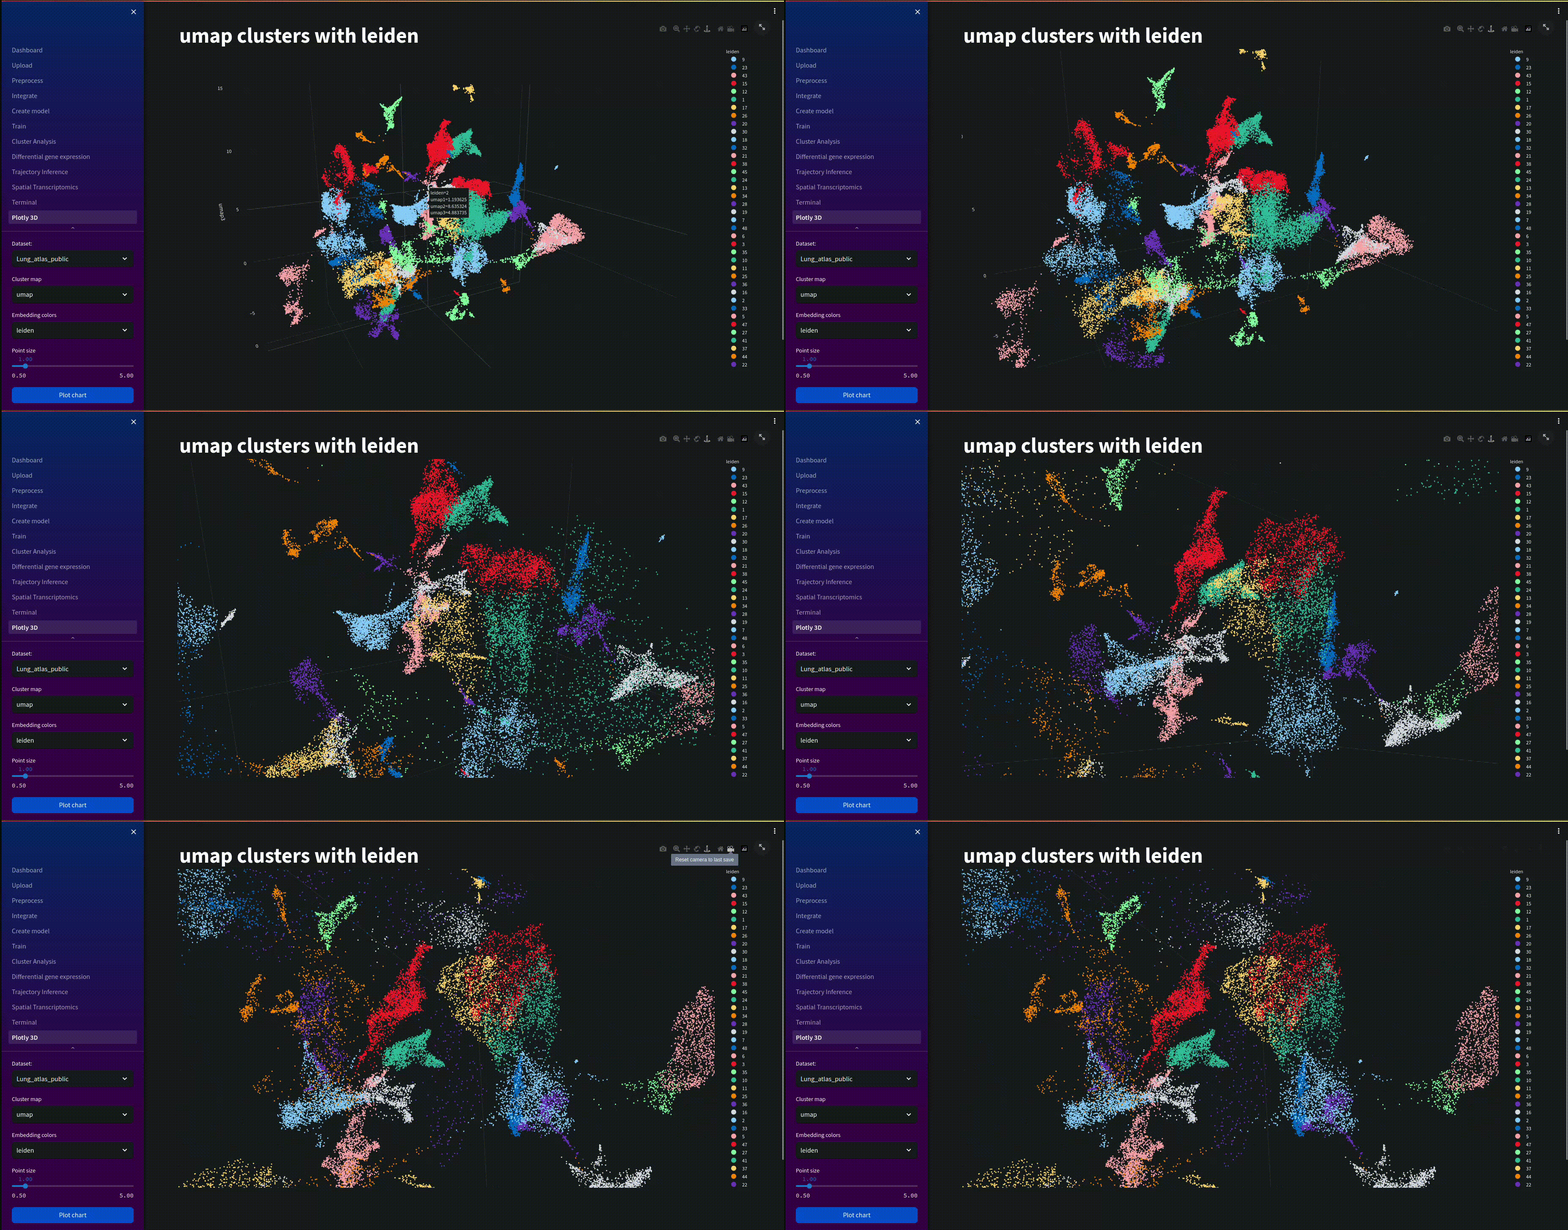
A 3D interactive chart for visualising cluster embeddings.
You can access the docker container by running:
docker exec -it streamlit bash
cd ../streamlit-volume/
#activate bioconda environment
source activate bioconda_env
#interactive python
python3
#also interactive R
R
From here you can access many of the python and R packages availble within bioconda.
The streamlit volume is mounted within the installation path of the git repository.
├── Nuwa
    ├── streamlit-volume
        ├── exported_workspaces
        |   ├── workspace_6f2b160d4a89bafe
        |       ├── workspace_6f2b160d4a89bafe.h5ad
        |       ├── checksum.sha256
        ├── workspace_6f2b160d4a89bafe
            ├── adata
            |   ├── example.h5ad
            ├── downloads
            |   ├──example
            |      ├── seurat #files downloaded in seurat format
            |      |   ├── barcodes.tsv
            |      |   ├── features.tsv
            |      |   ├── matrix.mtx
            |      |   ├── metadata.csv
            |      ├── example.h5ad #files downloaded in h5ad format
            ├── uploads
├── example.h5adFor security reasons the web server is only accessible over a local interface. To disable this run:
SERVER_ADDR=0.0.0.0 docker-compose up --build
The app can then be accessed on http://IP_ADDRESS_OF_COMPUTER in your phone's browser.
The host's filesysystem will not be accessible to others.
Automated unit tests can be run using the tests docker compose file:
docker-compose -f tests.docker-compose.yml up --build
- Add other models
- Transfer learning, saving and loading models
- support other file types
- Add other analysis scores/graphs
If you have a feature request, notice a bug or have issues running the app please let us know in the Issues or Discussions tabs! Want to make a contribution? Make a pull request!
[1] Lin, X., Tian, T., Wei, Z. et al. Clustering of single-cell multi-omics data with a multimodal deep learning method. Nat Commun 13, 7705 (2022). https://doi.org/10.1038/s41467-022-35031-9.
[2] Bernstein, N., Fong, N., Lam, I. et al. (2020). Solo: Doublet Identification in Single-Cell RNA-Seq via Semi-Supervised Deep Learning. https://www.cell.com/cell-systems/fulltext/S2405-4712(20)30195-2.
[3] Adam Gayoso., Jonathan Shor. (2022). JonathanShor/DoubletDetection: doubletdetection v4.2 (v4.2). Zenodo. https://doi.org/10.5281/zenodo.6349517.
[4] Samuel L. Wolock., Romain Lopez., Allon M. Klein. (2019). Scrublet: Computational Identification of Cell Doublets in Single-Cell Transcriptomic Data. https://www.sciencedirect.com/science/article/pii/S2405471218304745.
All development is non-profit, any contributions are greatly appreciated! Donate in bitcoin to:
Bitcoin address (on-chain)
bc1qs9l5dvkrtgcxfewm5ly6rs47p2qjxv55qkqwwu

