This repository contains references to the atmospheric measurements and their post processing steps of the cruise Atlantic references and tropical Convection or short ARC. This cruise undertaken on RV Maria S. Merian has the identifier MSM114-2.
The cruise started January 23, 2023 in Mindelo, Cape Verde and ended February 22, 2023 in Punta Arenas, Chile.
Further general information about the cruise can be found in the cruise report. The data is described in detail in this paper.
The data from the different instruments have been standardised with the shipspy package to simplify the comparison between different instruments as much as possible. For reprocessing the data, use the python environment from environment.yaml and run reprocess.sh.
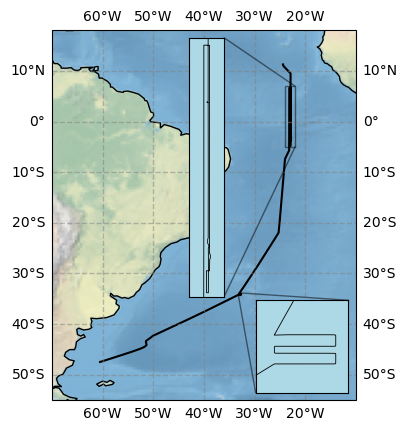
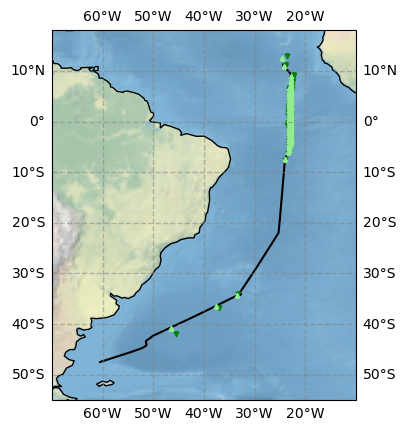
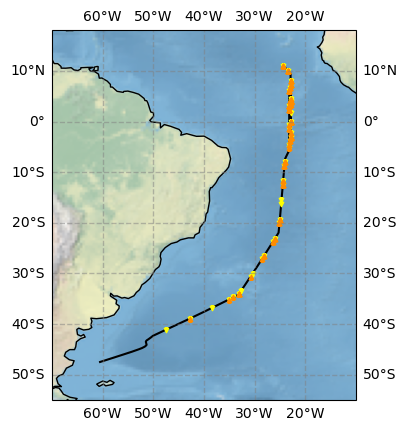
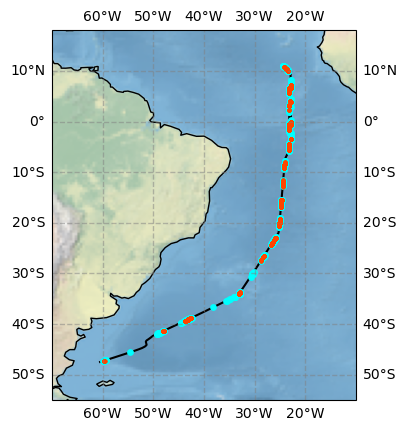
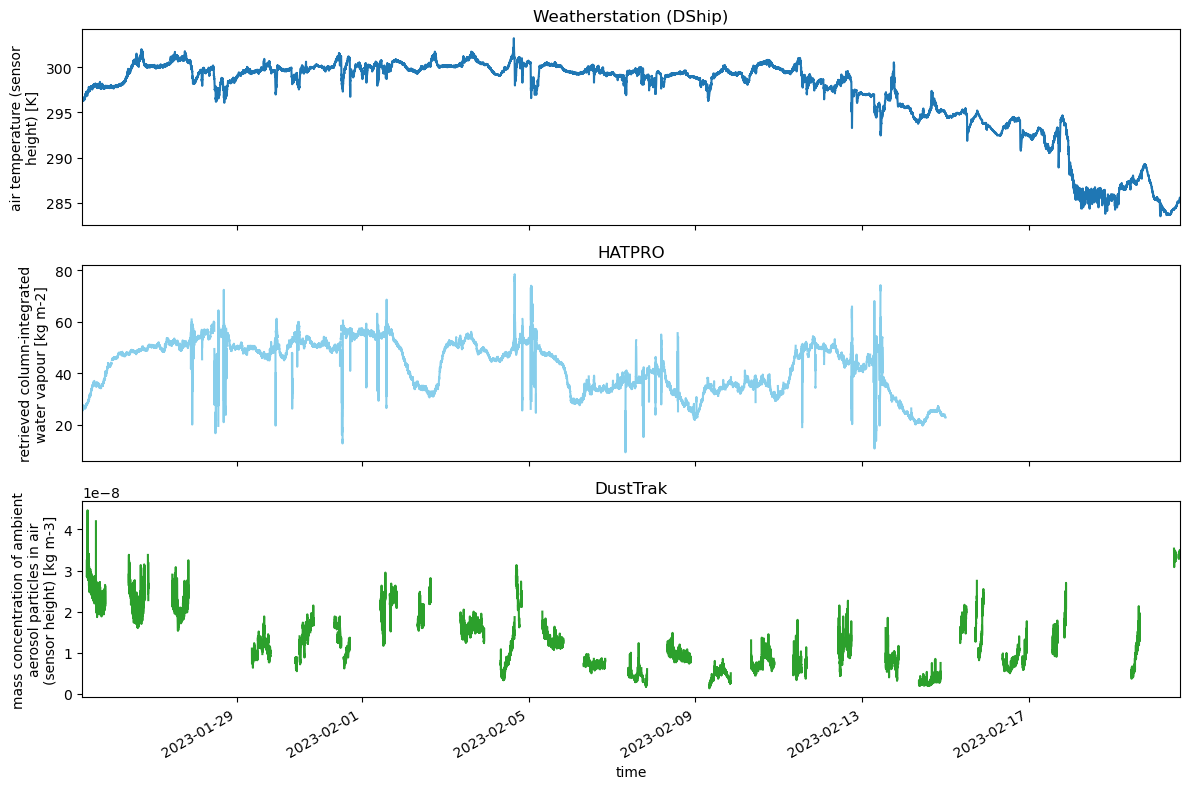
The continuous measurements (ship integrated sensors, Ceilometer, DustTrack) except the HATPRO contain data of the time period from 2023-01-25 07:00 until 2023-02-20 15:00 shown by the black trajectory. The insets are zooms in the marked rectangular regions. The start point is at 11.29˚N and 24.39˚W, the end point is at 47.48˚S and 60.62˚W. Quality controlled HATPRO data is available until 2023-02-15 00:00. The positions of the point measurements (Radiosondes, HATPRO, CTD, Calitoo, Microtops) are shown below. The equator was crossed three times during the cruise to get three complete profiles of the ITCZ which are marked by the coordinate "section" in the data sets. Section 0 corresponds to the times before the first crossing, section 1, 2, 3 corresponds to crossing 1, 2, 3, respectively, and section 4 is everything after the third crossing.
In total, 93 radiosondes were launched. Light green triangles show the positions of the radiosonde launches, dark green triangles show the position where the descents started.
Most of the time, CTDs were done twice a day (yellow triangles). When the (wind) conditions allowed for it, the UAVs were flown during the CTD times when the ship was not moving (orange triangles).
Calitoo (red dots) and Microtops (blue points) measurements where done during the whole campaign when the weather allowed. Aerosol optical thicknesses can only be derived under cloud-free conditions. Microtops data were post processed by NASA Aeronet Maritim Aerosol Network (MAN).
Plot data from various continuously measuring instruments.
import xarray as xr
import matplotlib.pyplot as plt

dship = xr.open_dataset('arc_dship.nc')
hatpro = xr.open_dataset('arc_hatpro.nc')
dusttrak = xr.open_dataset('arc_dusttrak.nc')

fig, axs = plt.subplots(3,1,figsize=(12,8),sharex=True)

var_dict = {'dship': (dship, 't_air', axs[0], 'tab:blue'), 'hatpro': (hatpro, 'cwv', axs[1], 'skyblue'), 'dusttrak': (dusttrak, 'pm_all', axs[2], 'tab:green')}

for i in var_dict.keys():
    ds = var_dict[i][0]
    var = var_dict[i][1]
    a = var_dict[i][2]
    color = var_dict[i][3]
    ds[var].plot(ax = a, c = color)
    a.set_title(ds[var].attrs['instrument'])

for ax in axs:
    ax.set_xlim(dship.time.min(), dship.time.max())
    ax.set_xlabel('')
axs[2].set_xlabel('time')

plt.tight_layout()
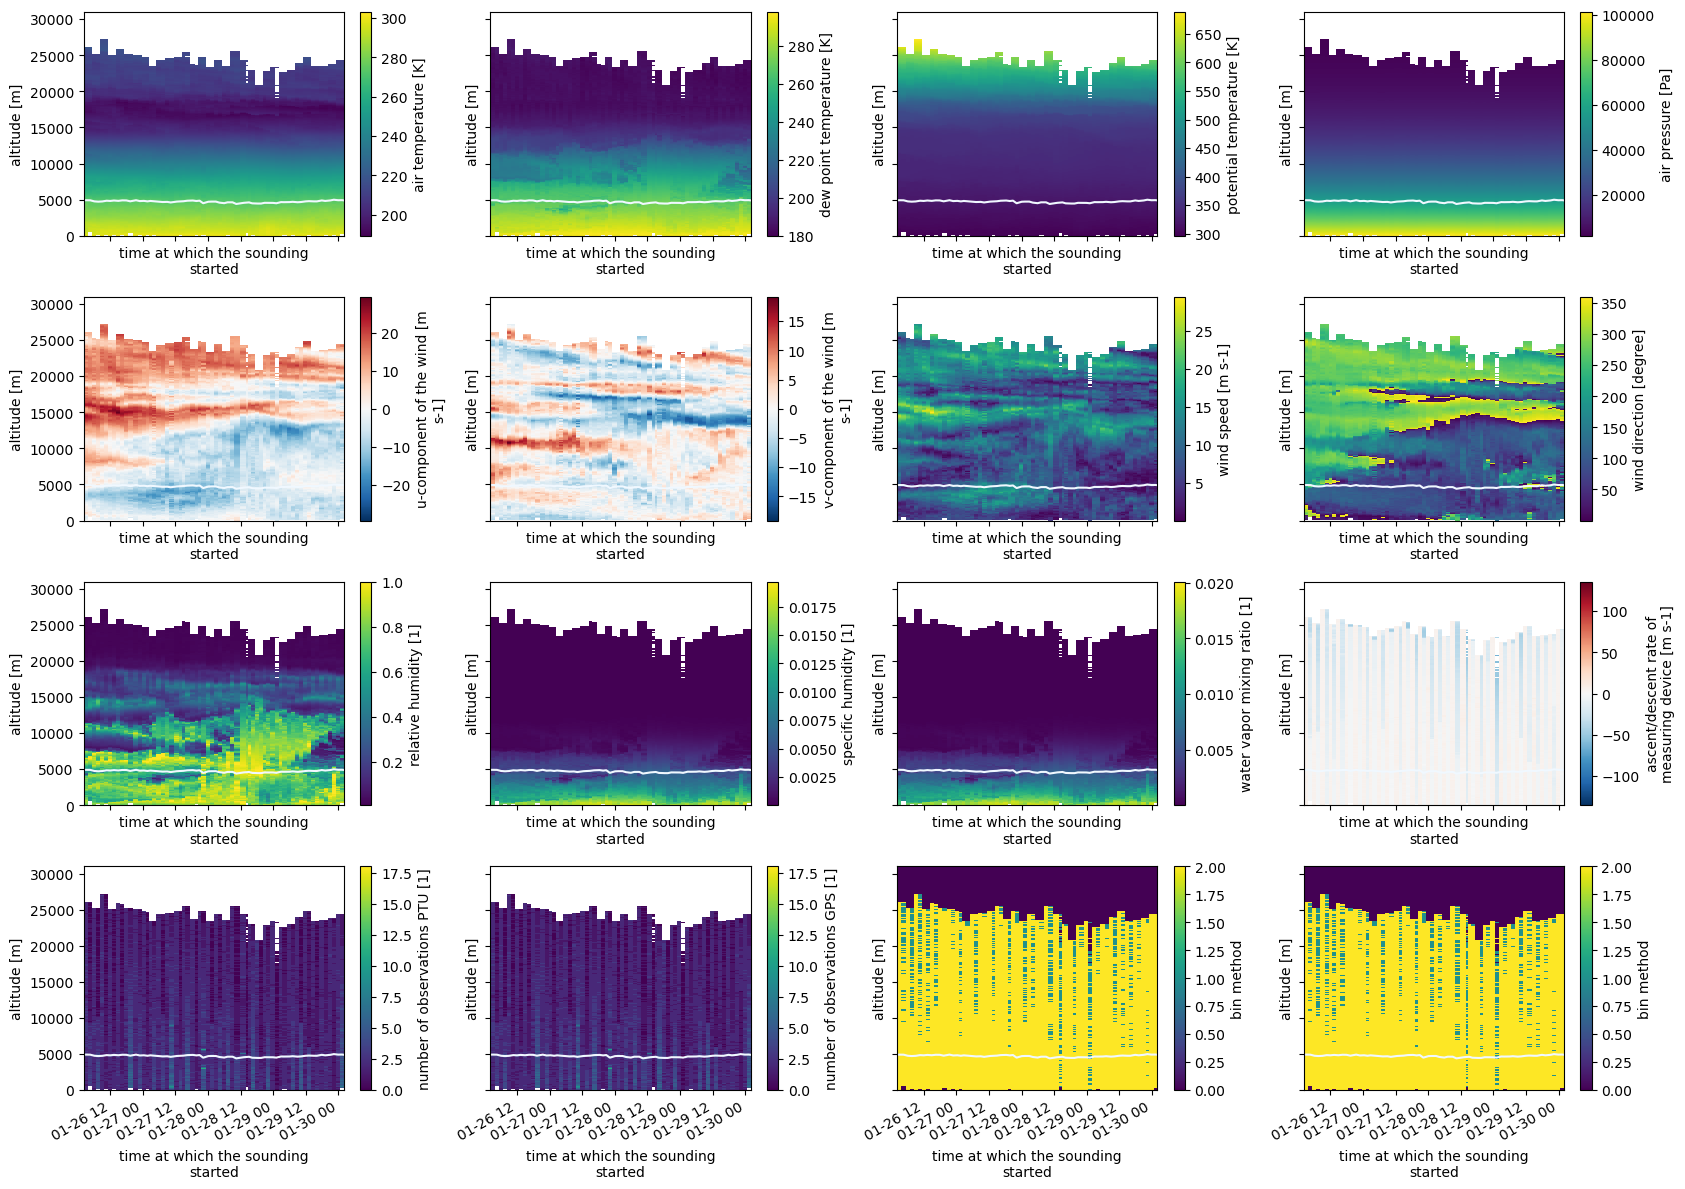
plt.savefig("ARC_Cont_obs.png", bbox_inches="tight")Plot level 2 radio soundings with freezing level (light blue line) for the first crossing of the ITCZ.
import xarray as xr
import fsspec
import numpy as np
import matplotlib.pyplot as plt

crossing_number = 1

radio_level2 = xr.open_dataset('arc_radiosondes_level2.nc')
crossing = radio_level2.groupby('section')

freezing_alts = radio_level2.isel(alt = np.abs(radio_level2.t_air - 273.15).argmin(axis = 1)).alt

vars_to_plot = ['t_air', 'dp', 'theta', 'p_air', 'u_air', 'v_air', 'wspd', 'wdir', 'rh', 'q', 'mr', 'dz', 'N_ptu', 'N_gps', 'm_ptu', 'm_gps']

fig, axs = plt.subplots(4,4,figsize=(17,12),sharex=True, sharey=True)

for ax, var in zip(fig.get_axes(), vars_to_plot):
    ax.plot(radio_level2.start_time, freezing_alts, c = 'aliceblue')
    crossing[crossing_number][var].plot(x = 'start_time', ax = ax)

plt.tight_layout()
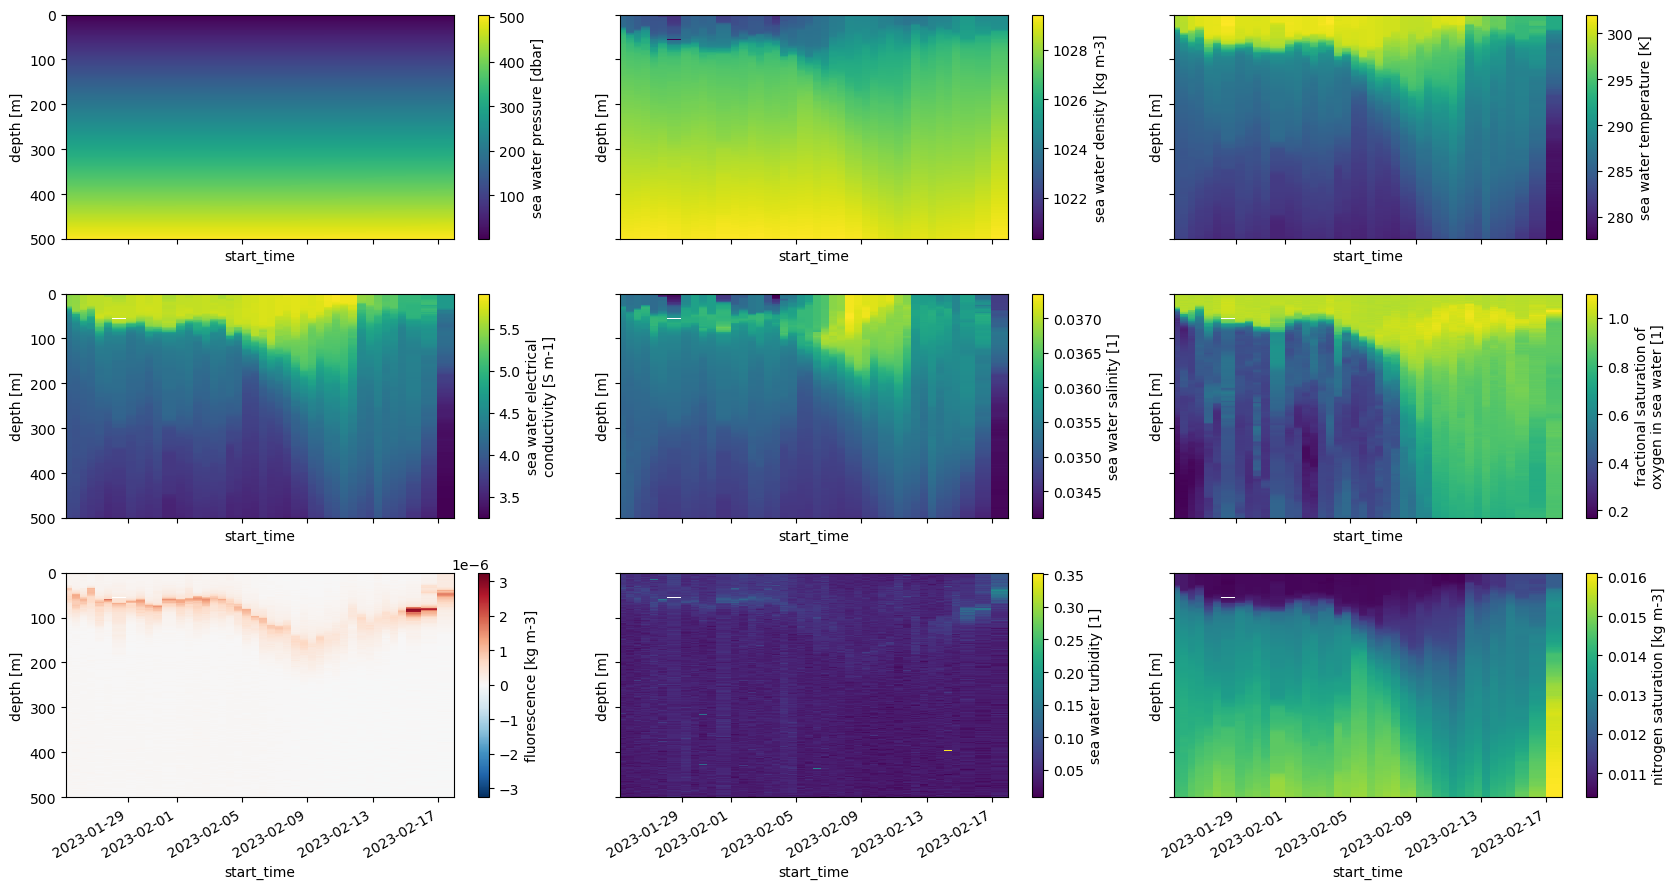
plt.savefig("ARC_RS_Level2_Crossing1.png", bbox_inches="tight")Plot CTD data up to 500 m depth. The two deeper CTDs up to 3793 m were done during section 2 and 4.
import xarray as xr
import fsspec
import numpy as np
import matplotlib.pyplot as plt

crossing_number = 1

ctd = xr.open_dataset('arc_ctd.nc')

vars_to_plot = ['p_sw', 'rho_sw', 't_sw', 'conductivity', 'salinity', 'oxygen', 'fluorescence', 'turbidity', 'nitrogen']

fig, axs = plt.subplots(4,4,figsize=(17,9),sharex=True, sharey=True)

for ax, var in zip(fig.get_axes(), vars_to_plot):
    ctd[var].sel(depth = slice(None,501)).plot(x = 'start_time', ax = ax)
    ax.set_ylim(500,0)

plt.tight_layout()
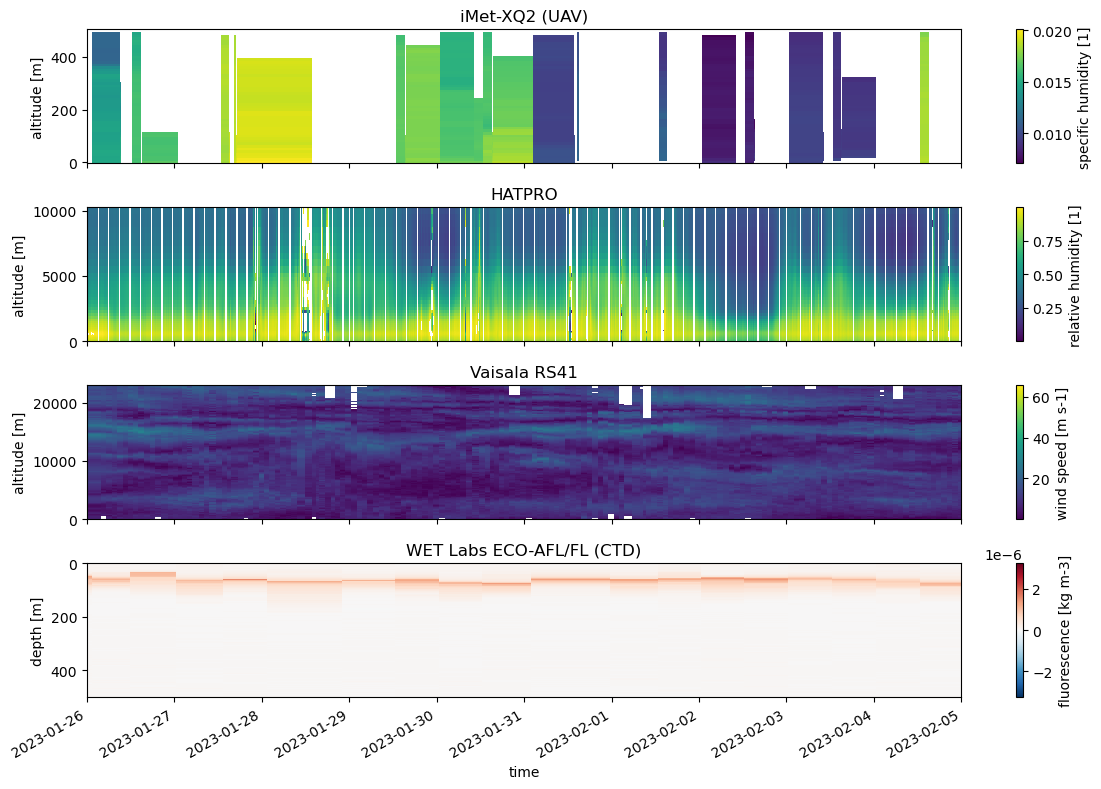
plt.savefig(f"plots/ARC_CTD_profiles.png", bbox_inches="tight")Plot data from instruments measuring profiles for the three ITCZ crossings.
import xarray as xr
import numpy as np
import matplotlib.pyplot as plt

radio = xr.open_dataset('arc_radiosondes_level2.nc')
hatpro = xr.open_dataset('arc_hatpro.nc')
uav = xr.open_dataset('arc_uav.nc')
ctd = xr.open_dataset('arc_ctd.nc')

fig, axs = plt.subplots(4, figsize=(12,8), sharex = True)

var_dict = {'uav': (uav, 'q', axs[0], 'start_time'), 'hatpro': (hatpro, 'rh', axs[1], 'time'), 'radio': (radio, 'wspd', axs[2], 'start_time'), 'ctd': (ctd, 'fluorescence', axs[3], 'start_time')}

for i in var_dict.keys():
    ds = var_dict[i][0]
    var = var_dict[i][1]
    a = var_dict[i][2]
    tname = var_dict[i][3]
    ds[var].plot(ax = a, x = tname)
    a.set_title(ds[var].attrs['instrument'])
axs[2].set_ylim(0,23000)
axs[3].set_ylim(500,0)

for ax in axs:
    ax.set_xlim(np.datetime64('2023-01-26'), np.datetime64('2023-02-05'))
    ax.set_xlabel('')
axs[3].set_xlabel('time')

plt.tight_layout()
plt.savefig("ARC_Profiles.png", bbox_inches="tight")