Screening the stones of Venice: Mapping social perceptions of cultural significance through graph-based semi-supervised classification
This is the Code and Dataset for the Paper 'Screening the stones of Venice: Mapping social perceptions of cultural significance through graph-based semi-supervised classification' published in ISPRS Journal of Photogrammetry and Remote Sensing showing the mapping of cultural significance in the city of Venice.
Bai, N., Nourian, P., Luo, R., Cheng, T., & Pereira Roders, A. (2023). Screening the stones of Venice: Mapping social perceptions of cultural significance through graph-based semi-supervised classification. ISPRS Journal of Photogrammetry and Remote Sensing, 203, 135-164. https://doi.org/10.1016/j.isprsjprs.2023.07.018
@article{Bai2023StoneVenice,
    title = {Screening the stones of Venice: Mapping social perceptions of cultural significance through graph-based semi-supervised classification},
    author = {Nan Bai and Pirouz Nourian and Renqian Luo and Tao Cheng and {Pereira Roders}, Ana},
    year = {2023},
    doi = {10.1016/j.isprsjprs.2023.07.018},
    volume = {203},
    pages = {135--164},
    journal = {ISPRS Journal of Photogrammetry and Remote Sensing},
    issn = {0924-2716},
    publisher = {Elsevier},
}
esda==2.5.0
libpysal==4.7.0
matplotlib==3.5.1
networkx==2.6.3
numpy==1.22.2
pandas==1.4.0
pingouin==0.5.3
scipy==1.10.0
torch==2.0.1
torch_geometric==2.3.1
This project provides a workflow to learn the post-level and spatial-level labels of cultural significance in Venice from a multi-modal dataset Heri-Graphs originally collected from social media platform Flickr. The workflow is illustrated as follows:
The main data being used is the numpy version of Heri-Graphs Venice, which is fed into PyTorch Geometric library as customised datasets. The exploration of dataset construction process can be found in Dataset_PyG.ipynb.
For both Venice (small version with 3k nodes) and Venice_XL (large version with 80k nodes) data, two versions are used, respectively the [data]_homo for graph-free and homogeneous-graph models (MLP, GCN, GAT, SAGE), and the [data]_links for heterogeneous-graph models (HeteroGNN and HGT). And for Venice_XL, and additional [data]_knn was pre-processed for efficiency.
Additional label category systems from Places365-CNNs and geographical information from Heri-Graphs are used as data.
To download the full processed data (4GB), use Google Drive and put everything in dataset/.
For the meaning of data and labels, as well as the structure of the partially labelled dataset, check the original GitHub Page https://github.com/zzbn12345/Heri_Graphs.
Seven models are trained and tested for this paper:
| Baseline | Name in Paper | Name in Repo | Type | Note |
|---|---|---|---|---|
| Random Dummy Classifier | RDC | Random | Graph-free | Generating random outputs based on the category distribution (prior) in the training set |
| Multi-Layer Perceptron | MLP | MLP | Graph-free | Combining visual and textual features |
| Graph Convolution Network | GCN | GCN | Homogeneous-graph | GCNII (Chen et al., 2020) |
| Graph Attention Network | GAT | GAT | Homogeneous-graph | GAT (Velickovic et al., 2017) |
| Graph Sample and Aggregate (GraphSAGE) | GSA | SAGE | Homogeneous-graph | GraphSAGE (Hamilton et al., 2017) |
| Heterogeneous GNN with GraphSAGE | HGSA | HeteroGNN | Heterogeneous-graph | HeteroGNN (Zhang et al., 2019) |
| Heterogeneous Graph Transformer | HGT | HGT | Heterogeneous-graph | HGT (Hu et al., 2020) |
All models are trained with [model].py for hyper-parameter search, re-trained and saved as checkpoints with [model].ipynb for further inference.
The checkpoints used in the paper are saved as model_storage/[model]/[model]_best_model/model.pth, except for GCN, which is saved as model_storage/[model]/[model]_knn_feature/model.pth.
To download the model checkpoints, use Google Drive and put everything in model_storage/.
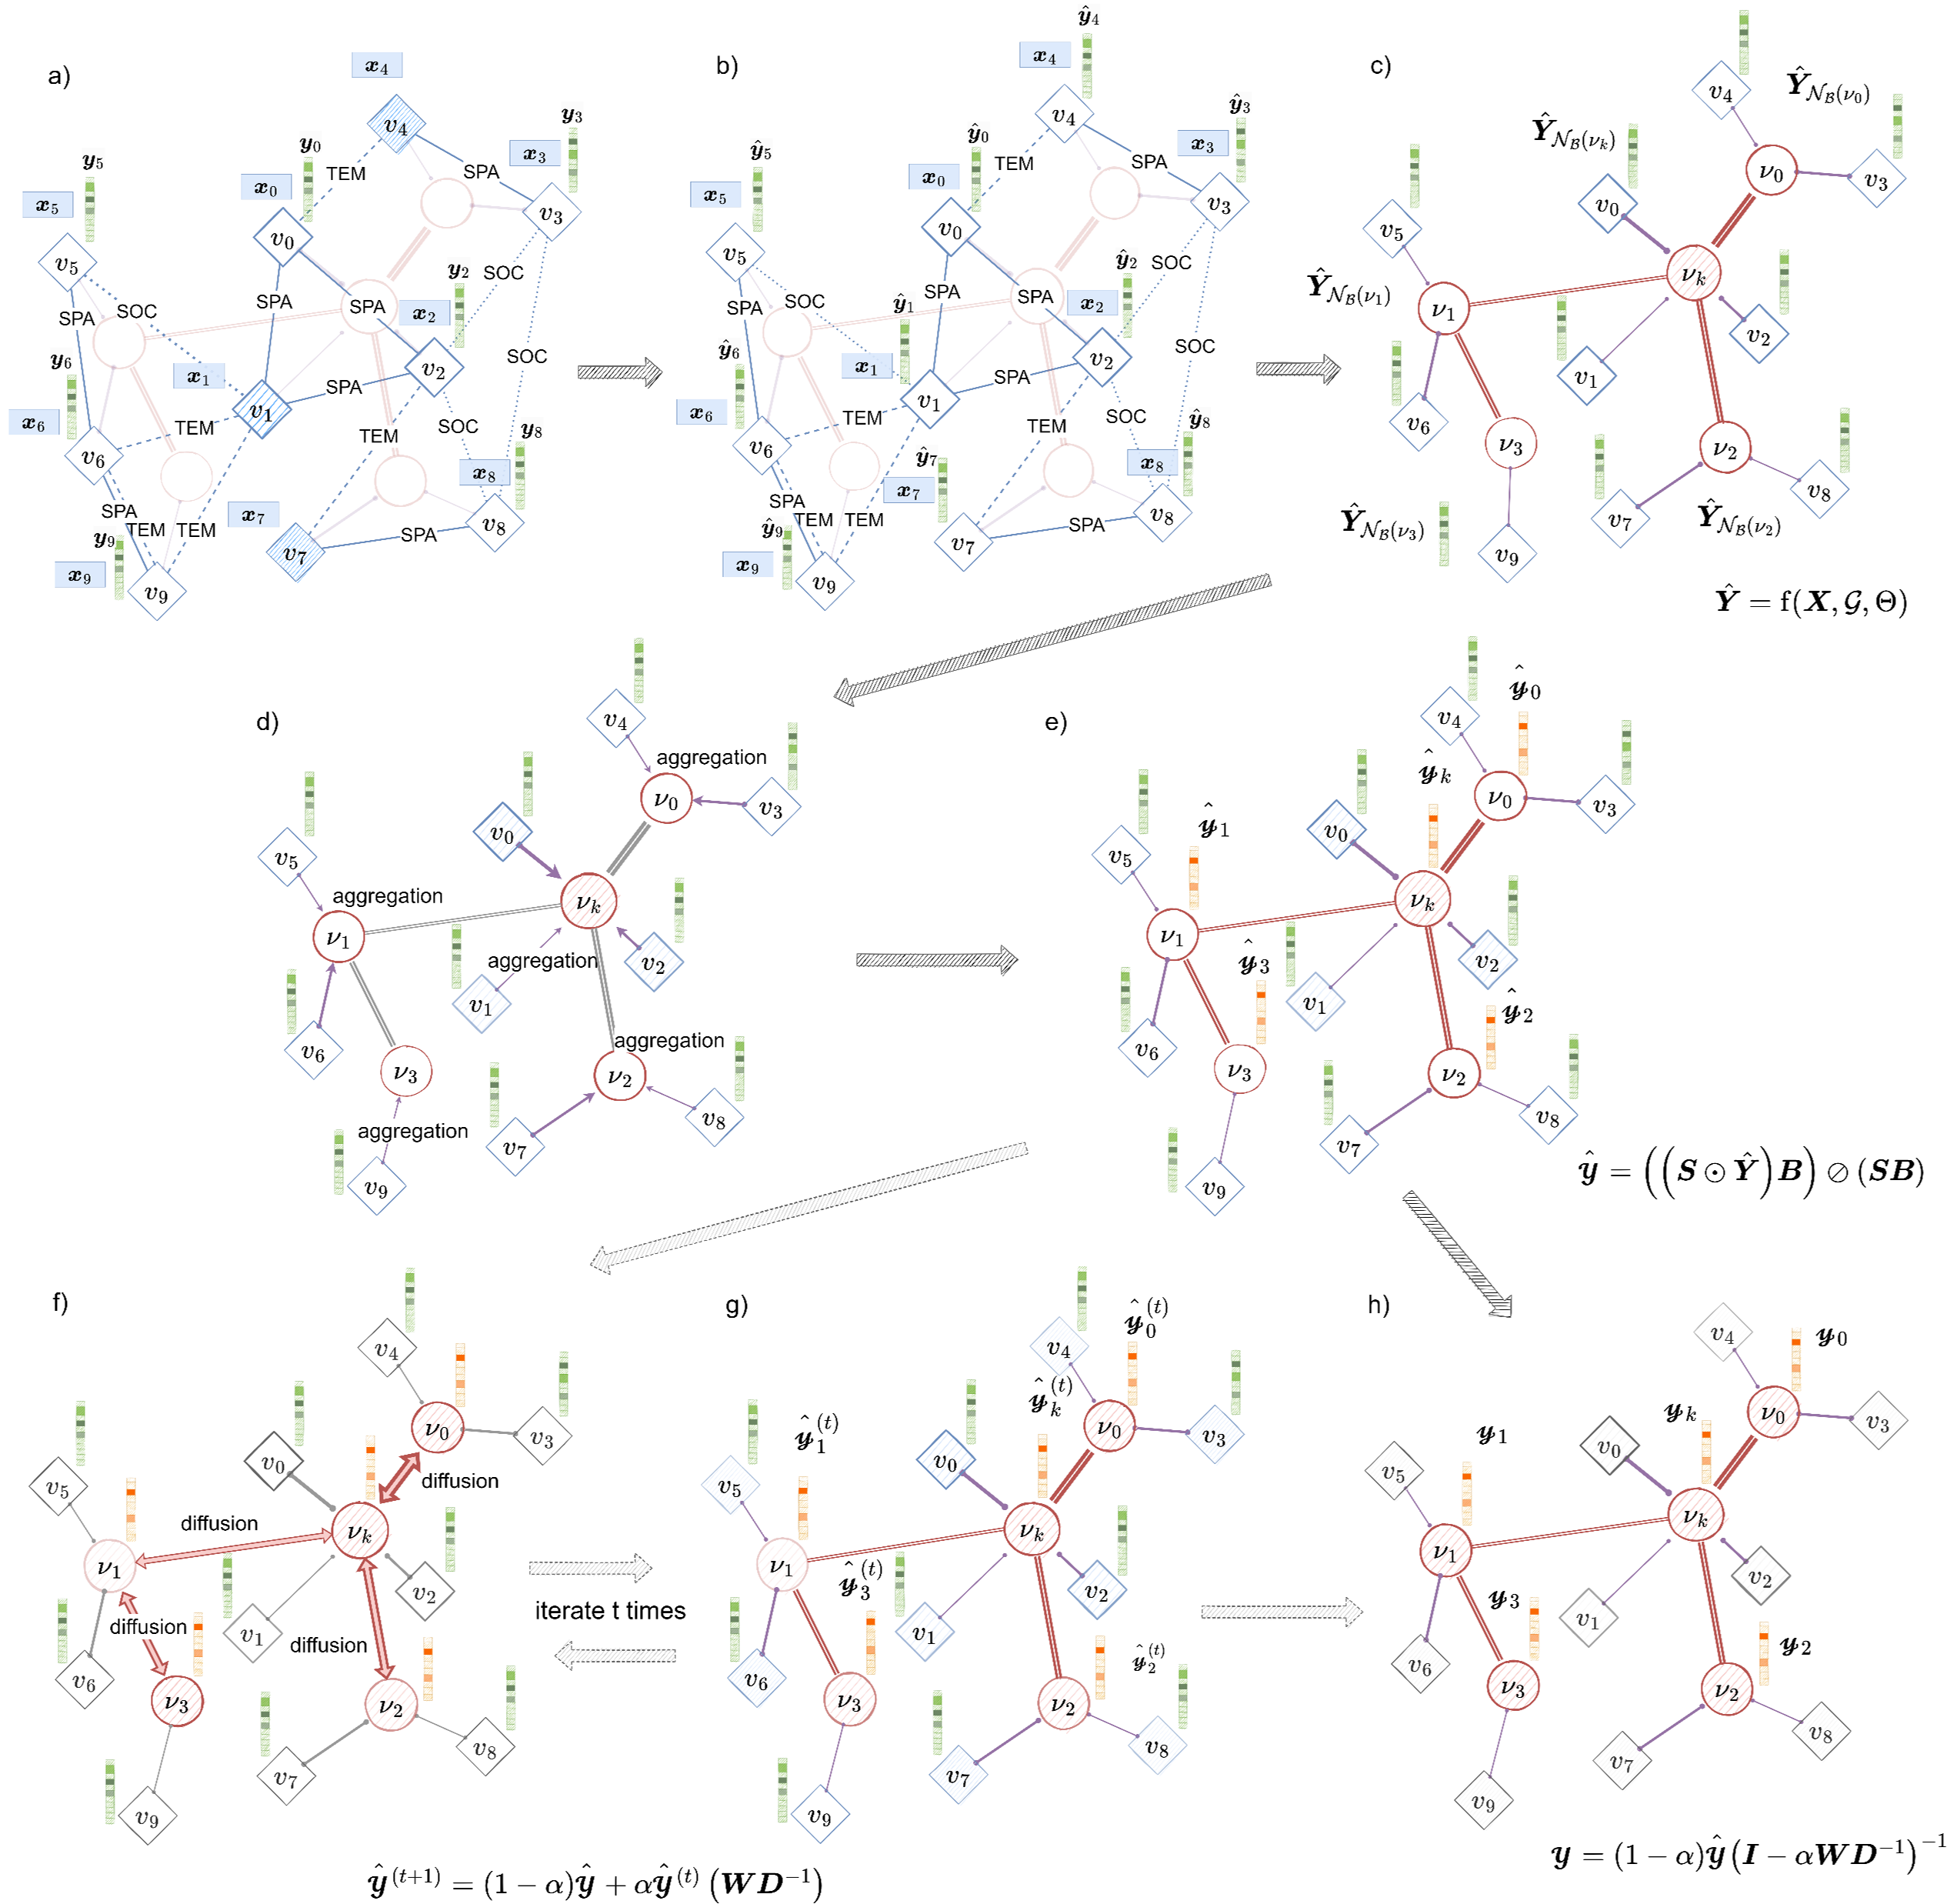
The most significant contribution of this paper is aggregating the post-level predictions to nearby spatial nodes based on the predictions of different models, and then diffusing the soft labels on spatial graphs.
The concept of the approach is visualized in the following diagram, which can be further checked in detail with our published paper:

The implementation of the aforementioned workflow is conducted respectively in Merging of Predicted Labels.ipynb and Merging of Predicted Labels-VEN_XL.ipynb.
The numerical results of model performance for all models are organized as various csv files, respectively saved in results/[model]/, including confusion matrices, per-class metrics, post-level predictions, general metrics on test and validation sets, as well as the training curves.
Alternative performance using kNN network are saved in results/[model]/kNN/, if available.
Ablation studies of masking visual and textual features during inference, as well as using Social, Spatial, and Temporal links individually during inference, are given in results/[model]/Ablation.
The direct inferences of trained model checkpoints on the Venice_XL data are available under results/[model]/Venice-XL/.
For GAT and SAGE, results of conducting GNNExplainer are saved under results/[model]/Explanation.
Following the workflow proposed in earlier section, the trained model checkpoints are first aggregated as an ensemble. The result of the ensemble for VEN and VEN_XL are respectively saved in results/General_Results_[data]/, including confusion matrices, per-class metrics, and post-level predictions.
After the spatial aggregation and diffusion, the spatial-level predictions are saved in the same folders results/General_Results_[data]/, together with the results from spatial statistics, such as global and local Moran's I under different parameters.
Training Curves.ipynb visualizes the training curves on training set and validation set.
Alternative Performance.ipynb visualizes the results of ablation studies.
Association.ipynb draws the confusion matrices and co-occurence matrices of OUV categories and HA categories.
Lexicon of Predictions.ipynb analyzes the results of explanations generated with GNNExplainer and saves the keyword lexicon as a network in results/Gephi map/ as Node and Link tables. And the network is visualized in Gephi with Explainable_Lexicon.gephi.
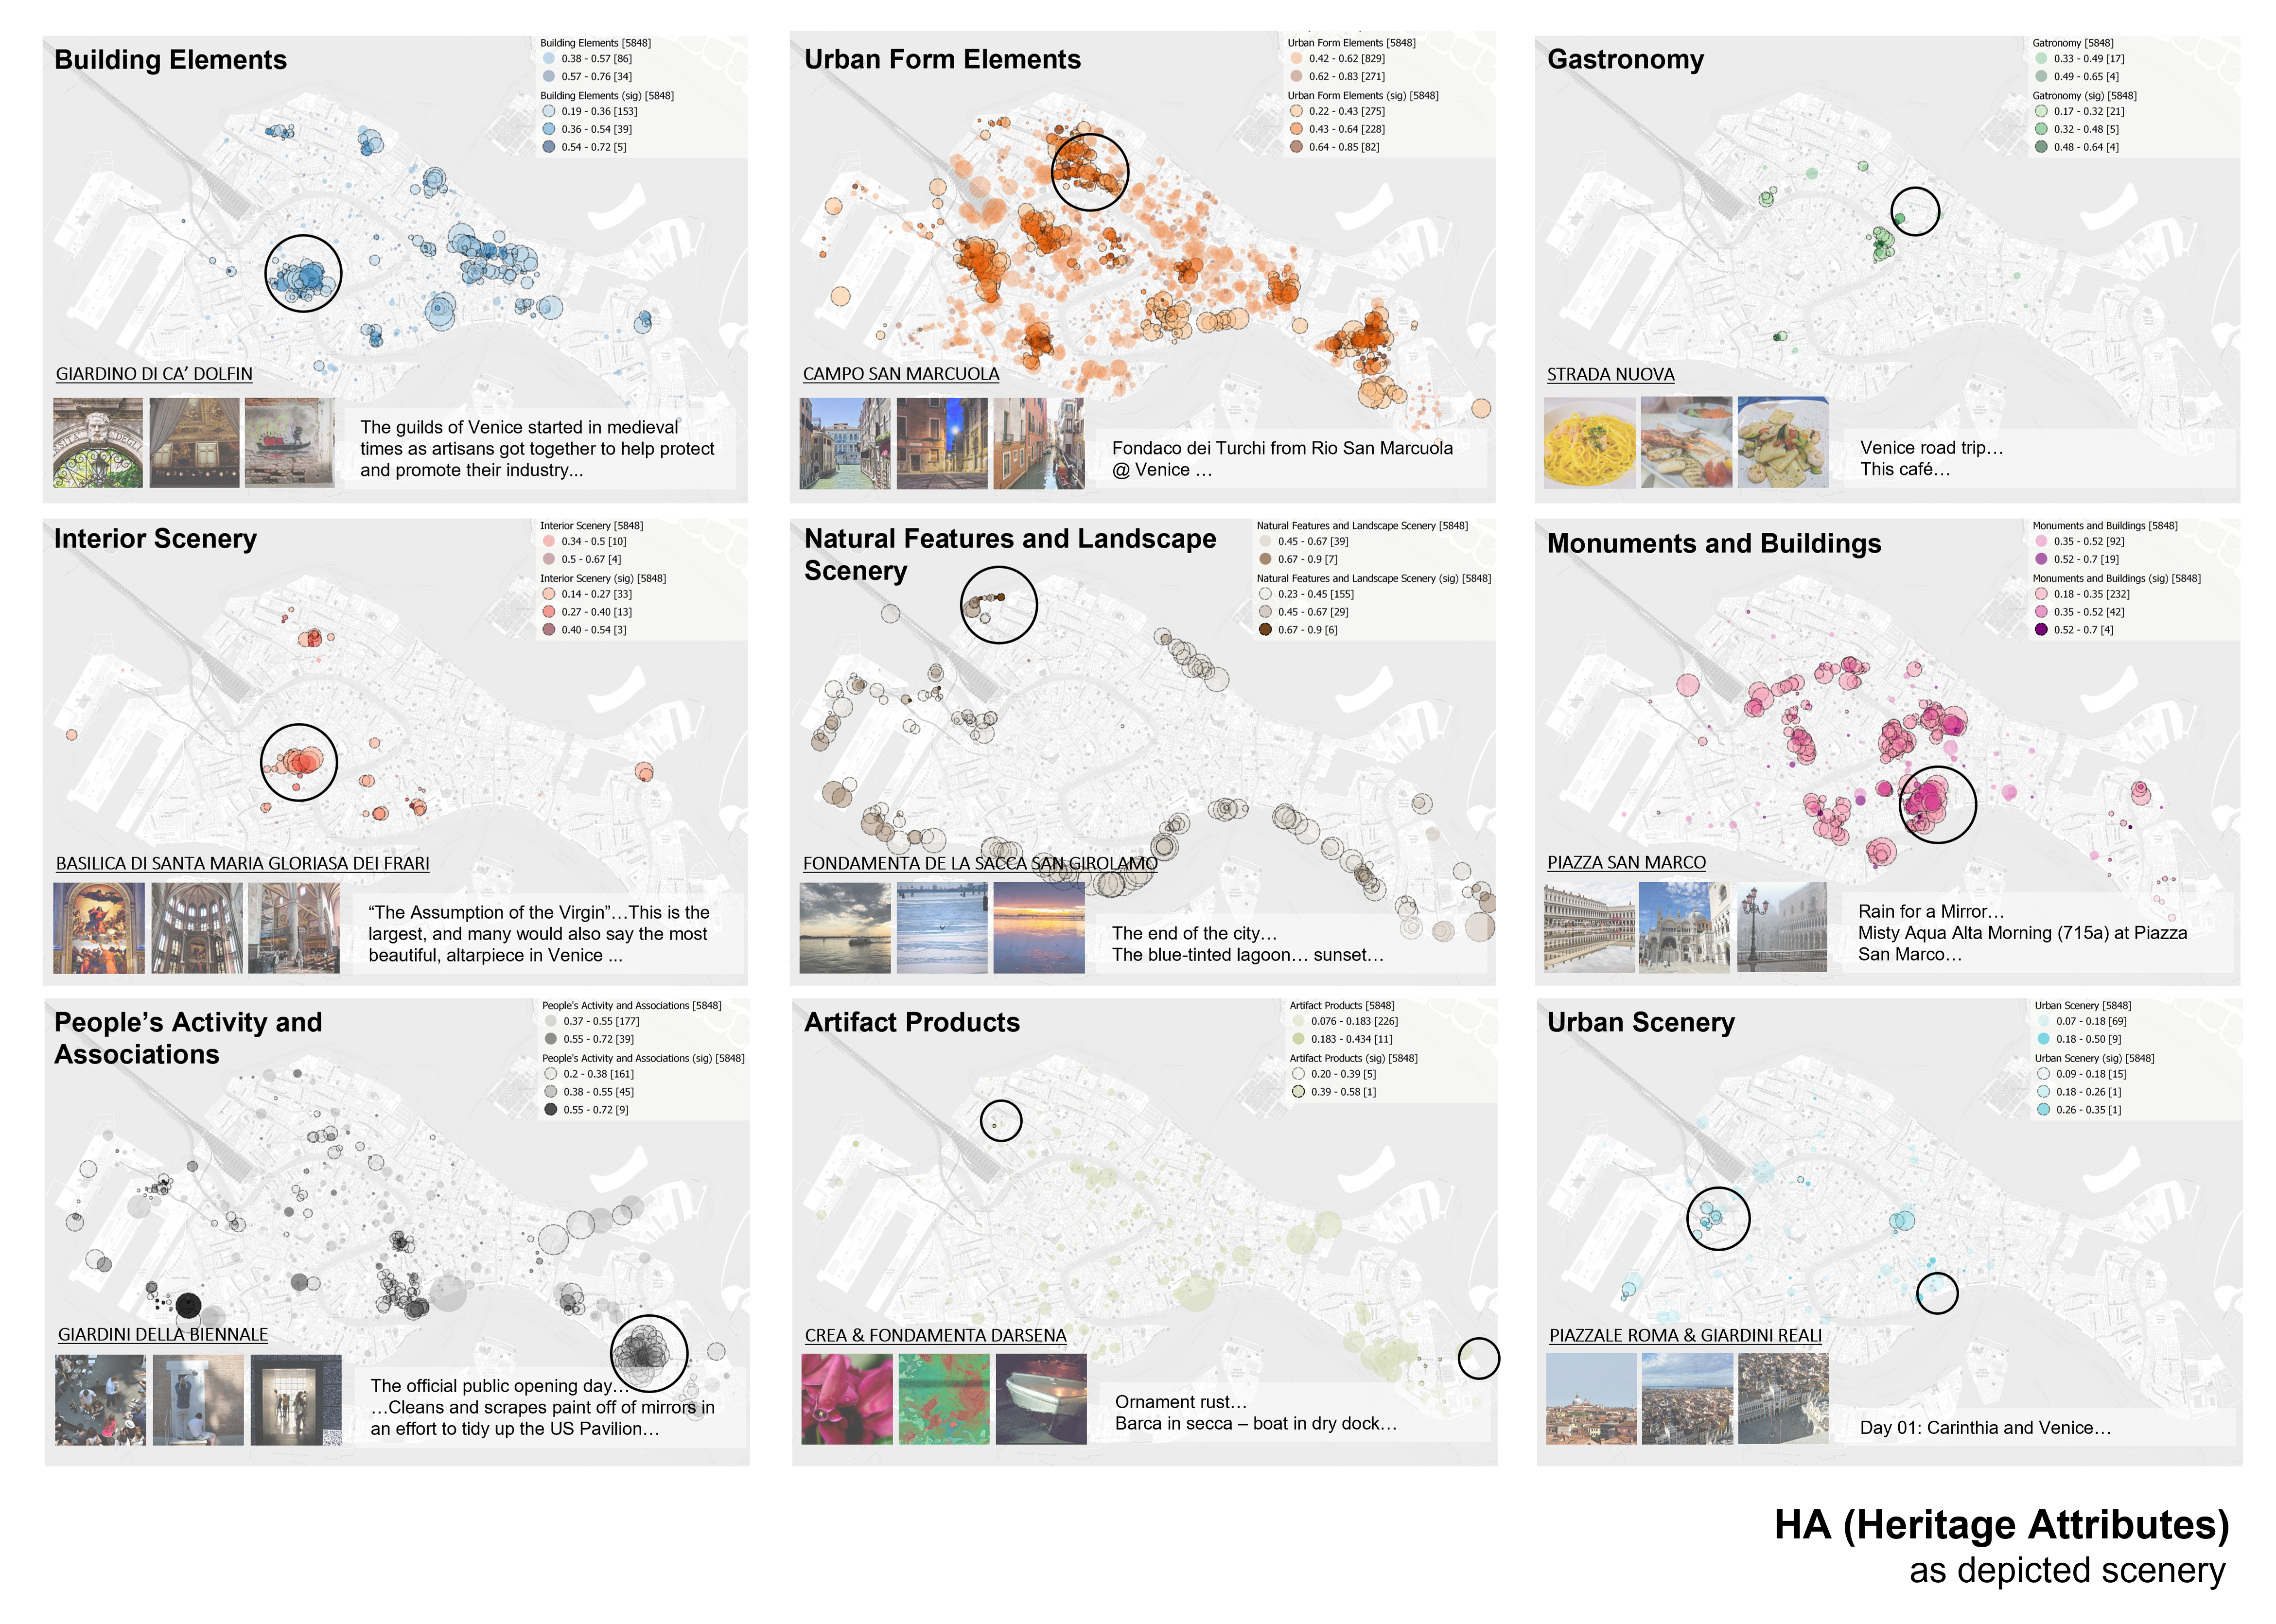
The final generated maps are saved as a QGIS project in results/QGIS map as Venezia.qgz. Note the associated data tables might need to be set up manually. These maps eventually will look like the following figure from the article:
This project applied the pretrained models of the following projects which are openly released on GitHub or published as python packages. Part of the codes are adpated from the original codes.
The workflows and datasets of this paper can be used under the Creative Common License (Attribution CC BY 4.0). Please give appropriate credit, such as providing a link to our paper or to this github repository. The copyright of all the downloaded and processed images belongs to the image owners.

