![]()
TractoR is an R-based platform for medical image processing, tractography and graph analysis. It is focussed on handling magnetic resonance images, but many of its core functions are applicable to any kind of image. The package is full-stack free and open-source, as R is itself free software, and it is easy to extend and build upon. Downloads are available from the project web site.
There are several sources of documentation available. For installation instructions, please see the INSTALL.md file. For general information on the package, its capabilities and conventions, please see the TractoR paper and/or the project home page. The latter is mirrored in the TractoR distribution, and can be found at share/doc/home.html. Standard R documentation is available, function by function, for the core tractor.base package and all first- and third-party dependency packages (which are included in the main download).
Please see below for information on
depending on your preference.
Users who are already familiar with R can easily incorporate the functionality of TractoR's R packages into their work. For example, an MRI image can be read from a compressed NIfTI-1 file, and its key metadata displayed with
t1 <- readImageFile("refT1.nii.gz")
t1
#      Image source : /usr/local/tractor/tests/data/session/tractor/structural/refT1
#  Image dimensions : 176 x 232 x 256 voxels
#  Voxel dimensions : 1 x 1 x 1 mm
# Coordinate origin : (91.89,94.98,106.1)
#   Additional tags : (none)
#        Sparseness : 10.03% (dense storage)
The t1 object can in many ways be treated as a standard R array, but it can also be manipulated and visualised with a set of specialised functions.
A parcellation in the same space can be loaded and overlaid in an interactive viewer using
parc <- readImageFile("parcellation.nii.gz")
showImagesInViewer(t1, parc)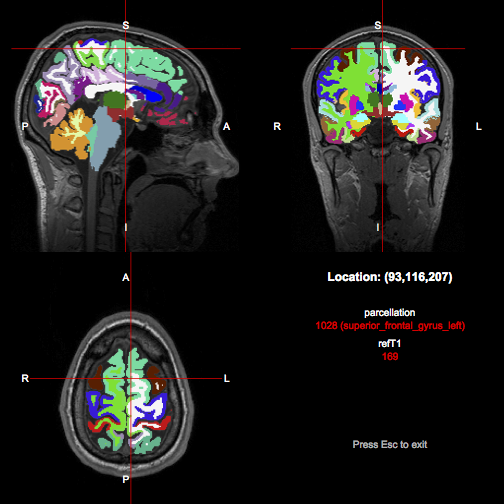
(with the tractor.session package loaded). Notice that both the numerical index and the name of the region currently under the crosshair is given in the info panel at the bottom right.
We can also apply image processing operations to the image and then visualise the result. In the example below we create a diamond-shaped 3D kernel, and then calculate and visualise the morphological gradient of the original image.
k <- shapeKernel(c(3,3,3), type="diamond")
grad <- t1$copy()$map(function(x) dilate(x,k) - erode(x,k))
showImagesInViewer(grad)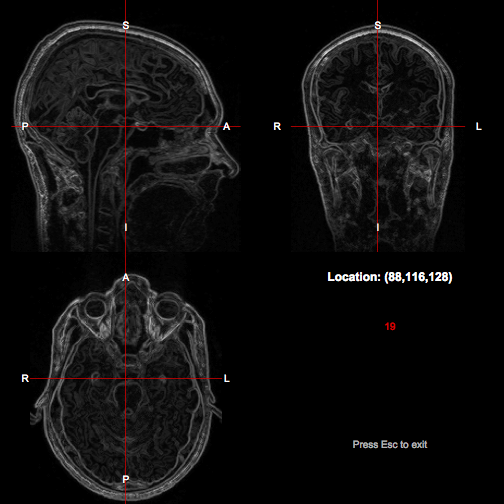
Notice the use of the map() method, which can be used to replace the data in an image with the result of applying a function, in this case an anonymous function constructed within the call.
Users who are not familiar with R, or wish to perform common tasks quickly, can instead use TractoR's direct command-line interface, which is simpler to use and requires less typing, but is still very flexible. A list of available commands can be obtained with
tractor list
# Starting TractoR environment...
# Experiment scripts found in /usr/local/tractor/share/experiments:
#  [1] age             apply           bedpost         binarise
#  [5] chfiletype      clone           components      compress
#  [9] console         dicomread       dicomsort       dicomtags
# [13] dirviz          dpreproc        extract         freesurf
# [17] gradcheck       gradread        gradrotate      graph-build
# [21] graph-decompose graph-extract   graph-props     graph-reweight
# [25] graph-viz       graph2csv       hnt-eval        hnt-interpret
# [29] hnt-ref         hnt-viz         imageinfo       imagestats
# [33] import          list            mean            mkroi
# [37] morph           parcellate      path            peek
# [41] platform        plotcorrections pnt-data        pnt-em
# [45] pnt-eval        pnt-interpret   pnt-prune       pnt-ref
# [49] pnt-train       pnt-viz         reg-apply       reg-check
# [53] reg-info        reg-linear      reg-nonlinear   reg-viz
# [57] reshape         slice           smooth          split
# [61] status          tensorfit       track           transform
# [65] trim            update          values          view
#
# Experiment completed with 0 warning(s) and 0 error(s)
Information on usage of a particular script, and the options that it supports, is available by using the '-o' command-line flag.
tractor -o imagestats
# OPTIONS for script /usr/local/tractor/share/experiments/imagestats.R (*
# required)
#    Scope: nonzero [zero,positive,negative,all]
#    MaskFile: NULL
#    ThresholdLevel: 0
# ARGUMENTS: image file
#
# DESCRIPTION:
# Print various statistics of the specified image, optionally limiting the
# calculations by voxel value or by mask. The 5% trimmed range is obtained by
# discarding the 5% largest and smallest values and taking the range of the
# remainder, thereby giving an indication of the influence of extreme values.
# This script may currently only be applied to 3D images.
Running a particular script is a matter of typing tractor, followed by the script's name and any arguments or named options required. For example,
tractor graph-viz data/graph/diffusion ShowBrain:true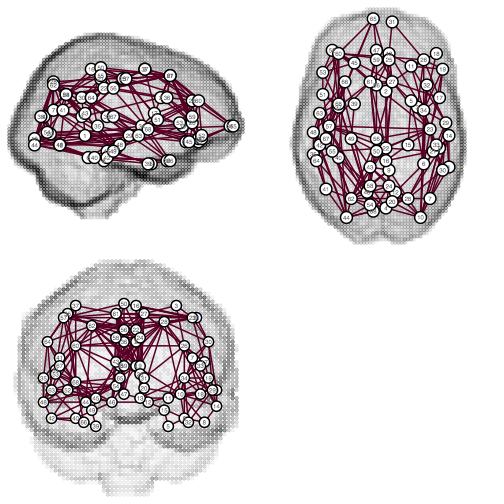
The examples in the previous section can be replicated in this way by using the imageinfo and view scripts. Try it! Further information on the tractor command is available from its man page, by typing man tractor.