


Social Network Analysis (SNA) & Graph ML to do Part Segmentation of Point Cloud Data using Community Detection

This repository contains the code (and a sample of data) of a research project at the intersection of SNA, Graph ML, and the built environment. This research encompasses several steps:
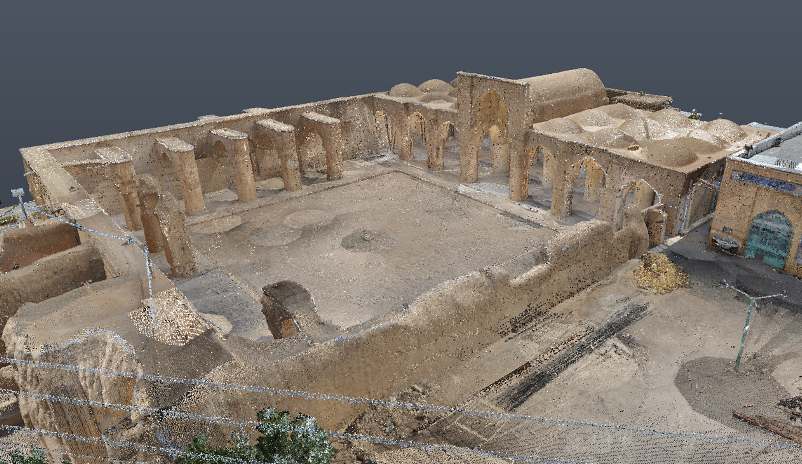
- Importing point cloud data into python.
- Converting point cloud data to the corresponding Adjacency matrix.
- Creating an undirected Graph network (using igraph).
- Analyze the created Graph using different metrics (e.g., centrality measures).
- Conduct community detection (CD) on the graph using different methods (i.e., Label Propagation, Eigenvector, Infomap, and Components).
- Visualize and compare the results (of different CD methods)
.
├── data
│   ├── 101000 points
│   ├── 164000 points
│   ├── 244000 points
│   ├── 61700 points
│   ├── 68400 points
│   └── 99000 points
├── images
│   └── logos
├── outputs
│   ├── Graph Visualization
│   └── Stats
└── utils

13 directories
Pointcloud data is a csv file with "space" separator, containg six/6 features (See Table [1]).
Table [1] : A sample of our input CSV data

If you have any questions, feel free to contact TekBoArt @tekboart.
Shield:
- Refer to the file
LICENSEfor more information regarding the license of this repository.
This work is licensed under a Creative Commons Attribution-NonCommercial-ShareAlike 4.0 International License.
