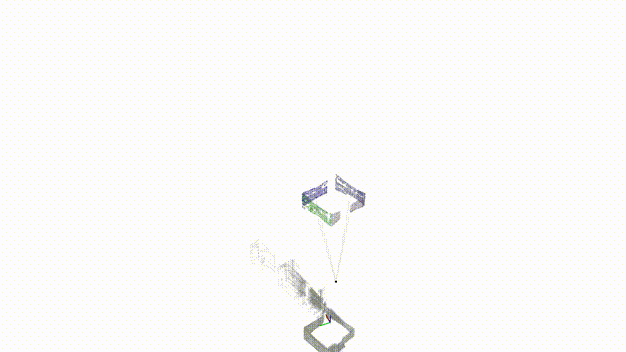
LiDAR Situational Graphs (S-Graphs) is a ROS2 package for generating in real-time four-layered hierarchical factor graphs representing a scene graph using 3D LiDAR which includes Keyframes registring the robot poses, Walls which map wall planes, Rooms Layer constraining the wall planes using 4 wall-room or 2 wall-room factors, Floors constraining the rooms within a given floor level. It also supports several graph constraints, such as GPS, IMU acceleration (gravity vector), IMU orientation (magnetic sensor). We have tested this package mostly with Velodyne (VLP16) sensors in structured indoor environments. This work is a fork of hdl_graph_slam which as previously in ROS1.
- 📖 Published Papers
- ⚙️ Installation
- 🚀 Examples on Datasets
- 🛠️ Run S_Graphs On Your Data
- 🤖 ROS Related
- 🧪 Unit Tests
S-Graphs+: Real-time Localization and Mapping leveraging Hierarchical Representations
@ARTICLE{10168233,
 author={Bavle, Hriday and Sanchez-Lopez, Jose Luis and Shaheer, Muhammad and Civera, Javier and Voos, Holger},
 journal={IEEE Robotics and Automation Letters},
 title={S-Graphs+: Real-Time Localization and Mapping Leveraging Hierarchical Representations},
 year={2023},
 volume={8},
 number={8},
 pages={4927-4934},
 doi={10.1109/LRA.2023.3290512}}
Situational Graphs for Robot Navigation in Structured Indoor Environments
  @ARTICLE{9826367,
    author={Bavle, Hriday and Sanchez-Lopez, Jose Luis and Shaheer, Muhammad and Civera, Javier and Voos, Holger},
    journal={IEEE Robotics and Automation Letters},
    title={Situational Graphs for Robot Navigation in Structured Indoor Environments},
    year={2022},
    volume={7},
    number={4},
    pages={9107-9114},
    doi={10.1109/LRA.2022.3189785}}
Note
S-Graphs+ was only tested on Ubuntu 20.04, ROS2 Foxy, Humble Distros. We strongly recommend using cyclone_dds instead of the default fastdds.
Important
Before proceeding, make sure you have rosdep installed. You can install it using sudo apt-get install python3-rosdep
In addition, ssh keys are needed to be configured on you GitHub account. If you haven't
yet configured ssh keys, follow this tutorial
- Update Rosdep:
rosdep init && rosdep update --include-eol-distros- Create a ROS2 workspace for S-Graphs
mkdir -p $HOME/workspaces && cd $HOME/workspaces- Clone the S-Graphs repository into the created workspace
git clone git@github.com:snt-arg/lidar_situational_graphs.git -b feature/ros2 s_graphs Important
If you have Nvidia GPU please install CUDA from this link. This code has only been tested with CUDA 11.8. If you dont have CUDA S-Graphs will use CPU only.
- Install required dependencies. Change $ROS_DISTRO to your ros2 version.
cd s_graphs && source /opt/ros/$ROS_DISTRO/setup.sh && ./setup.shNote
If you want to compile with debug traces (from backward_cpp) run:
colcon build --symlink-install --cmake-args -DCMAKE_BUILD_TYPE=RelWithDebInfo[!NOTE] This is an optional older version of room segmentation algorithm which requires ROS1 noetic. There is no hard dependecy on this package so you can easily ignore this step.
source /opt/ros/foxy/setup.bash && sudo apt install ros-foxy-ros1-bridge[!IMPORTANT] Before following the instructions from below, ensure that you are in a fresh terminal, without ROS2 sourced.
- Create a ROS1 workspace for S-Graphs
mkdir -p $HOME/workspaces/s_graphs_ros1_ws/src && cd $HOME/workspaces/s_graphs_ros1_ws/src && source /opt/ros/noetic/setup.bash- Clone the S-Graphs repository into the created workspace
git clone git@github.com:snt-arg/lidar_situational_graphs.git -b feature/ros2 s_graphs- Install required dependencies using
vcstool
cd s_graphs && vcs import --recursive ../ < .rosinstall_ros1- Install required ROS packages
cd ../../ && rosdep install --from-paths src --ignore-src -y -r- Install
pcl_ros
sudo apt install ros-noetic-pcl-ros- Build workspace
[!IMPORTANT] Make sure s_graphs_ros1_ws is built in Release otherwise the room extraction won't work properly.
catkin config --cmake-args -DCMAKE_BUILD_TYPE=Release && catkin build- Create a ROS2 workspace for S-Graphs
mkdir -p $HOME/workspaces && cd $HOME/workspaces- Change directory to where Dockerfile is located in
s_graphs
git clone git@github.com:snt-arg/lidar_situational_graphs.git -b feature/ros2 s_graphs && cd $HOME/workspaces/s_graphs/docker/foxy_noetic- Build image
docker build -t sntarg/s_graphs .Note
There are two docker files, one for foxy and another for humble. The above commands build the foxy image, you use the same commands to build the humble image if needed.
Warning
For execution of the experiments we use mprocs, which makes the process of launching different processes easier.
Important
Download real dataset using this link and store it in the folder ~/Downloads/real, the below mprocs script will not work otherwise.
cd $HOME/workspaces/s_graphs && mprocs --config .real_mprocs.yamlImportant
Download virtual dataset using this link and store it in the folder ~/Downloads/virtual, the below mprocs script will not work otherwise.
cd $HOME/workspaces/s_graphs && mprocs --config .virtual_mprocs.yamlNote
This tutorial assumes that you have followed the instructions to setup docker in section 🐳 Docker
- Create a container for the s_graphs image.
docker run -dit --volume=/tmp/.X11-unix:/tmp/.X11-unix:rw --network=host -e DISPLAY=$DISPLAY --name s_graphs_container sntarg/s_graphs-
Download the dataset you desire from above to your local machine.
-
Move the rosbag inside docker container
docker cp ~/Downloads/real s_graphs_container:/root/Downloads/real # For real dataset
# OR
docker cp ~/Downloads/virtual s_graphs_container:/root/Downloads/virtual # For virtual dataset- Execute the container
docker exec -ti s_graphs_container bashImportant
If rviz2 doesnt open inside the docker, do xhost + in a terminal of your pc and then relaunch the mprocs command inside docker.
- Run mprocs
mprocs_real # To run on a real robot or a real dataset
# OR
mprocs_virtual # To run on a simulation or virtual dataset
Note
Press reset on rviz2 once in a while when running S-Graphs to avoid freezing effect caused by rviz2 on foxy.
- Define the transformation between your sensors (LIDAR, IMU, GPS) and base_link of your system using static_transform_publisher (see line, s_graphs_launch.py). All the sensor data will be transformed into the common
base_linkframe, and then fed to the SLAM algorithm. Note:base_linkframe in virtual dataset is set tobase_footprintand in real dataset is set tobody. You can set theframes,topicsfor your dataset easily during the launch execution as follows:
ros2 launch lidar_situational_graphs s_graphs_launch.py compute_odom:=true lidar_topic:=/rs_lidar/points- If you have an odometry source convert it to base ENU frame, then set the arg
compute_odomtofalseins_graphs_ros2_launch.pyand then remap odom topic in s_graphs_node like
ros2 launch lidar_situational_graphs s_graphs_launch.py compute_odom:=false lidar_topic:=/rs_lidar/points odom_topic:=/odomNote
If you want to visualize the tfs correctly from your odom source, you MUST provide a tf from the odom to base_link frame.
| Topic name | Message Type | Description |
|---|---|---|
/odom |
nav_msgs/Odometry | The odometry from the robot. |
/filtered_points |
sensor_msgs/PointCloud2 | The filtered data from the LiDAR sensor. |
| Topic name | Message Type | Description |
|---|---|---|
/voxblox_skeletonizer/sparse_graph |
visualization_msgs/MarkerArray | Represents the free space where the robot can go to. Also known as free-space clusters. |
/s_graphs/map_planes |
s_graphs/PlanesData | Planes seen by the current robot keyframe. |
| Topic name | Message Type | Description |
|---|---|---|
/s_graphs/all_map_planes |
visualization_msgs/MarkerArray | All the planes that have been seen by the robot. |
| Topic name | Message Type | Description |
|---|---|---|
/s_graphs/markers |
visualization_msgs/MarkerArray | These markers represent the different s_graphs layers. |
/s_graphs/odom2map |
geometry_msgs/TransformStamped | The estimated drift of the robot within its map frame (world). |
/s_graphs/odom_pose_corrected |
geometry_msgs/PoseStamped | The optimized/drift-free pose of the robot once odom2map is applied. |
/s_graphs/odom_path_corrected |
nav_msgs/Path | The optimized/drift-free pose path of the robot once the odom2map is applied. |
/s_graphs/map_points |
sensor_msgs/PointCloud2 | The projected 3D points using the optimized robot pose. |
/s_graphs/map_planes |
s_graphs/PlanesData | Planes seen by the current robot keyframe. |
/s_graphs/all_map_planes |
s_graphs/PlanesData | All the planes that have been seen by the robot. |
| Topic name | Message Type | Description |
|---|---|---|
/room_segmentation/room_data |
s_graphs/RoomsData | Contains all the necessary information about the rooms on a given floor. |
| Topic name | Message Type | Description |
|---|---|---|
/floor_plan/floor_data |
s_graphs/RoomData | Contains all the necessary information about each floor. |
| Topic name | Message Type | Description |
|---|---|---|
/s_graphs/dump |
s_graphs/DumpGraph | Save all the internal data (point clouds, floor coeffs, odoms, and pose graph) to a directory. |
| Topic name | Message Type | Description |
|---|---|---|
/s_graphs/save_map |
s_graphs/SaveMap | Save the generated 3D map as a PCD file. |
All the configurable parameters are listed in config folder as ros params.
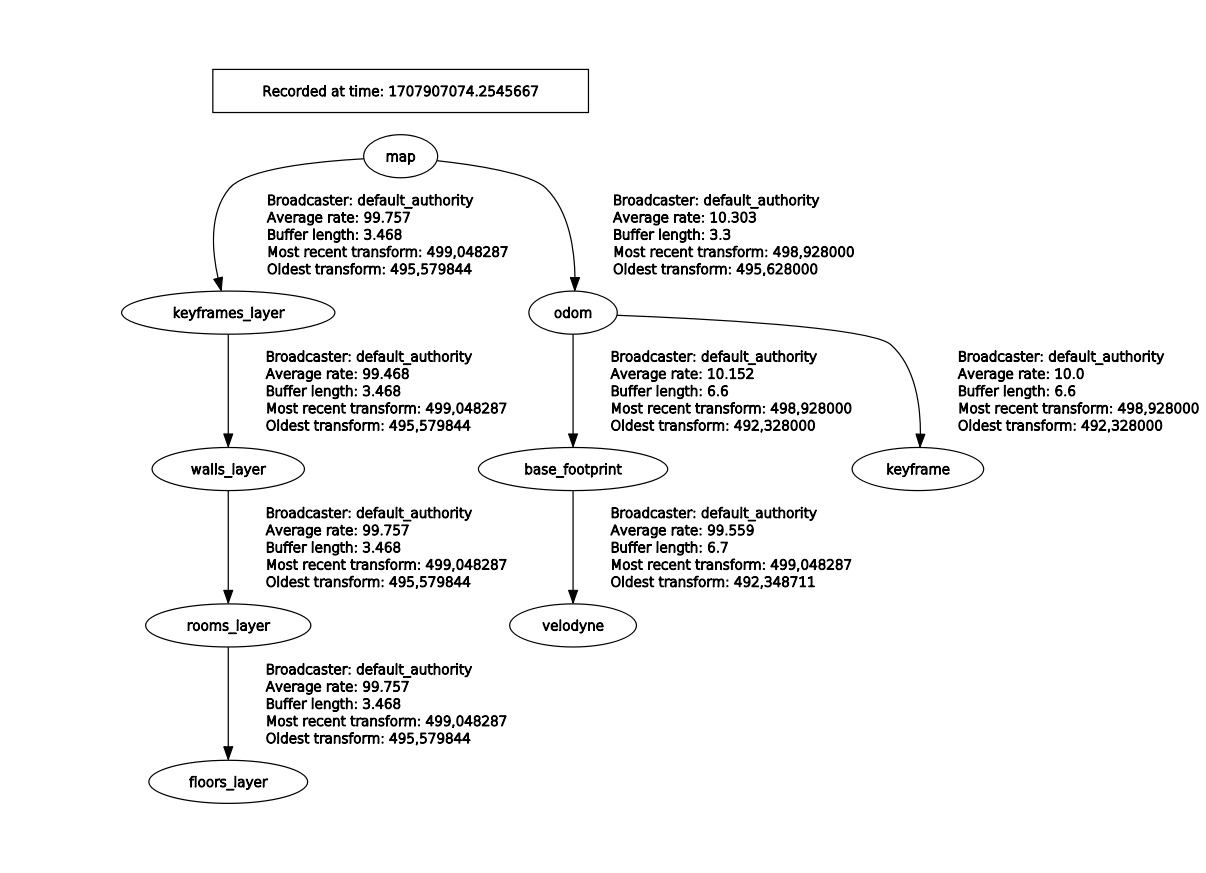
-
map2odom: The transform published between the map frame and the odom frame after the corrections have been applied. -
The entire
tf_treefor the virtual experiment can be seen in the figure below.
Some unit tests are available. In case you want to add additional tests, run the following command:
colcon test --packages-select s_graphs --event-handler=console_direct+