Data from MoH, (i.e for Mar 30 2020): https://www.health.govt.nz/our-work/diseases-and-conditions/covid-19-novel-coronavirus/covid-19-current-situation/covid-19-current-cases/covid-19-current-cases-details
Note: built in Linux but should run on MacOS and Windows via WSL. It does require a few dependencies:
- minconda (if you want to use conda env)
- jq
- csvkit
- xlsx2csv
I might actually design this to work in a docker image. All the above packages are in the debian repos so it would be pretty straight forward.
- conda
conda create --name excel2csv python=3.7conda activate excel2csv
- install xlsx2csv and csvkit (for
csvjson):easy_install xlsx2csvpip install csvkit
- download the file from the MoH website, using a bash script:
sh ./covid_data_scrape.sh
- string it all together to get a nicely formatted json:
sh ./xlsx2json.sh
- there should now be two
jsonfiles indata/, one of confirmed cases and one of probable cases. - plotting/dashboard... [TO DO]
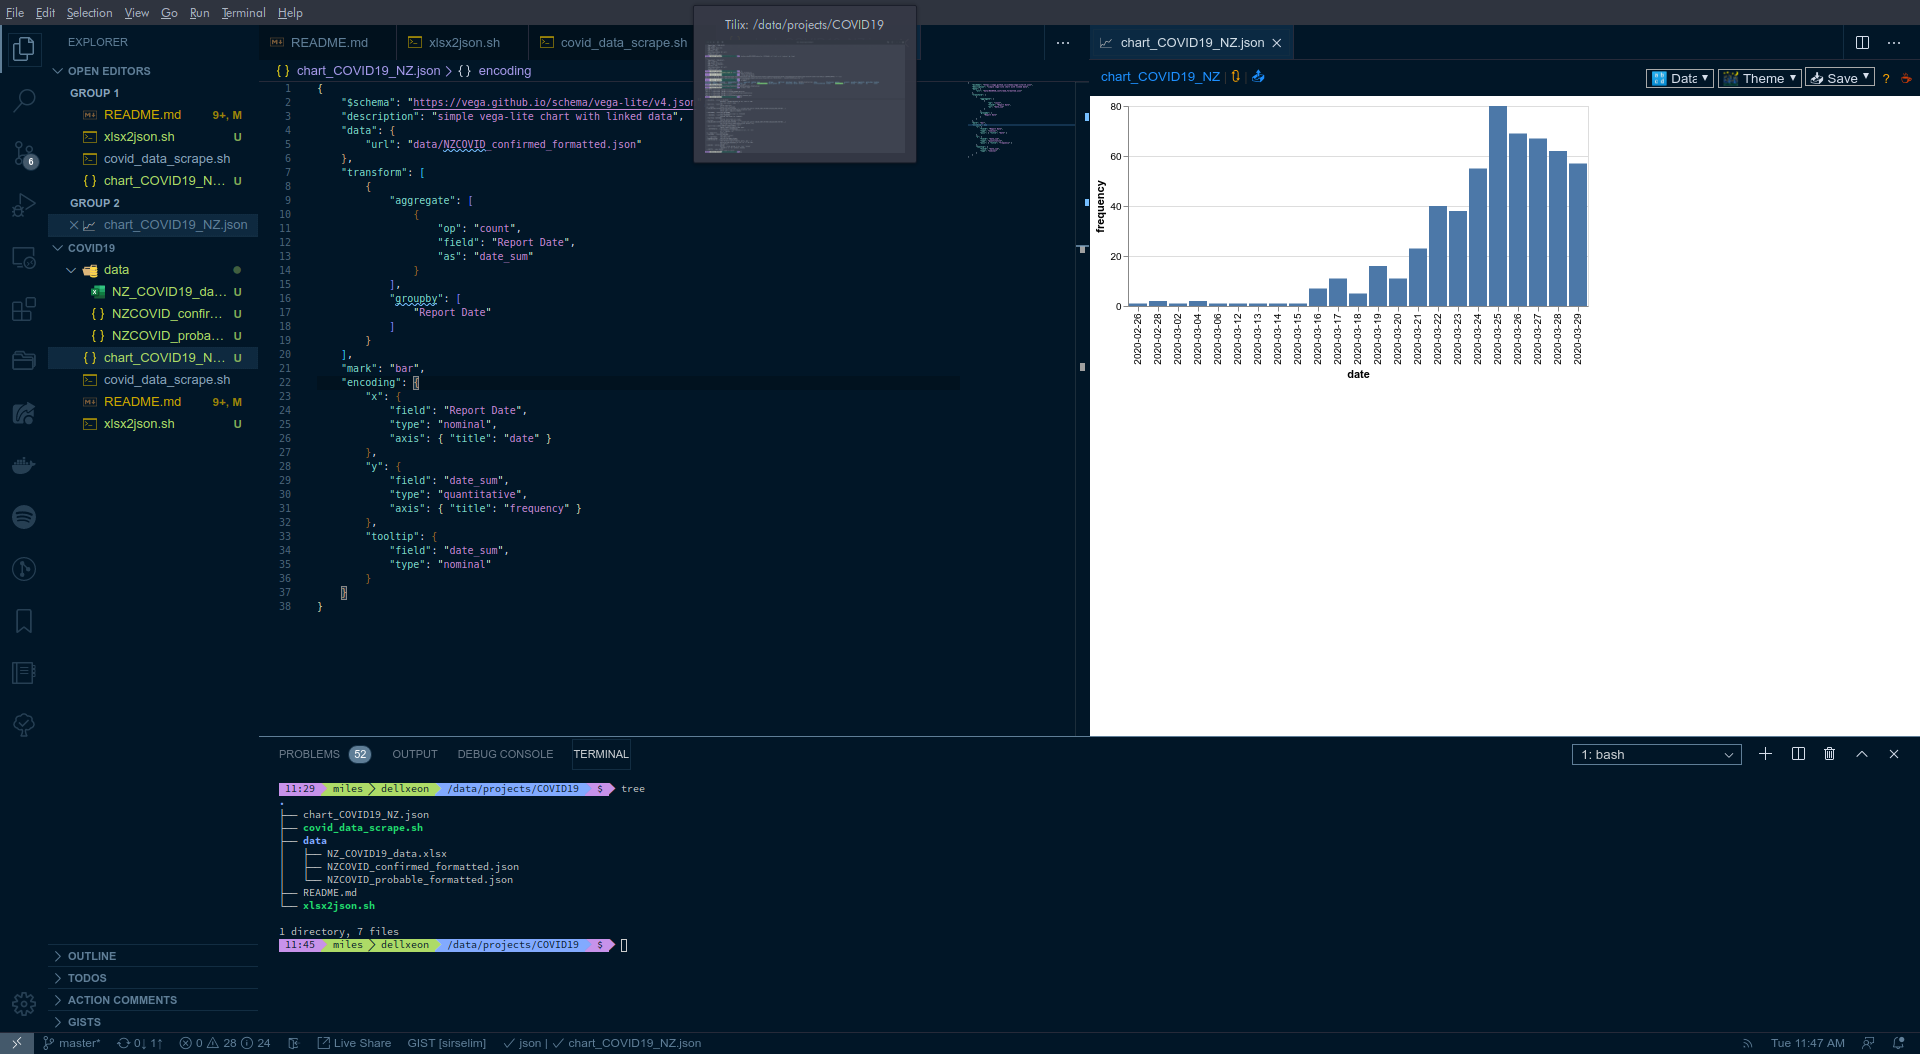
I'm using the Vega Viewer extension in VSCode to quickly display the vega-lite charts/plots. Once you have a vega/vega-lite scheme (see chart_COVID19_NZ.json as an example) you can use the hot-key combo Ctrl + Alt + v to display the plot within VSCode, i.e.:
You can build a docker container that will process the data and output the files as needed. The commands below can be used to build and run the container:
# Ensure that a folder exists for output data
mkdir -p /tmp/data

# Build the docker container
docker build . -t covidanalysis

# Run the container and mount the temp data folder for output
docker run -d -v /tmp/data:/data covidanalysis
You can also build a container that will also host a site displaying the data for you:
# Build site container
docker build . -f Dockerfile-site -t covid-site

# Run container hosting webpage on port 80
docker run -d -p 80:80 covid-site

# You can now view the site on http://localhost
-
automate last updated date -
scrape daily summary data and use it to populate the site-
write script to scrape data from MoH summary here -
implement a javascript approach to insert data into the site
-
-
create a 'master' bash script to run all scrapping processes - add probable to cumulative cases graph
-
replace DHB and age group graphs with heatmaps-
look into heatmap with side bar/histograms
-
- explore vega plots in grid format (using CSS grids) - 'budget' dashboard
-
remove style section out to separate css -
refactor index.html to include external embedded vl scripts
A space for extra notes. Some of the below will be outdated, but keeping for posterity.
The data from the Ministry of Health has dates formatted DD/MM/YYYY, this isn't really compatible with most types of data analysis, which expect YYYY/MM/DD.
-
Create a csv:
xlsx2csv data/NZ_COVID19_data.xlsx > test.csv -
Extract the date reported column, sort and count number of confirmed cases per day:
tail -n +2 test.csv | tr ',' ' ' | awk '{print $1}' | sort -n -k 1.9 -k 1.5 -k 1 | uniq -c
Better to do it in place:
- Reverse the date format from DD/MM/YYYY to YYYY/MM/DD:
- a 'simple' sed command:
sed -r 's/([0-9]{1,2})\/([0-9]{2})\/([0-9]{4})/\3\/\2\/\1/g' - the full command becomes:
xlsx2csv data/NZ_COVID19_data.xlsx | sed -r 's/([0-9]{1,2})\/([0-9]{2})\/([0-9]{4})/\3\/\2\/\1/g' | csvjson | jq > test.json
- a 'simple' sed command:
Better yet:
- [old]:
xlsx2csv data/NZ_COVID19_data.xlsx | csvjson | jq > test.json - [Update]:
xlsx2csv data/NZ_COVID19_data.xlsx | sed -r 's/([0-9]{1,2})\/([0-9]{2})\/([0-9]{4})/\3\\2\/\1/g' | csvjson | jq > data/NZCOVID_formatted.json - [Update]: It turns out that
xlsx2csvhas a really nice function to convert dates and split out sheets:- confirmed cases:
xlsx2csv data/NZ_COVID19_data.xlsx -f %Y/%m/%d -s 1 | tail -n +4 | csvjson | jq > data/NZCOVID_confirmed_formatted.json - probable cases:
xlsx2csv data/NZ_COVID19_data.xlsx -f %Y/%m/%d -s 2 | tail -n +4 | csvjson | jq > data/NZCOVID_probable_formatted.json
- confirmed cases:
