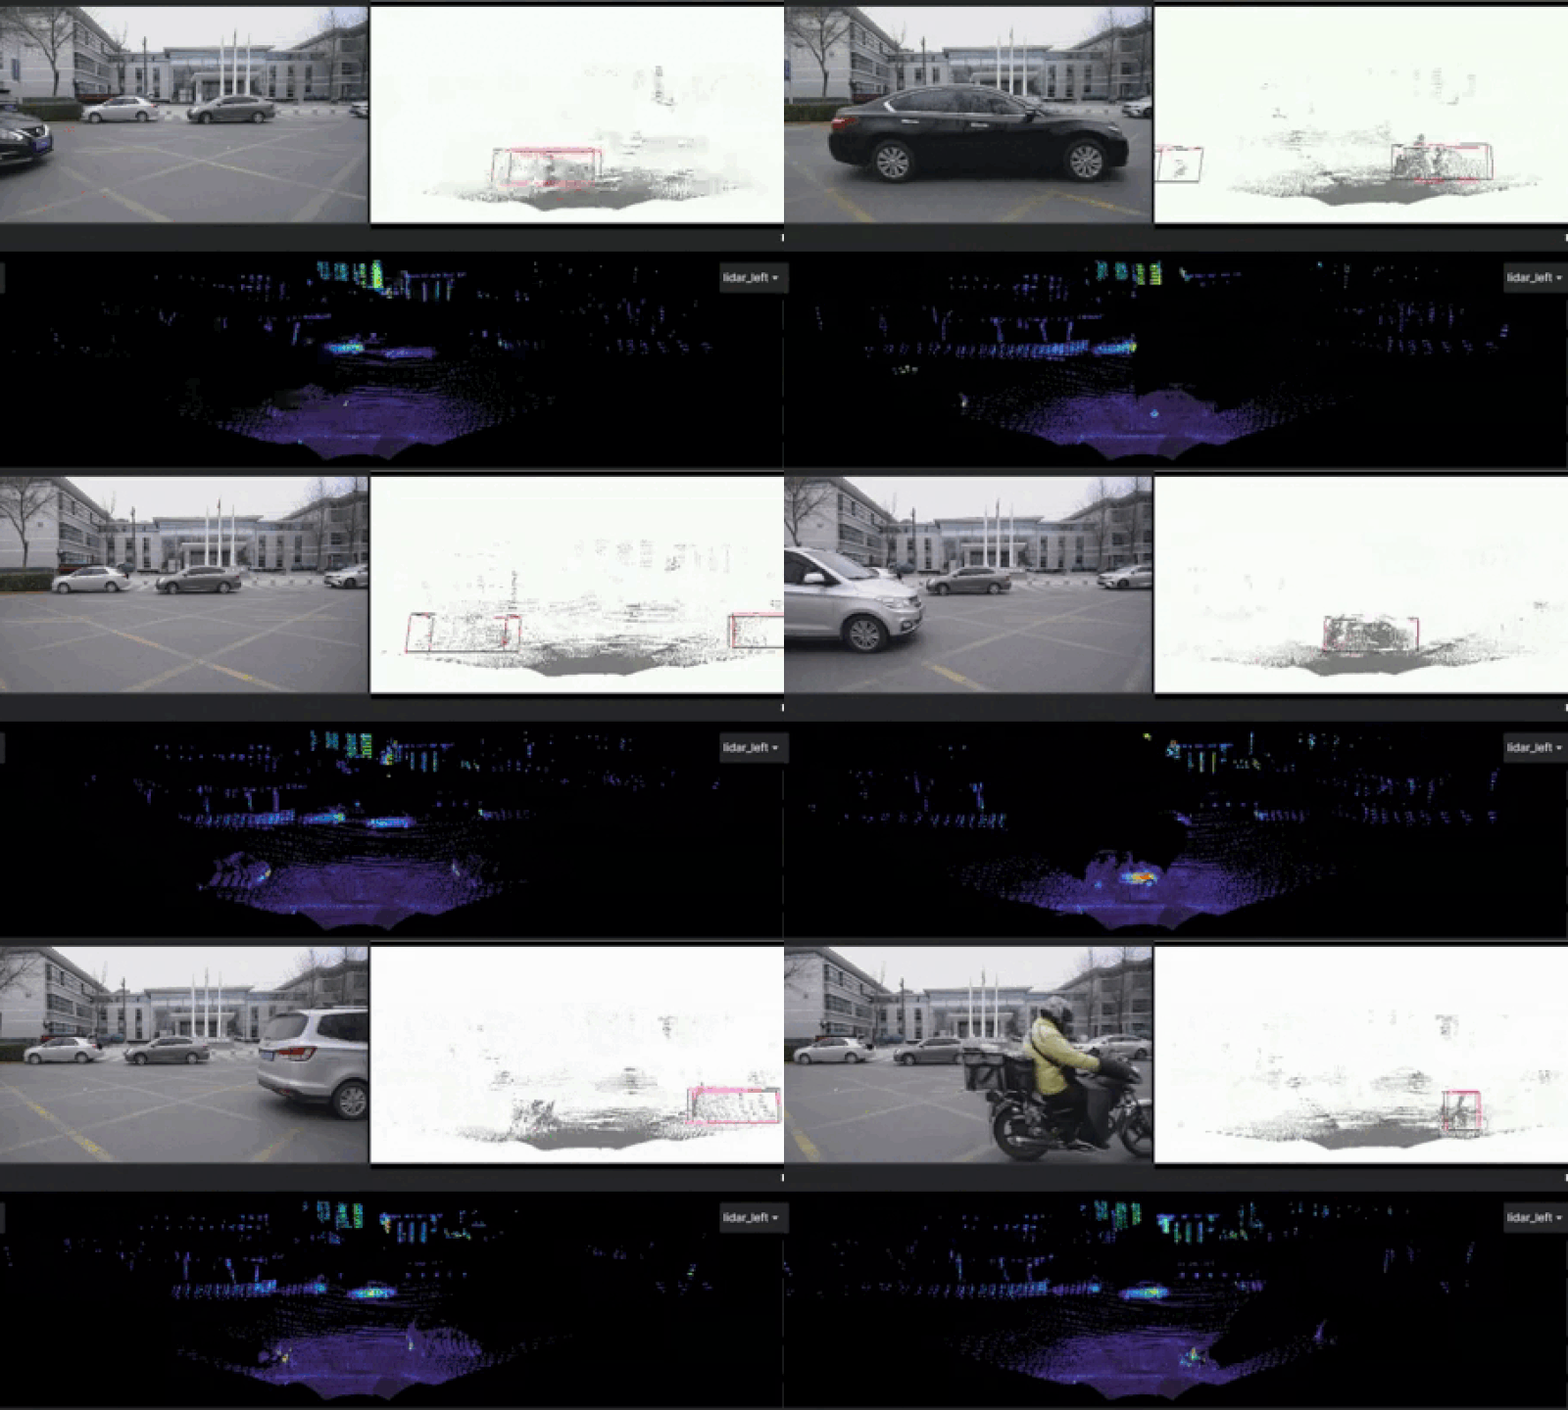
This project contains a ROS2 node that converts PointCloud2 messages to bin files in KITTI format. The project also includes a workflow and scripts to visualize output of 3D object detection in point clouds using TAO-PointPillars. This workflow generates a video of resulting bounding boxes superimposed on input point clouds.
Files in this repository:
to_bin- ROS2 node to convert PointCloud2 messages to bin files. If you already have bin files for your data, please skip to step 2 below. This node subscribes to PointCloud2 messages from a real or simulated lidar on the/point_cloudtopic, and creates a bin file for each point cloud. To read data from a generated bin file (say, pointcloud1.bin):
import numpy as np
pc = np.fromfile("pointcloud1.bin", dtype=np.float32).reshape((-1, 4))
x, y, z, intensity = np.split(pc, 4, axis=1)
To run this node, create, build and source your own ROS2 workspace. Create a folder to store all the generated bin files and run the following command:
ros2 run to_bin convert_to_bin --ros-args -p output_path:="absolute-path-to-save-bin-files" -p intensity_range:=<float-to-scale-intensity>
# For example:
ros2 run to_bin convert_to_bin --ros-args -p output_path:="/home/bin_files/" -p intensity_range:=255.0
The argument intensity_range is a float value specifying the scale factor for dividing intensity. For example, if your model is trained on data where point intensity is in the range [0.0 - 1.0] and input data at inference has intensity in the range [1 - 255], this parameter should be set to 255.0 so that input data matches training data.
run_all_pcs.py- Runs PointPillars inference for all bin files in a folder. Please follow the steps given here to build and use the TAO-PointPillars model.
Replace test/main.cpp from the tensorrt_sample repo with main.cpp from this repo to generate and save results in a text file for each input bin file. Create a folder to save output text files. Re-build the project, copy run_all_pcs.py from the repo to the build folder and run:
mkdir build && cd build
cmake .. -DCUDA_VERSION=<CUDA_VERSION>
make -j8

python3 run_all_pcs.py <class_names> <nms_iou_thresh> <pre_nms_top_n> <absolute-engine-path> <absolute-input-path> <data-type> <absolute-output-path> <--do_profile>
# For example:
python3 run_all_pcs.py "Vehicle,Pedestrian,Cyclist" 0.01 4096  "/home/trt.fp16.engine" "/home/bin_files/" "fp16" "/home/text_files/" --do_profile
Below is a description of each argument:
- class_names: List of object classes detected by the model
- nms_iou_thresh: Float value specifying NMS IOU threshold
- pre_nms_top_n: Float value specifying number of top
nboxes to use for NMS - absolute-engine-path: Absolute path to TensorRT engine generated using tao-converter
- absolute-input-path: Absolute path to input bin files
- data-type: String specifying data type ("fp32" or "fp16")
- absolute-output-path: Absolute path to output folder
- --do_profile: Optional argument - add this to the end of the command to perform profiling
Text files with inference results will be saved in the output folder. Each text file will have the same name as the bin file that generated it. For instance, 1.txt contains inference results for 1.bin.
viz_all_pcs.py- Generates and saves an image for each bin file and corresponding text file. This is based on the visualization tool from here. Ensure that each (bin file, text file) pair have the same name. For example,1.binmust have a corresponding1.txt. The resulting image will also be saved with the same name1.png.
To run this code, your machine must be running Xserver.
Create a folder named visualize and copy visual_tools and viewer.py from this repo to it. The structure should look like this:
.
+- viz_all_pcs.py (from this repo)
+- visualize
   +- visual_tools
   +- viewer.py
Create a folder to store resulting images. To run:
python3 viz_all_pcs.py <absolute-path-to-input-bin-files> <absolute-path-to-input-text-files> <absolute-path-to-save-output-images>
# For example:
python3 viz_all_pcs.py "/home/bin_files/" "/home/text_files/" "/home/result_images/"
bbox_video.py- Merges png images sequentially into a video for viewing point clouds with resulting detections overlaid as 3D bounding boxes. To run:
python3 bbox_video.py <absolute-path-to-images-folder> <absolute-path-to-save-output-video>
# For example:
python3 bbox_video.py "/home/result_images/" "/home/video.avi"
ros2_tao_pointpillars: ROS2 node for 3D object detection in point clouds using TAO-PointPillars.
Please reach out regarding issues and suggestions here.

