The implementation of automotive radar scan matching proposed in "A Normal Distribution Transform-Based Radar Odometry Designed For Scanning and Automotive Radars " , accepted for publication in the IEEE ICRA 2021. This repo contain four ROS packages. Please place them in a catkin workspace to build and run the codes.
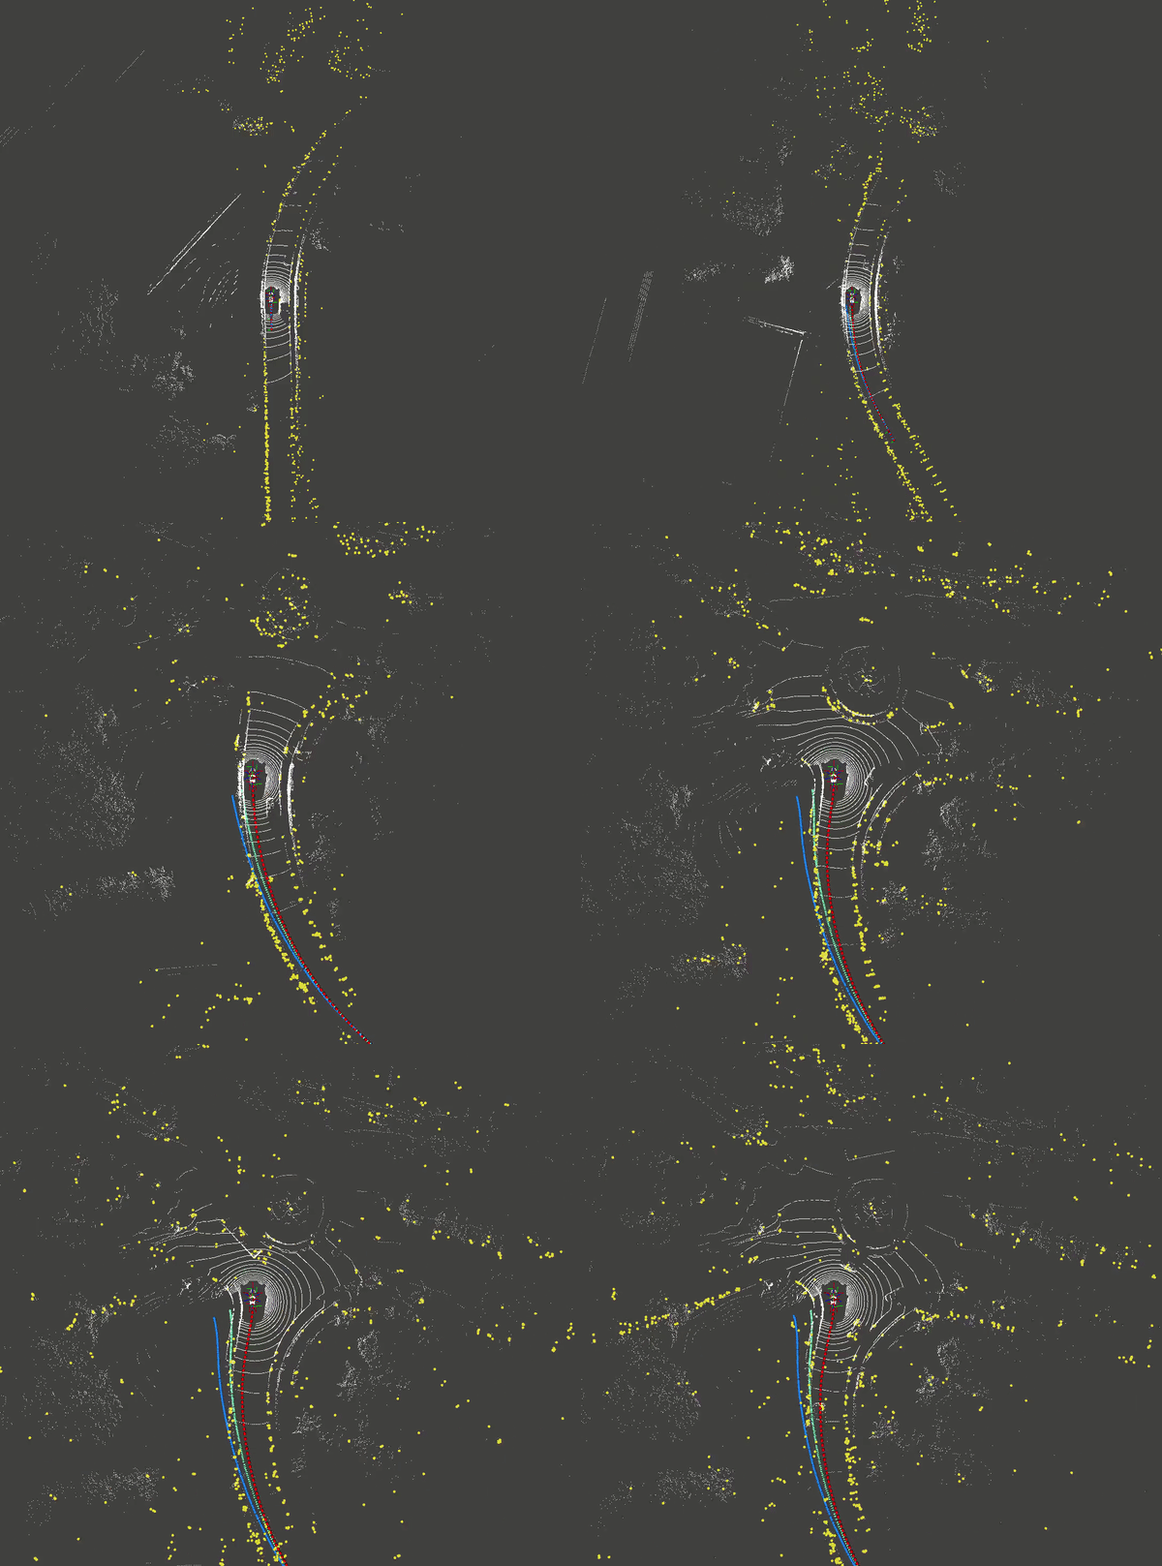
- white: LiDAR points
- yellow: Radar submap
- red path: ground truth odometry
- blue path: ego-velocity integration (Kellner et al.)
- green path: our result
Ubuntu 16 / 18
ROS Kinetic / Melodic
C++14
Python2.7
You can download the sample data from our server: rosbag1, rosbag2, rosbag3, rosbag4
$ cd <your catkin workspace>
$ catkin build conti_radar ro_msg radar_odometry nuscenes
$ roslaunch nuscenes tf_nu.launch
$ roslaunch nuscenes radar_GND_RO.launch
$ cd <where your rosbag locate>
$ rosbag play -r 1 log62_1542193241547892_scene-0997.bag log62_1542193261546825_scene-0998.bag log62_1542193281648047_scene-0999.bag log62_1542193301547950_scene-1000.bag --clock
After running the rosbag, you should see:
----------------------------------------
f time: 1542193320.81622
fl time: 1542193320.84337
fr time: 1542193320.83125
bl time: 1542193320.86423
br time: 1542193320.85886
vel time: 1542193320.81622
iterations_: 31 final eps_: 4.59515e-06
2D Normal Distributions Transform has converged: 1 score: 0.535393
travel_dis: 339.49557
----------------------------------------
f time: 1542193320.89124
fl time: 1542193320.91828
fr time: 1542193320.90609
bl time: 1542193320.94426
br time: 1542193320.93456
vel time: 1542193320.89124
iterations_: 31 final eps_: 7.50436e-06
2D Normal Distributions Transform has converged: 1 score: 2.95933
travel_dis: 340.00385
$ rosrun rviz rviz -d ./config.rviz
If you want to visualize doppler measurements of radar, you have to run the following command.
$ roslaunch nuscenes radar_viz.launch
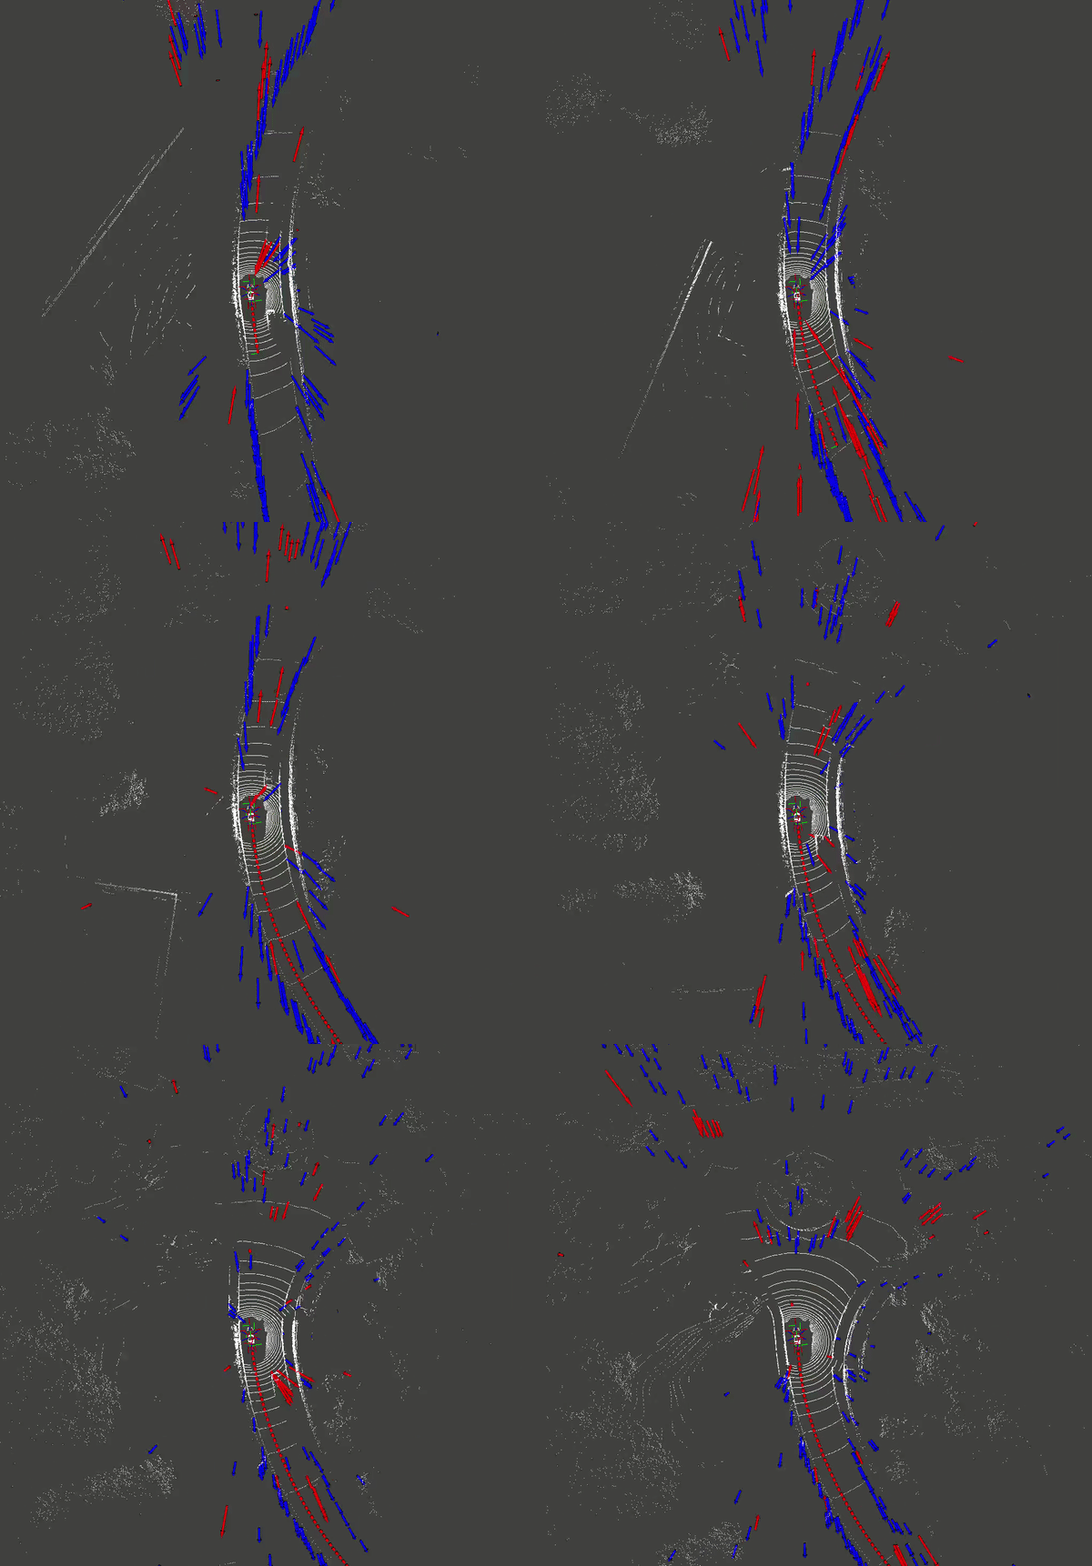
Then you should see this in rviz:
- blue arrows: inliers (static objects)
- red arrows: outliers rejected by RANSAC (moving objects or noises)
$ python radar_odometry/src/viz/viz_sd_from_sparse.py
$ python radar_odometry/src/viz/viz_sparse_ndmap.py
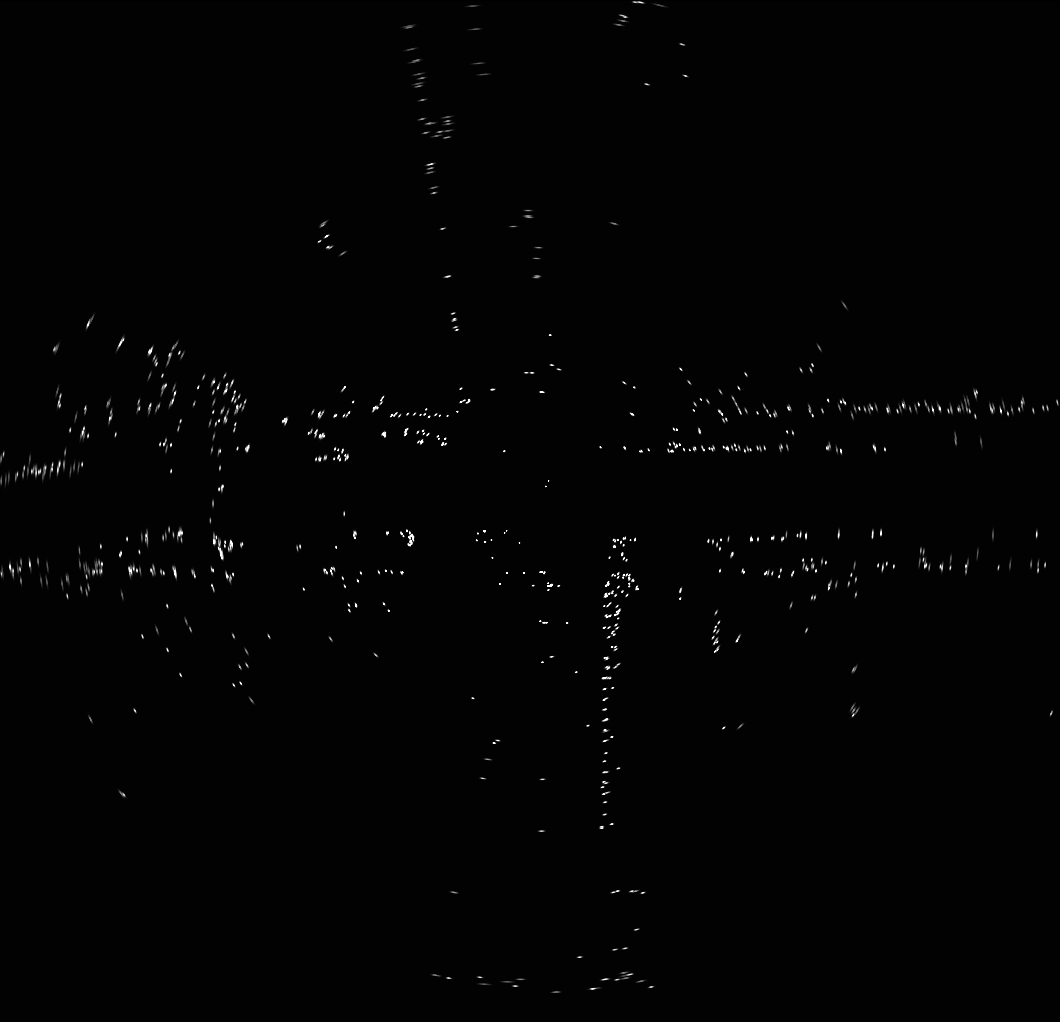
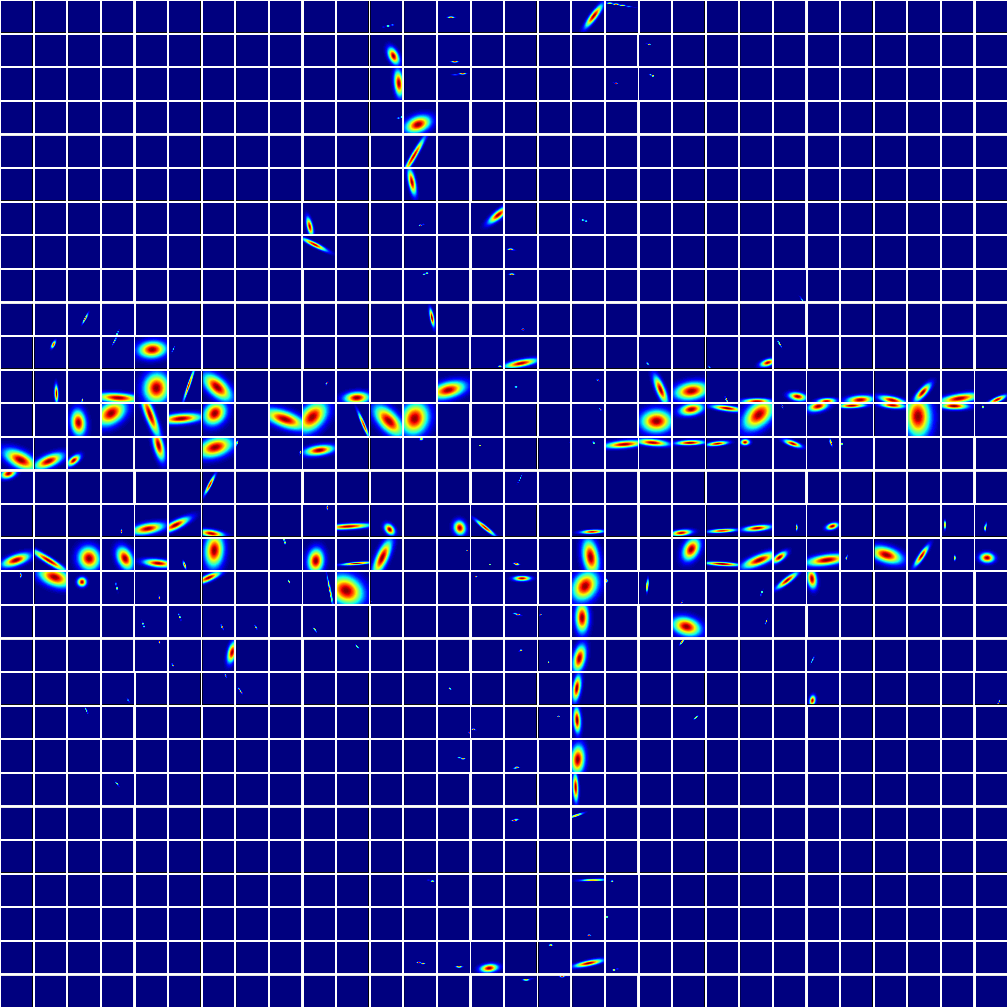
The result should look like this.
Probabilistic Submap:
Normal Distribution Map:


