You can visualize your spectrum and fit the optional number of peaks on GUI using Scipy.optimize.curve_fit method.
pip install interactive-curve-fit==0.0.1Try tutorial.py with your spectrum data!
some header rows,,,...
x,y1,y2,y3
0,0,2,3
1,1,1,2
2,3,2,3
3,1,2,3
4,0,3,4
5,0,2,1
some footer rows,,,...
-
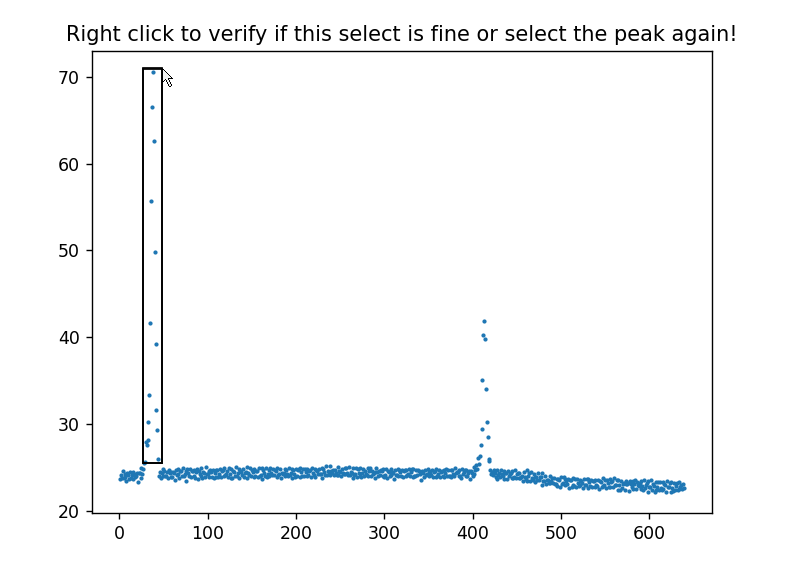
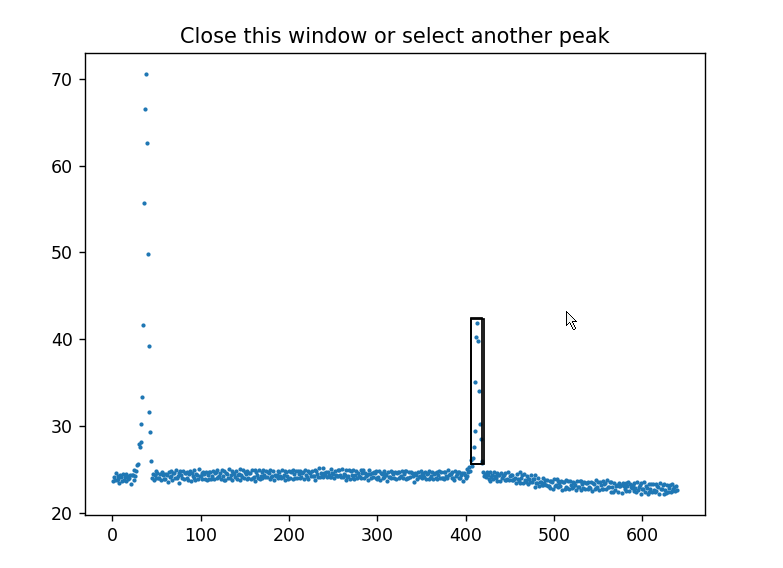
Teach your initial guess of the positions of each peaks roughly to Fitter.
from interactive_curve_fit import read_data, Guessor, Fitter

data = read_data('out/spectrum.csv', headers=2, sep=',')
guessor = Guessor(data, background=10, method='drag')
guess = guessor.guess()
- mouse-dragging (wrap up peak area by mouse-dragging)
- click (click the top and the both edges of each peaks)
-
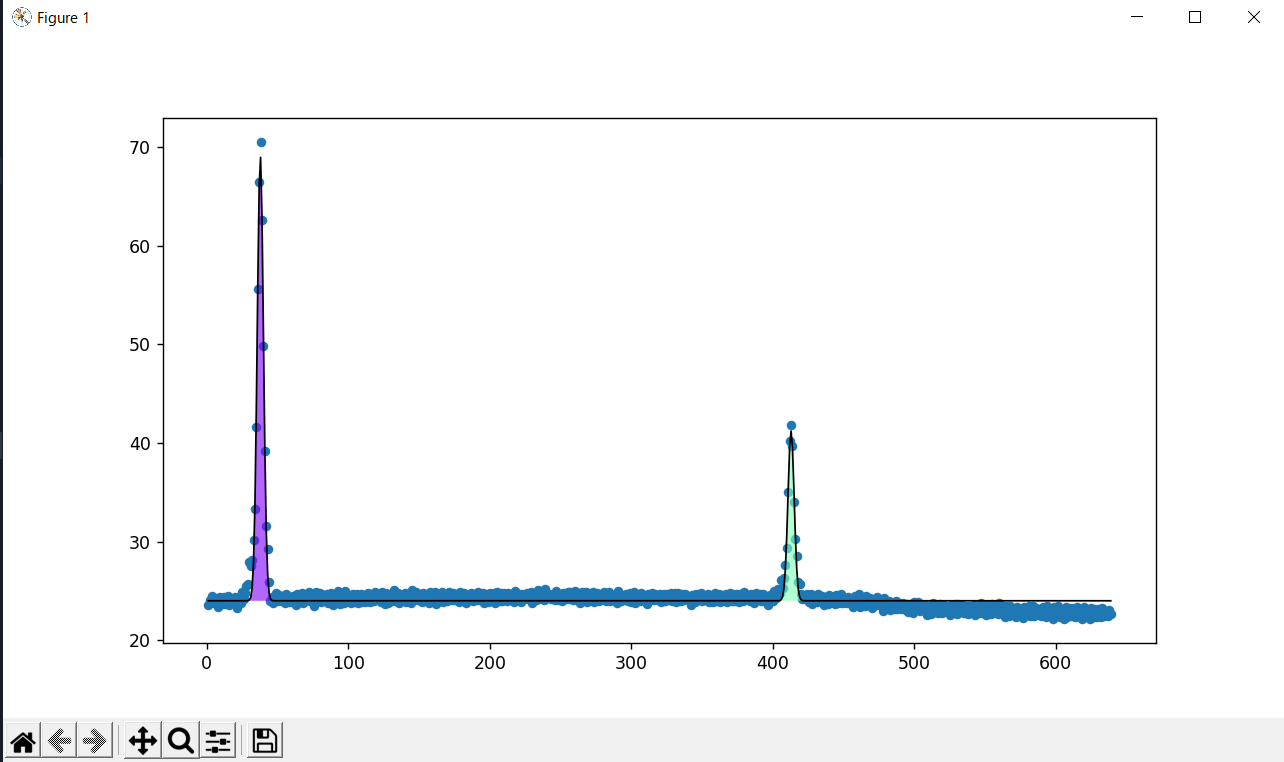
Give your spectrum data and your guess to Fitter.
fitter = Fitter(data, guess)
fitter.run(method='gaussian')
- gaussian function
- polynomial function
- position (x, y) of each peaks
- baseline height of the spectrum
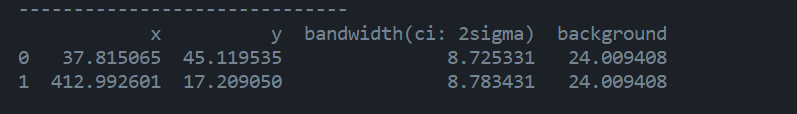
- bandwidth of each peaks with its CI (confidential interval)
-
Save the fitting results
fitter.save_data('out/fitting_result.csv')
-
Other features
bmp_to_csv converts bmp file to csv file.
from interactive_curve_fit import bmg_to_csv
bmp_to_csv('data/line_spectrum.bmp')
data = read_data('data/line_spectrum.csv')
Fitter can visualize fitting results
fitter.plot_fit()Fitter can also display fitting results on terminal
fitter.display_results_terminal(ci=2)


-
ascii file(.asc .csv .txt etc..)
-
bmp image(.bmp .jpg .png .jpeg etc..)
excel sheet files, table of html are planed to be suported in the near future.
- baseline correlation
- other fitting functions (e.g. binomical distribution function)
- automated guessor method using wavelet transform and CNN