Adding Observability to Nomad Applications
Recording of the demo is available on the hashitalk 2021 website. (slides)
This repository demonstrates how you can leverage the Grafana Open Source Observability Stack with Nomad workload.
In this demonstration we will deploy an application (TNS) on Nomad along with the Grafana Stack. The TNS application is written in Go and instrumented with:
- Prometheus Metrics using client_golang.
- Logs using gokit (output format is logfmt).
- Traces using jaeger go client.
You can use the instrumentation of your choice such as: OpenTelemetry, Zipkin, json logs...
We'll also deploy backends to store collected signals:
- Prometheus will scrape Metrics using the scrape endpoint.
- Loki will receive Logs collected by Promtail.
- Tempo will directly receives Traces and Spans.
Finally, we'll deploy Grafana and provision it with all our backend datasources and a dashboard to start with.
Getting Started
For simplicity you'll need to install and configure vagrant.
To get started simply run:
vagrant upIn case you want a faster startup not based on Ubuntu but on Flatcar Linux (as CoreOS has been EOLed):
VAGRANT_VAGRANTFILE=Vagrantfile.flatcar vagrant up
IMPORTANT NOTE: Due to the new policies of Docker Hub image pulling,
(see https://blog.container-solutions.com/dealing-with-docker-hub-rate-limiting)
there may be cases where you will need to docker login to avoid getting error
messages like:
Error response from daemon: toomanyrequests: You have reached your pull rate limit. You may increase the limit by authenticating and upgrading: https://www.docker.com/increase-rate-limit
In order to use DockerHub login, you need to provide two additional environment variables as follows:
DOCKERHUBPASSWD=my-dockerhub-password DOCKERHUBID=my-dockerhub-login vagrant up
Then you should be able to access:
- TNS app => http://127.0.0.1:8001/
- Nomad => http://127.0.0.1:4646/ui/
- Consul => http://127.0.0.1:8500/ui/
- Grafana => http://127.0.0.1:3000/
- Prometheus => http://127.0.0.1:9090/
- Promtail => http://127.0.0.1:3200/
- Loki => http://127.0.0.1:3100/
- Nginx => http://127.0.0.1:8888/ and http://127.0.0.1:8888/demo/
- cAdvisor => http://127.0.0.1:8080/
- Netdata => http://127.0.0.1:19999/
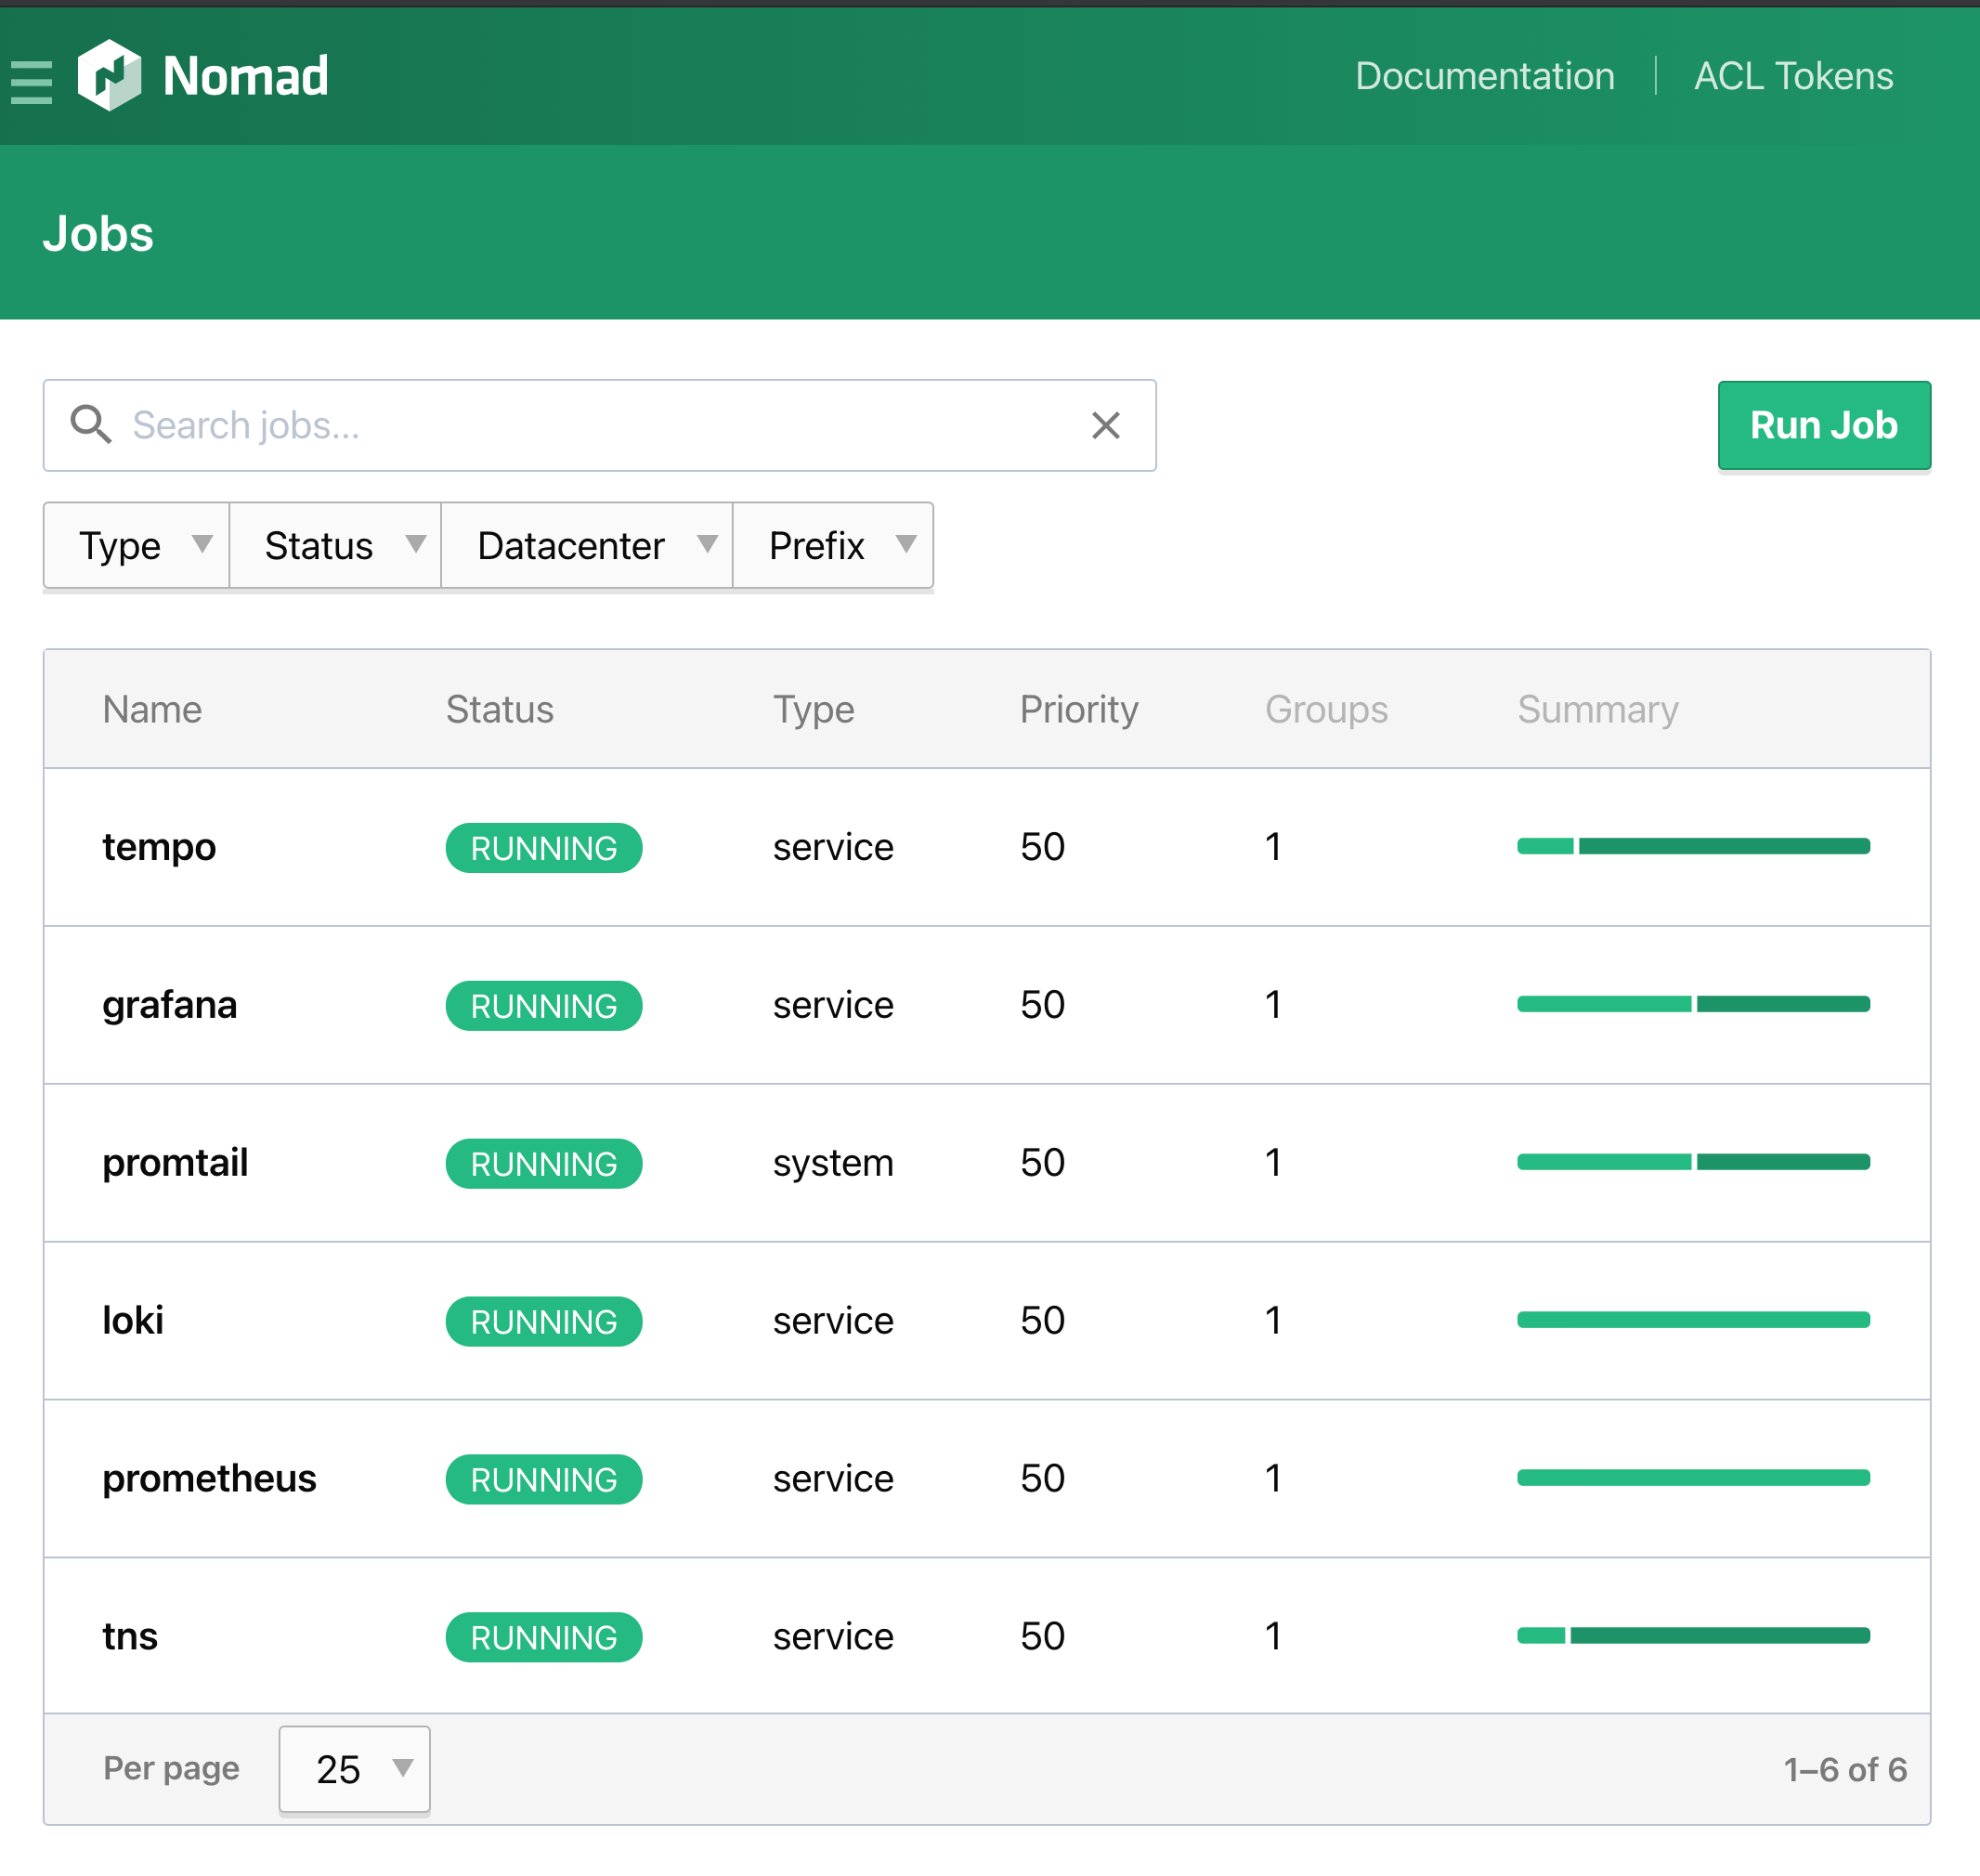
You can go to the Nomad UI Jobs page to see all running jobs.
Nomad Client Configuration
Promtail need to access host logs folder. (alloc/{task_id}/logs) By default the docker driver in nomad doesn't allow mounting volumes. In this example we have enabled it using the plugin stanza:
  plugin "docker" {
    config {
      volumes {
        enabled      = true
      }
    }
  }
However you can also simply run Promtail binary on the host manually too or use nomad host_volume feature.
Promtail also needs to save tail positions in a file, you should make sure this file is always the same between restart. Again in this example we're using a host path mounted in the container to persist this file,
Troubleshooting
Grafana shows nothing or TNS keeps crashing because of it can't connect to Tempo
- You may have troubles with your
dnsconfiguration in the jobs, if your jobs can't talks to each other tries to change the ip to127.0.0.1or the internal ip address of your server if using aVPCor just removes thednsstanza. It's recommanded to use Consul Connect to connect every services to each others.
I can't see the logs in Grafana/Loki
- You may have a different
data_dirconfig in yournomadconfiguration. Here it's using/opt/nomad/datawhile we generally sets/opt/nomad. If it's your case, change thevolumestanza of yourtempojob.
