Replication code for “Crossing the Linguistic Causeway: A Binational Approach for Translating Soundscape Attributes to Bahasa Melayu”
This repository contains the code accompanying the publication “Crossing the Linguistic Causeway: A Binational Approach for Translating Soundscape Attributes to Bahasa Melayu”. This paper is hosted on arXiv and the raw dataset is hosted at 10.21979/N9/0NE37R.
The code has been tested on the following platform.
R version 4.1.1 (2021-08-10)
Platform: aarch64-apple-darwin20 (64-bit)
locale: en_US.UTF-8||en_US.UTF-8||en_US.UTF-8||C||en_US.UTF-8||en_US.UTF-8
attached base packages: stats, graphics, grDevices, utils, datasets, methods and base
other attached packages: RColorBrewer(v.1.1-3), fmsb(v.0.7.1), conover.test(v.1.1.5), muStat(v.1.7.0), rstatix(v.0.7.0), tidyr(v.1.2.0), kableExtra(v.1.3.4), stringr(v.1.4.0), dplyr(v.1.0.9), dataverse(v.0.3.10) and pander(v.0.6.5)
loaded via a namespace (and not attached): tidyselect(v.1.1.2), xfun(v.0.31), purrr(v.0.3.4), haven(v.2.4.3), carData(v.3.0-4), colorspace(v.2.0-3), vctrs(v.0.4.1), generics(v.0.1.2), htmltools(v.0.5.2), viridisLite(v.0.4.0), yaml(v.2.3.5), utf8(v.1.2.2), rlang(v.1.0.3), pillar(v.1.7.0), foreign(v.0.8-81), glue(v.1.6.2), DBI(v.1.1.1), readxl(v.1.3.1), lifecycle(v.1.0.1), cellranger(v.1.1.0), munsell(v.0.5.0), zip(v.2.2.0), rvest(v.1.0.2), evaluate(v.0.15), forcats(v.0.5.1), knitr(v.1.39), rio(v.0.5.27), fastmap(v.1.1.0), curl(v.4.3.2), fansi(v.1.0.3), broom(v.0.7.9), Rcpp(v.1.0.8.3), scales(v.1.2.0), backports(v.1.4.1), webshot(v.0.5.3), abind(v.1.4-5), systemfonts(v.1.0.4), hms(v.1.1.0), digest(v.0.6.29), openxlsx(v.4.2.4), stringi(v.1.7.6), cli(v.3.3.0), tools(v.4.1.1), magrittr(v.2.0.3), tibble(v.3.1.7), crayon(v.1.5.1), car(v.3.0-11), pkgconfig(v.2.0.3), ellipsis(v.0.3.2), data.table(v.1.14.2), xml2(v.1.3.3), assertthat(v.0.2.1), rmarkdown(v.2.14), svglite(v.2.1.0), httr(v.1.4.3), rstudioapi(v.0.13), R6(v.2.5.1) and compiler(v.4.1.1)
The raw data file is retrieved and cleaned.
The raw dataset is retrieved from the DR-NTU (Data) [https://researchdata.ntu.edu.sg] Dataverse repository at 10.21979/N9/0NE37R and processed.
#Set dataverse server
Sys.setenv("DATAVERSE_SERVER" = "https://researchdata.ntu.edu.sg")
#Retrieve raw data in csv
dataset <- get_dataframe_by_name(
  filename = "SATPQn.csv",
  dataset = "doi:10.21979/N9/0NE37R",
  original = TRUE,
.f = read.csv)The raw data headers are first converted to ASCII to remove UTF-8 formatting. The survey responses are subsetted to remove participant data with “country of residence” that is neither Singapore (SG) or Malaysia (MY). The resulting dataset consists of 63 participant responses after the removal of 3 participants.
This is followed by extraction of individual dataframes corresponding to the respective criteria categories for main and derived axis attributes, respectively.
#convert column names to ASCII
colnames(dataset)<-iconv(colnames(dataset),
                        from = 'UTF-8',
                        to = 'ASCII//TRANSLIT')

#remove non-SG/MY respondents
sgmydata <- dataset %>%
        dplyr::rename(COUNTRY=Current.country.of.residence) %>%
        mutate(COUNTRY=ifelse(COUNTRY=="Malaysia","MY", COUNTRY)) %>%
        mutate(COUNTRY=ifelse(COUNTRY=="Singapore","SG", COUNTRY)) %>%
        mutate(COUNTRY=ifelse(COUNTRY=="Europe","Others", COUNTRY)) %>%
        mutate(COUNTRY=ifelse(COUNTRY=="Asia (excl. MY and SG)",
                              "Others", COUNTRY)) %>%
        filter(!str_detect(COUNTRY, "Others"))

#define column names for main and derived axes
mainColnames<-c('COUNTRY','APPR','UNDR','ANTO','BIAS',
                'ASSOCCW','IMPCCW','ASSOCW','IMPCW','CANDIDATE')

derivedColnames<-c('COUNTRY','APPR','UNDR','ASSOCCW',
                   'IMPCCW','ASSOCW','IMPCW','CANDIDATE')

#extract responses for each PAQ attribute and rename columns with criteria
#main axes
eventdf<-sgmydata %>%
        select(matches('that.meriah|is.meriah|COUNTRY')) %>%
        mutate(candidate="meriah") %>% setNames(mainColnames)

pleasdf<-sgmydata %>%
        select(matches('menyenangkan|COUNTRY')) %>%
        mutate(candidate="menyenangkan") %>% setNames(mainColnames)

uneventdf<-sgmydata %>%
        select(matches('tidak.meriah|COUNTRY')) %>%
        mutate(candidate="tidak meriah") %>% setNames(mainColnames)

annoydf<-rbind(sgmydata %>%
                select(matches('membingitkan|COUNTRY')) %>%
                mutate(candidate="membingitkan") %>%
                setNames(mainColnames),
               sgmydata %>%
                select(matches('menjengkelkan|COUNTRY')) %>%
                mutate(candidate="menjengkelkan") %>%
                setNames(mainColnames))

#dervied axes
vibrantdf<-rbind(sgmydata %>% select(matches('rancak|COUNTRY')) %>%
                         mutate(candidate="rancak") %>%
                         setNames(derivedColnames),
                 sgmydata %>% select(matches('bersemarak|COUNTRY')) %>%
                         mutate(candidate="bersemarak") %>%
                         setNames(derivedColnames))

calmdf<-rbind(sgmydata %>% select(matches('tenang|COUNTRY')) %>%
                         mutate(candidate="tenang") %>%
                         setNames(derivedColnames),
                 sgmydata %>% select(matches('menenangkan|COUNTRY')) %>%
                         mutate(candidate="menenangkan") %>%
                         setNames(derivedColnames))

monotdf<-rbind(sgmydata %>% select(matches('that.membosankan|COUNTRY')) %>%
                         mutate(candidate="membosankan") %>%
                         setNames(derivedColnames),
                sgmydata %>% select(matches('tidak.berubah.oleh.itu.membosankan|COUNTRY')) %>%
                         mutate(candidate="tidak berubah oleh itu membosankan") %>%
                         setNames(derivedColnames),
               sgmydata %>% select(matches('kurang.kepelbagaian.oleh.itu.membosankan|COUNTRY')) %>%
                         mutate(candidate="kurang kepelbagaian oleh itu membosankan") %>%
                         setNames(derivedColnames))

chaoticdf<-rbind(sgmydata %>% select(matches('huru.hara|COUNTRY')) %>%
                         mutate(candidate="huru-hara") %>%
                         setNames(derivedColnames),
                 sgmydata %>% select(matches('kelam.kabut|COUNTRY')) %>%
                         mutate(candidate="kelam-kabut") %>%
setNames(derivedColnames))#column names
demoCol <- c("Prof.zsm","Prof.eng","COUNTRY","LoSOut","DISCIPLINE")
sgmydata_demo <- sgmydata %>%
select(2:6) %>% setNames(demoCol) %>%
mutate(DISCIPLINE=ifelse(grepl('*Science*',DISCIPLINE, ignore.case=T),
"Sciences", DISCIPLINE)) %>%
mutate(DISCIPLINE=ifelse(grepl('*Physic*',DISCIPLINE, ignore.case=T),
"Sciences", DISCIPLINE)) %>%
mutate(DISCIPLINE=ifelse(grepl('*Math*',DISCIPLINE, ignore.case=T),
"Sciences", DISCIPLINE)) %>%
mutate(DISCIPLINE=ifelse(grepl('*English*',DISCIPLINE, ignore.case=T),
"HASS", DISCIPLINE)) %>%
mutate(DISCIPLINE=ifelse(grepl('*Psychology*',DISCIPLINE, ignore.case=T),
"HASS", DISCIPLINE)) %>%
mutate(DISCIPLINE=ifelse(grepl('*Literature*',DISCIPLINE, ignore.case=T),
"HASS", DISCIPLINE)) %>%
mutate(DISCIPLINE=ifelse(grepl('*Sociology*',DISCIPLINE, ignore.case=T),
"HASS", DISCIPLINE)) %>%
mutate(DISCIPLINE=ifelse(grepl('*Media*',DISCIPLINE, ignore.case=T),
"HASS", DISCIPLINE)) %>%
mutate(DISCIPLINE=ifelse(grepl('*geog*',DISCIPLINE, ignore.case=T),
"HASS", DISCIPLINE)) %>%
mutate(DISCIPLINE=ifelse(grepl('*Music*',DISCIPLINE, ignore.case=T),
"Audio-related", DISCIPLINE)) %>%
mutate(DISCIPLINE=ifelse(grepl('*Sound*',DISCIPLINE, ignore.case=T),
"Audio-related", DISCIPLINE)) %>%
mutate(DISCIPLINE=ifelse(grepl('*Audio*',DISCIPLINE, ignore.case=T),
"Audio-related", DISCIPLINE)) %>%
mutate(DISCIPLINE=ifelse(grepl('*Acoustic*',DISCIPLINE, ignore.case=T),
"Audio-related", DISCIPLINE)) %>%
mutate(DISCIPLINE=ifelse(grepl('*engineering*',DISCIPLINE, ignore.case=T),
"Engineering", DISCIPLINE)) %>%
mutate(DISCIPLINE=ifelse(grepl('*tech*',DISCIPLINE, ignore.case=T),
"Engineering", DISCIPLINE)) %>%
mutate(DISCIPLINE=ifelse(!grepl('Sciences|Engineering|HASS|Audio-related',
DISCIPLINE, ignore.case=F),
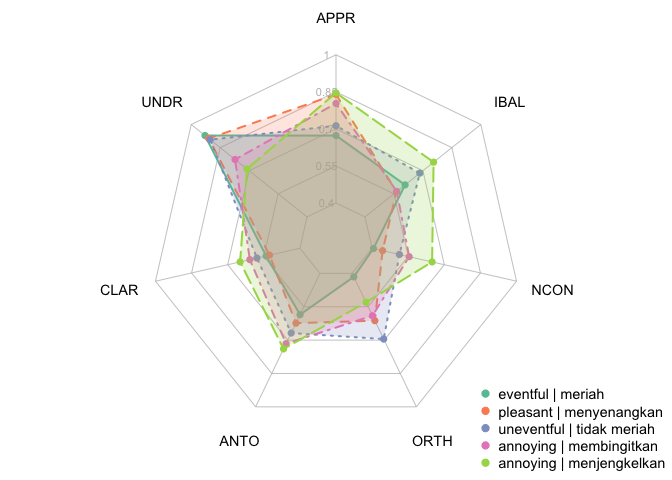
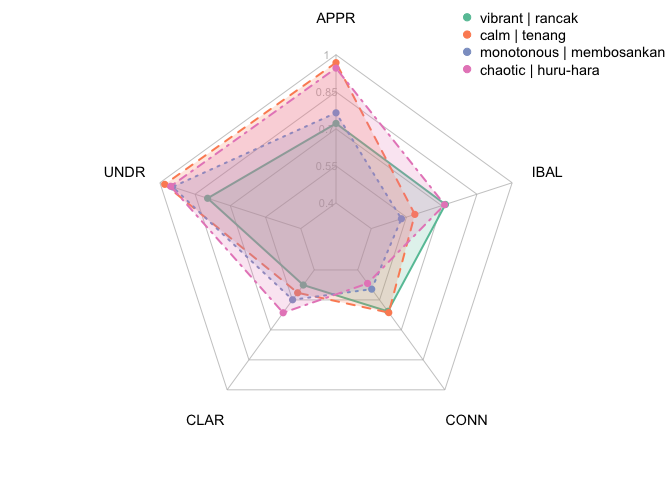
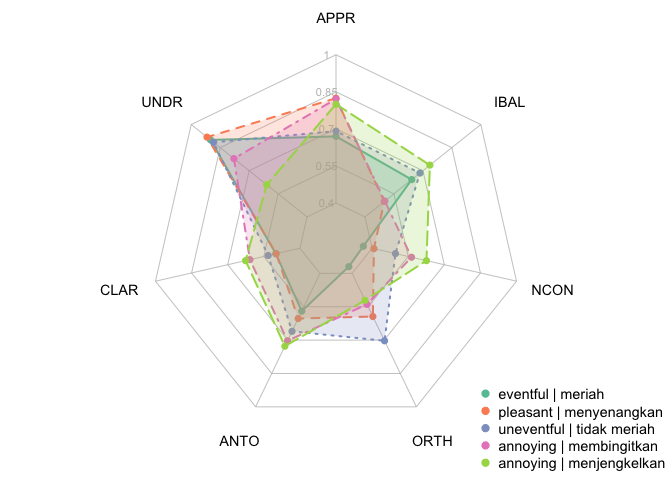
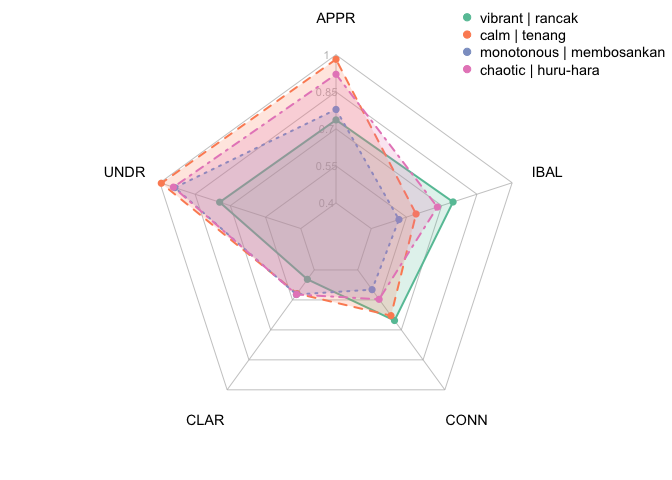
"Others", DISCIPLINE))Main Axes: APPR, UNDR, CLAR, ANTO, ORTH, NCON, IBAL Derived Axes: APPR, UNDR, CLAR, CONN, IBAL
#compute formulation across df of attributes on main axes
main.formulated<-list(eventdf,pleasdf,uneventdf,annoydf) %>%
        lapply(mainForm)

#compute formulation across df of attributes on derived axes
der.formulated<-list(vibrantdf,calmdf,monotdf,chaoticdf) %>%
        lapply(derForm)

eventformdf<-main.formulated[[1]]
pleasformdf<-main.formulated[[2]]
uneventformdf<-main.formulated[[3]]
annoyformdf<-main.formulated[[4]] %>%
        mutate(SPLITCANDIDATE=paste(COUNTRY,CANDIDATE))
vibrantformdf<-der.formulated[[1]] %>%
        mutate(SPLITCANDIDATE=paste(COUNTRY,CANDIDATE))
calmformdf<-der.formulated[[2]] %>%
        mutate(SPLITCANDIDATE=paste(COUNTRY,CANDIDATE))
monotformdf<-der.formulated[[3]] %>%
        mutate(SPLITCANDIDATE=paste(COUNTRY,CANDIDATE))
chaoticformdf<-der.formulated[[4]] %>%
mutate(SPLITCANDIDATE=paste(COUNTRY,CANDIDATE))The demographics of the 63 participants are summarised based on “length of stay outside SG/MY”, “disiciplines”, “malay language proficiency”, and “english language proficiency”.
#LoS
sgmydata_demo %>%
  group_by(LoSOut) %>%
  summarise(Singapore=sum(COUNTRY=="SG"),Malaysia=sum(COUNTRY=="MY")) %>%
  kbl(caption = "Length of Stay Outside SG/MY") %>%
kable_classic(full_width = F, html_font = "Cambria")| LoSOut | Singapore | Malaysia |
|---|---|---|
| \>10 years | 1 | 2 |
| 1-5 years | 2 | 10 |
| 6 months | 1 | 0 |
| 6-10 years | 2 | 4 |
| Less than 6 month | 0 | 1 |
| NA | 27 | 13 |
#Disicpline
sgmydata_demo %>%
  group_by(DISCIPLINE) %>%
  summarise(Singapore=sum(COUNTRY=="SG"),Malaysia=sum(COUNTRY=="MY")) %>%
  kbl(caption = "Discipline") %>%
kable_classic(full_width = F, html_font = "Cambria")| DISCIPLINE | Singapore | Malaysia |
|---|---|---|
| Audio-related | 7 | 3 |
| Engineering | 11 | 5 |
| HASS | 4 | 9 |
| Others | 5 | 11 |
| Sciences | 6 | 2 |
#Malay Language Proficiency
sgmydata_demo %>%
  group_by(Prof.zsm) %>%
  summarise(Singapore=sum(COUNTRY=="SG"),Malaysia=sum(COUNTRY=="MY")) %>%
  kbl(caption = "Malay Language Proficiency") %>%
kable_classic(full_width = F, html_font = "Cambria")| Prof.zsm | Singapore | Malaysia |
|---|---|---|
| Full Professional Proficiency | 6 | 4 |
| Limited Working Proficiency | 4 | 2 |
| Native Proficiency | 15 | 17 |
| Professional Working Proficiency | 8 | 7 |
#English Language Proficiency
sgmydata_demo %>%
  group_by(Prof.zsm) %>%
  summarise(Singapore=sum(COUNTRY=="SG"),Malaysia=sum(COUNTRY=="MY")) %>%
  kbl(caption = "English Language Proficiency") %>%
kable_classic(full_width = F, html_font = "Cambria")| Prof.zsm | Singapore | Malaysia |
|---|---|---|
| Full Professional Proficiency | 6 | 4 |
| Limited Working Proficiency | 4 | 2 |
| Native Proficiency | 15 | 17 |
| Professional Working Proficiency | 8 | 7 |
Compute criteria mean scores of all PAQ attributes across the combined, SG, and MY populations.
#Combined cases

#main axes
mainAxCOMBmean <- rbind(cbind(data.frame(PAQ="eventful"),mainAxSummary(eventformdf)),
      cbind(data.frame(PAQ="pleasant"),mainAxSummary(pleasformdf)),
      cbind(data.frame(PAQ="uneventful"),mainAxSummary(uneventformdf)),
      cbind(data.frame(PAQ="annoying"),mainAxSummary(annoyformdf))) %>%
        mutate(COUNTRY="Combined")

#derived axes
derAxCOMBmean <-rbind(cbind(data.frame(PAQ="vibrant"),derAxSummary(vibrantformdf)),
      cbind(data.frame(PAQ="calm"),derAxSummary(calmformdf)),
      cbind(data.frame(PAQ="monotonous"),derAxSummary(monotformdf)),
      cbind(data.frame(PAQ="chaotic"),derAxSummary(chaoticformdf))) %>%
        mutate(COUNTRY="Combined")

#Split cases (SG/MY)
#main axes
mainAxSPLITmean <- rbind(cbind(data.frame(PAQ="eventful"),mainAxSummarySPLIT(eventformdf)),
      cbind(data.frame(PAQ="pleasant"),mainAxSummarySPLIT(pleasformdf)),
      cbind(data.frame(PAQ="uneventful"),mainAxSummarySPLIT(uneventformdf)),
      cbind(data.frame(PAQ="annoying"),mainAxSummarySPLIT(annoyformdf)))

#derived axes
derAxSPLITmean <-rbind(cbind(data.frame(PAQ="vibrant"),derAxSummarySPLIT(vibrantformdf)),
      cbind(data.frame(PAQ="calm"),derAxSummarySPLIT(calmformdf)),
      cbind(data.frame(PAQ="monotonous"),derAxSummarySPLIT(monotformdf)),
      cbind(data.frame(PAQ="chaotic"),derAxSummarySPLIT(chaoticformdf)))

#pivot dataframe for visualisation
summaryMean<-rbind(rbind(mainAxCOMBmean,mainAxSPLITmean) %>%
        pivot_longer(cols=!c(PAQ,CANDIDATE,COUNTRY),
                                      names_to="CRITERIA",
                                      values_to="mean"),
        rbind(derAxCOMBmean,derAxSPLITmean) %>%
        pivot_longer(cols=!c(PAQ,CANDIDATE,COUNTRY),
                                      names_to="CRITERIA",
                                      values_to="mean")) %>%
        group_by(PAQ,CRITERIA,CANDIDATE) %>%
        summarise(Combined=mean[COUNTRY=="Combined"],
                  SG=mean[COUNTRY=="SG"],
                  MY=mean[COUNTRY=="MY"])

#Plot table of mean scores
summaryMean %>%
        kbl(caption = "Mean evaluation scores for the
            PAQ attributes for all evaluation criteria across combined,
            SG and MY populations") %>%
kable_classic(full_width = F, html_font = "Cambria")| PAQ | CRITERIA | CANDIDATE | Combined | SG | MY |
|---|---|---|---|---|---|
| annoying | ANTO | membingitkan | 0.7158730 | 0.7030303 | 0.7300000 |
| annoying | ANTO | menjengkelkan | 0.7396825 | 0.7272727 | 0.7533333 |
| annoying | APPR | membingitkan | 0.8031746 | 0.8212121 | 0.7833333 |
| annoying | APPR | menjengkelkan | 0.8460317 | 0.8000000 | 0.8966667 |
| annoying | CLAR | membingitkan | 0.6079365 | 0.6075758 | 0.6083333 |
| annoying | CLAR | menjengkelkan | 0.6484127 | 0.6257576 | 0.6733333 |
| annoying | IBAL | membingitkan | 0.5650794 | 0.5030303 | 0.6333333 |
| annoying | IBAL | menjengkelkan | 0.7555556 | 0.7363636 | 0.7766667 |
| annoying | NCON | membingitkan | 0.5539683 | 0.5636364 | 0.5433333 |
| annoying | NCON | menjengkelkan | 0.6492063 | 0.6257576 | 0.6750000 |
| annoying | ORTH | membingitkan | 0.5904762 | 0.5393939 | 0.6466667 |
| annoying | ORTH | menjengkelkan | 0.5301587 | 0.5212121 | 0.5400000 |
| annoying | UNDR | membingitkan | 0.7730159 | 0.7787879 | 0.7666667 |
| annoying | UNDR | menjengkelkan | 0.7111111 | 0.6090909 | 0.8233333 |
| calm | APPR | menenangkan | 0.8380952 | 0.8575758 | 0.8166667 |
| calm | APPR | tenang | 0.9682540 | 0.9818182 | 0.9533333 |
| calm | CLAR | menenangkan | 0.4817460 | 0.4393939 | 0.5283333 |
| calm | CLAR | tenang | 0.5142857 | 0.5181818 | 0.5100000 |
| calm | CONN | menenangkan | 0.5888889 | 0.6363636 | 0.5366667 |
| calm | CONN | tenang | 0.6134921 | 0.6287879 | 0.5966667 |
| calm | IBAL | menenangkan | 0.5841270 | 0.6303030 | 0.5333333 |
| calm | IBAL | tenang | 0.5857143 | 0.5909091 | 0.5800000 |
| calm | UNDR | menenangkan | 0.9095238 | 0.9090909 | 0.9100000 |
| calm | UNDR | tenang | 0.9793651 | 0.9939394 | 0.9633333 |
| chaotic | APPR | huru-hara | 0.9460317 | 0.9212121 | 0.9733333 |
| chaotic | APPR | kelam-kabut | 0.7904762 | 0.7090909 | 0.8800000 |
| chaotic | CLAR | huru-hara | 0.6142857 | 0.5227273 | 0.7150000 |
| chaotic | CLAR | kelam-kabut | 0.6547619 | 0.6287879 | 0.6833333 |
| chaotic | CONN | huru-hara | 0.4674603 | 0.5469697 | 0.3800000 |
| chaotic | CONN | kelam-kabut | 0.4142857 | 0.4575758 | 0.3666667 |
| chaotic | IBAL | huru-hara | 0.7126984 | 0.6818182 | 0.7466667 |
| chaotic | IBAL | kelam-kabut | 0.7079365 | 0.6848485 | 0.7333333 |
| chaotic | UNDR | huru-hara | 0.9539683 | 0.9424242 | 0.9666667 |
| chaotic | UNDR | kelam-kabut | 0.9476190 | 0.9272727 | 0.9700000 |
| eventful | ANTO | meriah | 0.5857143 | 0.5696970 | 0.6033333 |
| eventful | APPR | meriah | 0.6730159 | 0.6696970 | 0.6766667 |
| eventful | CLAR | meriah | 0.5404762 | 0.5000000 | 0.5850000 |
| eventful | IBAL | meriah | 0.6079365 | 0.6424242 | 0.5700000 |
| eventful | NCON | meriah | 0.4055556 | 0.3636364 | 0.4516667 |
| eventful | ORTH | meriah | 0.4158730 | 0.3696970 | 0.4666667 |
| eventful | UNDR | meriah | 0.9285714 | 0.9000000 | 0.9600000 |
| monotonous | APPR | kurang kepelbagaian oleh itu membosankan | 0.7761905 | 0.7666667 | 0.7866667 |
| monotonous | APPR | membosankan | 0.7650794 | 0.7787879 | 0.7500000 |
| monotonous | APPR | tidak berubah oleh itu membosankan | 0.6539683 | 0.6878788 | 0.6166667 |
| monotonous | CLAR | kurang kepelbagaian oleh itu membosankan | 0.5365079 | 0.5303030 | 0.5433333 |
| monotonous | CLAR | membosankan | 0.5492063 | 0.5227273 | 0.5783333 |
| monotonous | CLAR | tidak berubah oleh itu membosankan | 0.5642857 | 0.5560606 | 0.5733333 |
| monotonous | CONN | kurang kepelbagaian oleh itu membosankan | 0.4857143 | 0.5075758 | 0.4616667 |
| monotonous | CONN | membosankan | 0.4960317 | 0.4984848 | 0.4933333 |
| monotonous | CONN | tidak berubah oleh itu membosankan | 0.4539683 | 0.4681818 | 0.4383333 |
| monotonous | IBAL | kurang kepelbagaian oleh itu membosankan | 0.5619048 | 0.4878788 | 0.6433333 |
| monotonous | IBAL | membosankan | 0.5285714 | 0.5181818 | 0.5400000 |
| monotonous | IBAL | tidak berubah oleh itu membosankan | 0.5460317 | 0.5000000 | 0.5966667 |
| monotonous | UNDR | kurang kepelbagaian oleh itu membosankan | 0.8047619 | 0.7787879 | 0.8333333 |
| monotonous | UNDR | membosankan | 0.9460317 | 0.9363636 | 0.9566667 |
| monotonous | UNDR | tidak berubah oleh itu membosankan | 0.7650794 | 0.7757576 | 0.7533333 |
| pleasant | ANTO | menyenangkan | 0.6238095 | 0.6030303 | 0.6466667 |
| pleasant | APPR | menyenangkan | 0.8396825 | 0.8242424 | 0.8566667 |
| pleasant | CLAR | menyenangkan | 0.5261905 | 0.4984848 | 0.5566667 |
| pleasant | IBAL | menyenangkan | 0.5634921 | 0.5000000 | 0.6333333 |
| pleasant | NCON | menyenangkan | 0.4436508 | 0.4075758 | 0.4833333 |
| pleasant | ORTH | menyenangkan | 0.6126984 | 0.5939394 | 0.6333333 |
| pleasant | UNDR | menyenangkan | 0.9095238 | 0.9181818 | 0.9000000 |
| uneventful | ANTO | tidak meriah | 0.6682540 | 0.6606061 | 0.6766667 |
| uneventful | APPR | tidak meriah | 0.7126984 | 0.6909091 | 0.7366667 |
| uneventful | CLAR | tidak meriah | 0.5785714 | 0.5318182 | 0.6300000 |
| uneventful | IBAL | tidak meriah | 0.6841270 | 0.6848485 | 0.6833333 |
| uneventful | NCON | tidak meriah | 0.5134921 | 0.4969697 | 0.5316667 |
| uneventful | ORTH | tidak meriah | 0.6952381 | 0.7030303 | 0.6866667 |
| uneventful | UNDR | tidak meriah | 0.9015873 | 0.8848485 | 0.9200000 |
| vibrant | APPR | bersemarak | 0.7904762 | 0.8333333 | 0.7433333 |
| vibrant | APPR | rancak | 0.7222222 | 0.7363636 | 0.7066667 |
| vibrant | CLAR | bersemarak | 0.4555556 | 0.4075758 | 0.5083333 |
| vibrant | CLAR | rancak | 0.4753968 | 0.4469697 | 0.5066667 |
| vibrant | CONN | bersemarak | 0.6230159 | 0.6378788 | 0.6066667 |
| vibrant | CONN | rancak | 0.6071429 | 0.6530303 | 0.5566667 |
| vibrant | IBAL | bersemarak | 0.7444444 | 0.7303030 | 0.7600000 |
| vibrant | IBAL | rancak | 0.7158730 | 0.7484848 | 0.6800000 |
| vibrant | UNDR | bersemarak | 0.6888889 | 0.6454545 | 0.7366667 |
| vibrant | UNDR | rancak | 0.7968254 | 0.7454545 | 0.8533333 |
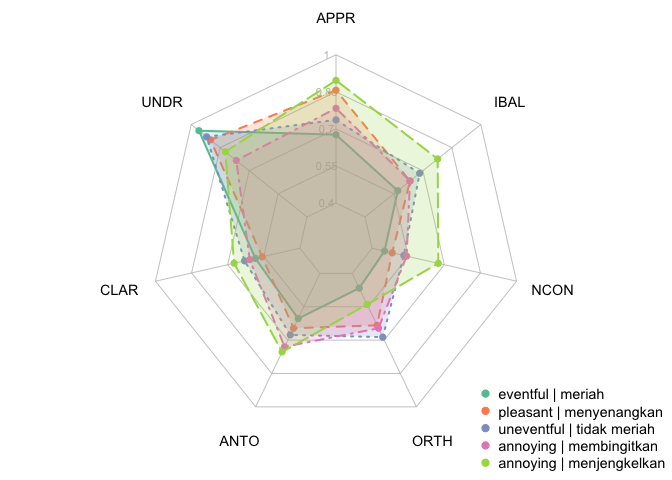
#Plot mean scores in a radar chart

mainAXisradardf <- rbind(
  data.frame(rbind(rep(1,7),rep(0.4,7))) %>%
    setNames(c("APPR","UNDR","CLAR","ANTO","ORTH","NCON","IBAL")) %>%
    `rownames<-`(c("Max","Min")),
  mainAxCOMBmean %>% select(APPR:IBAL) %>%
    `rownames<-`(mainAxCOMBmean$CANDIDATE))

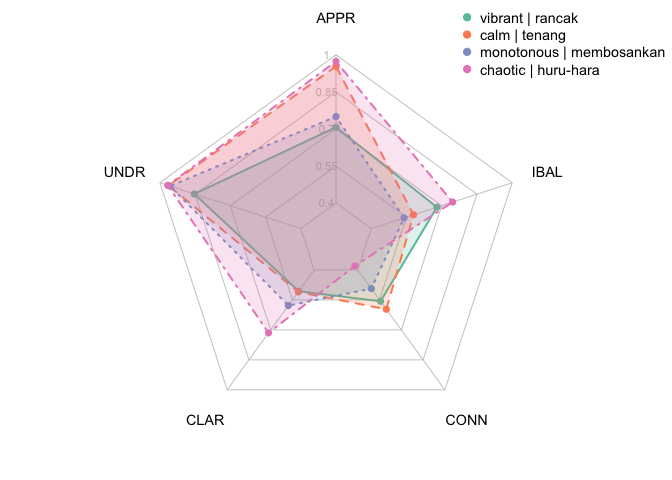
derAXisradardf <- rbind(
  data.frame(rbind(rep(1,5),rep(0.4,5))) %>%
    setNames(c("APPR","UNDR","CLAR","CONN","IBAL")) %>%
    `rownames<-`(c("Max","Min")),
  derAxCOMBmean %>% filter(!grepl('kurang|bersemarak|berubah|kelam|menenangkan', CANDIDATE)) %>% select(APPR:IBAL) %>% `rownames<-`(derAxCOMBmean %>% filter(!grepl('kurang|bersemarak|berubah|kelam|menenangkan', CANDIDATE)) %>% .$CANDIDATE))

#define color palette
set2 <- RColorBrewer::brewer.pal(7, "Set2")

#Main Axis
op1 <- par(mar = c(0, 0, 0, 0))
create_beautiful_radarchart(mainAXisradardf,
                            #caxislabels = c(0, 0.25, 0.5, 0.75, 1),
                            caxislabels = c(0.4, 0.55, 0.7, 0.85, 1),
                            color = set2,
                            vlcex = .9,calcex=.7,
                            plty=c(1,2,3,4,5,6,7))

# Add an horizontal legend
legend(
  x = "bottomright",
  legend = paste(c("eventful |","pleasant |","uneventful |",
                    "annoying |","annoying |"),
                  row.names(mainAXisradardf)[-c(2,1)]),
  horiz = FALSE,
  bty = "n", pch = 20 , col = set2,
  text.col = "black", cex = .9, pt.cex = 1.5
)par(op1)
#Derived Axis
op2 <- par(mar = c(0, 0, 0, 0))
create_beautiful_radarchart(derAXisradardf,
#caxislabels = c(0, 0.25, 0.5, 0.75, 1),
caxislabels = c(0.4, 0.55, 0.7, 0.85, 1),
color = set2,
vlcex = .9,calcex=.7,
plty=c(1,2,3,4,5,6,7))
# Add an horizontal legend
legend(
x = "topright",
legend = paste(c("vibrant |","calm |","monotonous |",
"chaotic |"),
row.names(derAXisradardf)[-c(2,1)]),
horiz = FALSE,
bty = "n", pch = 20 , col = set2,
text.col = "black", cex = .9, pt.cex = 1.5
)par(op2)#Plot mean scores in a radar chart
mainAXisradardf.sg <- rbind(
data.frame(rbind(rep(1,7),rep(0.4,7))) %>%
setNames(c("APPR","UNDR","CLAR","ANTO","ORTH","NCON","IBAL")) %>%
`rownames<-`(c("Max","Min")),
mainAxSPLITmean %>% filter(COUNTRY=="SG") %>% select(APPR:IBAL) %>%
`rownames<-`(mainAxCOMBmean$CANDIDATE))
mainAXisradardf.my <- rbind(
data.frame(rbind(rep(1,7),rep(0.4,7))) %>%
setNames(c("APPR","UNDR","CLAR","ANTO","ORTH","NCON","IBAL")) %>%
`rownames<-`(c("Max","Min")),
mainAxSPLITmean %>% filter(COUNTRY=="MY") %>% select(APPR:IBAL) %>%
`rownames<-`(mainAxCOMBmean$CANDIDATE))
derAXisradardf.sg <- rbind(
data.frame(rbind(rep(1,5),rep(0.4,5))) %>%
setNames(c("APPR","UNDR","CLAR","CONN","IBAL")) %>%
`rownames<-`(c("Max","Min")),
derAxSPLITmean %>% filter(COUNTRY=="SG") %>%
filter(!grepl('kurang|bersemarak|berubah|kelam|menenangkan', CANDIDATE)) %>%
select(APPR:IBAL) %>%
`rownames<-`(derAxCOMBmean %>%
filter(!grepl('kurang|bersemarak|berubah|kelam|menenangkan', CANDIDATE)) %>%
.$CANDIDATE))
derAXisradardf.my <- rbind(
data.frame(rbind(rep(1,5),rep(0.4,5))) %>%
setNames(c("APPR","UNDR","CLAR","CONN","IBAL")) %>%
`rownames<-`(c("Max","Min")),
derAxSPLITmean %>% filter(COUNTRY=="MY") %>%
filter(!grepl('kurang|bersemarak|berubah|kelam|menenangkan', CANDIDATE)) %>%
select(APPR:IBAL) %>%
`rownames<-`(derAxCOMBmean %>%
filter(!grepl('kurang|bersemarak|berubah|kelam|menenangkan', CANDIDATE)) %>%
.$CANDIDATE))
#define color palette
set2 <- RColorBrewer::brewer.pal(7, "Set2")
#Main Axis
op.main.sg <- par(mar = c(0, 0, 0, 0))
create_beautiful_radarchart(mainAXisradardf.sg,
#caxislabels = c(0, 0.25, 0.5, 0.75, 1),
caxislabels = c(0.4, 0.55, 0.7, 0.85, 1),
color = set2,
vlcex = .9,calcex=.7,
plty=c(1,2,3,4,5,6,7))
# Add an horizontal legend
legend(
x = "bottomright",
legend = paste(c("eventful |","pleasant |","uneventful |",
"annoying |","annoying |"),
row.names(mainAXisradardf.sg)[-c(2,1)]),
horiz = FALSE,
bty = "n", pch = 20 , col = set2,
text.col = "black", cex = .9, pt.cex = 1.5
)par(op.main.sg)
#Derived Axis
op.der.sg <- par(mar = c(0, 0, 0, 0))
create_beautiful_radarchart(derAXisradardf.sg,
#caxislabels = c(0, 0.25, 0.5, 0.75, 1),
caxislabels = c(0.4, 0.55, 0.7, 0.85, 1),
color = set2,
vlcex = .9,calcex=.7,
plty=c(1,2,3,4,5,6,7))
# Add an horizontal legend
legend(
x = "topright",
legend = paste(c("vibrant |","calm |","monotonous |",
"chaotic |"),
row.names(derAXisradardf.sg)[-c(2,1)]),
horiz = FALSE,
bty = "n", pch = 20 , col = set2,
text.col = "black", cex = .9, pt.cex = 1.5
)par(op.der.sg)
#Main Axis
op.main.my <- par(mar = c(0, 0, 0, 0))
create_beautiful_radarchart(mainAXisradardf.my,
#caxislabels = c(0, 0.25, 0.5, 0.75, 1),
caxislabels = c(0.4, 0.55, 0.7, 0.85, 1),
color = set2,
vlcex = .9,calcex=.7,
plty=c(1,2,3,4,5,6,7))
# Add an horizontal legend
legend(
x = "bottomright",
legend = paste(c("eventful |","pleasant |","uneventful |",
"annoying |","annoying |"),
row.names(mainAXisradardf.my)[-c(2,1)]),
horiz = FALSE,
bty = "n", pch = 20 , col = set2,
text.col = "black", cex = .9, pt.cex = 1.5
)par(op.main.my)
#Derived Axis
op.der.my <- par(mar = c(0, 0, 0, 0))
create_beautiful_radarchart(derAXisradardf.my,
#caxislabels = c(0, 0.25, 0.5, 0.75, 1),
caxislabels = c(0.4, 0.55, 0.7, 0.85, 1),
color = set2,
vlcex = .9,calcex=.7,
plty=c(1,2,3,4,5,6,7))
# Add an horizontal legend
legend(
x = "topright",
legend = paste(c("vibrant |","calm |","monotonous |",
"chaotic |"),
row.names(derAXisradardf.my)[-c(2,1)]),
horiz = FALSE,
bty = "n", pch = 20 , col = set2,
text.col = "black", cex = .9, pt.cex = 1.5
)par(op.der.my)Due to differences in sample size, Kruskal-Wallis test was adopted to examine the statistical differences between SG and MY populations for PAQ attributes with only a single translation candidate, i.e. eventful, uneventful, and pleasant.
#KWT for solo translation candidates
kwtSolo<-rbind(kwTest(eventformdf,type = "main", ivar = "COUNTRY") %>% mutate(PAQ="eventful"),
               kwTest(uneventformdf,type = "main", ivar = "COUNTRY") %>% mutate(PAQ="uneventful"),
               kwTest(pleasformdf,type = "main", ivar = "COUNTRY") %>% mutate(PAQ="pleasant"))

#Display KWT results
kwtSolo %>%
        group_by(PAQ,CRITERION) %>%
        mutate(pvalue=as.numeric(pvalue),
               effect=as.numeric(effect)) %>%
        kbl(caption = "Kruskal-Wallis p-value and effect sizes for eventful, uneventful, and pleasant",
            digits = 3, booktabs=T) %>%
kable_classic(full_width = F, html_font = "Cambria")| CRITERION | pvalue | effect | PAQ |
|---|---|---|---|
| APPR | 0.588 | -0.012 | eventful |
| UNDR | 0.041 | 0.052 | eventful |
| CLAR | 0.092 | 0.030 | eventful |
| IBAL | 0.288 | 0.002 | eventful |
| ANTO | 0.383 | -0.004 | eventful |
| ORTH | 0.196 | 0.011 | eventful |
| NCON | 0.065 | 0.039 | eventful |
| APPR | 0.409 | -0.005 | uneventful |
| UNDR | 0.116 | 0.024 | uneventful |
| CLAR | 0.157 | 0.016 | uneventful |
| IBAL | 0.956 | -0.016 | uneventful |
| ANTO | 0.702 | -0.014 | uneventful |
| ORTH | 0.691 | -0.014 | uneventful |
| NCON | 0.499 | -0.009 | uneventful |
| APPR | 0.352 | -0.002 | pleasant |
| UNDR | 0.822 | -0.016 | pleasant |
| CLAR | 0.178 | 0.013 | pleasant |
| IBAL | 0.089 | 0.031 | pleasant |
| ANTO | 0.656 | -0.013 | pleasant |
| ORTH | 0.581 | -0.011 | pleasant |
| NCON | 0.051 | 0.046 | pleasant |
With multiple translation candidates, the data takes the form of a replicated, unbalanced completed block design. The Prentice test (PT), a generalised form of the Friedman test was adopted to evaluate the differences between the candidates (blocks) as well as the influence of country of residence (groups).
For differences detected at 5% significance level, a post-hoc Mann-Whitney-Wilcoxon rank sum test (MWWT) with Bonferroni correction was conducted for relevant pairs.
#generate p-values and effect size with prentice test
pt<-rbind(cbind(PAQ="annoying",prenticeTest(annoyformdf,type="main")),
          cbind(PAQ="vibrant",prenticeTest(vibrantformdf,"derived")),
          cbind(PAQ="calm",prenticeTest(calmformdf,"derived")),
          cbind(PAQ="monotonous",prenticeTest(monotformdf,"derived")),
          cbind(PAQ="chaotic",prenticeTest(chaoticformdf,"derived"))) %>%
  cbind(TEST="PT",.)

pt %>%
        group_by(PAQ,CRITERION) %>%
        mutate(pvalue=as.numeric(pvalue)) %>%
        kbl(caption = "Prentice test p-value for annoying, vibrant, calm, monotonous, chaotic",
            digits = 3, booktabs=T) %>%
kable_classic(full_width = F, html_font = "Cambria")| TEST | PAQ | CRITERION | pvalue |
|---|---|---|---|
| PT | annoying | APPR | 0.225 |
| PT | annoying | UNDR | 0.034 |
| PT | annoying | CLAR | 0.784 |
| PT | annoying | IBAL | 0.105 |
| PT | annoying | ANTO | 0.302 |
| PT | annoying | ORTH | 0.296 |
| PT | annoying | NCON | 0.872 |
| PT | vibrant | APPR | 0.251 |
| PT | vibrant | UNDR | 0.054 |
| PT | vibrant | CLAR | 0.037 |
| PT | vibrant | IBAL | 0.897 |
| PT | vibrant | CONN | 0.086 |
| PT | calm | APPR | 0.212 |
| PT | calm | UNDR | 0.243 |
| PT | calm | CLAR | 0.324 |
| PT | calm | IBAL | 0.512 |
| PT | calm | CONN | 0.026 |
| PT | monotonous | APPR | 0.577 |
| PT | monotonous | UNDR | 0.979 |
| PT | monotonous | CLAR | 0.714 |
| PT | monotonous | IBAL | 0.057 |
| PT | monotonous | CONN | 0.424 |
| PT | chaotic | APPR | 0.007 |
| PT | chaotic | UNDR | 0.153 |
| PT | chaotic | CLAR | 0.007 |
| PT | chaotic | IBAL | 0.210 |
| PT | chaotic | CONN | 0.011 |
#MWW Rank Sum Test

#identify which PAQ attribute and its respective criterion are < 5% significance level
pt_sig <- pt %>%
        filter(pvalue<0.05)
pt_sig %>% select(c(PAQ,CRITERION)) %>%
        kbl(caption = "PAQ attributes and criterions with p < 0,05",
            booktabs=T) %>%
kable_classic(full_width = F, html_font = "Cambria")| PAQ | CRITERION |
|---|---|
| annoying | UNDR |
| vibrant | CLAR |
| calm | CONN |
| chaotic | APPR |
| chaotic | CLAR |
| chaotic | CONN |
#Annoying
#unqiue criterion <5%
annoyCrit<-pt_sig %>% filter(PAQ=="annoying") %>%
               select(CRITERION) %>% unique(.) %>% .$CRITERION

annoySIG<-annoyformdf %>% select(c(COUNTRY,annoyCrit, CANDIDATE,))

#calm
#unique criterion <5%
calmCrit<-pt_sig %>% filter(PAQ=="calm") %>%
               select(CRITERION) %>% unique(.) %>% .$CRITERION

calmSIG<-calmformdf %>% select(c(COUNTRY,calmCrit, CANDIDATE,))

#monotonous
#unique criterion <5%
monotCrit<-pt_sig %>% filter(PAQ=="monotonous") %>%
               select(CRITERION) %>% unique(.) %>% .$CRITERION

monotSIG<-monotformdf %>% select(c(COUNTRY,monotCrit, CANDIDATE,))

#chaotic
#unique criterion <5%
chaoticCrit<-pt_sig %>% filter(PAQ=="chaotic") %>%
               select(CRITERION) %>% unique(.) %>% .$CRITERION

chaoticSIG<-chaoticformdf %>% select(c(COUNTRY,chaoticCrit, CANDIDATE,))

#combine MWWT results for all PAQ attributes
mwwtResults <- rbind(mwwTest(df=annoySIG, criterion=annoyCrit, PAQ="annoying"),
                     mwwTest(df=calmSIG, criterion=calmCrit, PAQ="calm"),
                     mwwTest(df=monotSIG, criterion=monotCrit, PAQ="monotonous"),
                     mwwTest(df=chaoticSIG, criterion=chaoticCrit, PAQ="chaotic"))

mwwtResults %>%
        kbl(caption = "Mann-Whitney-Wilcoxon test results",
            booktabs=T, digits = 3) %>%
kable_classic(full_width = F, html_font = "Cambria")| PAQ | CRITERION | CANDIDATE | pvalue | adjval |
|---|---|---|---|---|
| annoying | UNDR | membingitkan | 0.859 | 1.000 |
| annoying | UNDR | menjengkelkan | 0.002 | 0.003 |
| calm | CONN | tenang | 0.385 | 0.771 |
| calm | CONN | menenangkan | 0.024 | 0.048 |
| chaotic | APPR | huru-hara | 0.192 | 0.384 |
| chaotic | APPR | kelam-kabut | 0.016 | 0.032 |
| chaotic | CLAR | huru-hara | 0.003 | 0.006 |
| chaotic | CLAR | kelam-kabut | 0.381 | 0.762 |
| chaotic | CONN | huru-hara | 0.022 | 0.043 |
| chaotic | CONN | kelam-kabut | 0.202 | 0.404 |
The Kruskal-Wallis test was employed to examine whether there are differences between translation candidates within each country (i.e. SG or MY).
A pairwise posthoc Conover-Iman test was conducted when significant differences were found at 5% significance levels.
#SG
intrakwt_SG <- rbind(annoyformdf %>% filter(COUNTRY=="SG") %>%
        kwTest(df = .,type = "main",ivar = "CANDIDATE") %>%
        mutate(PAQ="annoying"),
        vibrantformdf %>% filter(COUNTRY=="SG") %>%
        kwTest(df = .,type = "derived",ivar = "CANDIDATE") %>%
        mutate(PAQ="vibrant"),
        calmformdf %>% filter(COUNTRY=="SG") %>%
        kwTest(df = .,type = "derived",ivar = "CANDIDATE") %>%
        mutate(PAQ="calm"),
        monotformdf %>% filter(COUNTRY=="SG") %>%
        kwTest(df = .,type = "derived",ivar = "CANDIDATE") %>%
        mutate(PAQ="monotonous"),
        chaoticformdf %>% filter(COUNTRY=="SG") %>%
        kwTest(df = .,type = "derived",ivar = "CANDIDATE") %>%
        mutate(PAQ="chaotic")) %>% mutate(COUNTRY="SG")

intrakwt_SG %>%
        mutate(pvalue=as.numeric(pvalue),effect=as.numeric(effect)) %>%
        kbl(caption = "Intra-country Kruskal-Wallis Test in SG",
            booktabs=T, digits = 3) %>%
kable_classic(full_width = F, html_font = "Cambria")| CRITERION | pvalue | effect | PAQ | COUNTRY |
|---|---|---|---|---|
| APPR | 0.757 | -0.014 | annoying | SG |
| UNDR | 0.009 | 0.091 | annoying | SG |
| CLAR | 0.455 | -0.007 | annoying | SG |
| IBAL | 0.003 | 0.118 | annoying | SG |
| ANTO | 0.979 | -0.016 | annoying | SG |
| ORTH | 0.803 | -0.015 | annoying | SG |
| NCON | 0.315 | 0.000 | annoying | SG |
| APPR | 0.314 | 0.000 | vibrant | SG |
| UNDR | 0.146 | 0.017 | vibrant | SG |
| CLAR | 0.545 | -0.010 | vibrant | SG |
| IBAL | 0.875 | -0.015 | vibrant | SG |
| CONN | 0.969 | -0.016 | vibrant | SG |
| APPR | 0.000 | 0.180 | calm | SG |
| UNDR | 0.000 | 0.199 | calm | SG |
| CLAR | 0.231 | 0.007 | calm | SG |
| IBAL | 0.531 | -0.009 | calm | SG |
| CONN | 0.908 | -0.015 | calm | SG |
| APPR | 0.312 | 0.003 | monotonous | SG |
| UNDR | 0.003 | 0.098 | monotonous | SG |
| CLAR | 0.889 | -0.018 | monotonous | SG |
| IBAL | 0.761 | -0.015 | monotonous | SG |
| CONN | 0.831 | -0.017 | monotonous | SG |
| APPR | 0.000 | 0.179 | chaotic | SG |
| UNDR | 0.884 | -0.015 | chaotic | SG |
| CLAR | 0.085 | 0.031 | chaotic | SG |
| IBAL | 0.770 | -0.014 | chaotic | SG |
| CONN | 0.181 | 0.012 | chaotic | SG |
#MY
intrakwt_MY <- rbind(annoyformdf %>% filter(COUNTRY=="MY") %>%
        kwTest(df = .,type = "main",ivar = "CANDIDATE") %>%
        mutate(PAQ="annoying"),
        vibrantformdf %>% filter(COUNTRY=="MY") %>%
        kwTest(df = .,type = "derived",ivar = "CANDIDATE") %>%
        mutate(PAQ="vibrant"),
        calmformdf %>% filter(COUNTRY=="MY") %>%
        kwTest(df = .,type = "derived",ivar = "CANDIDATE") %>%
        mutate(PAQ="calm"),
        monotformdf %>% filter(COUNTRY=="MY") %>%
        kwTest(df = .,type = "derived",ivar = "CANDIDATE") %>%
        mutate(PAQ="monotonous"),
        chaoticformdf %>% filter(COUNTRY=="MY") %>%
        kwTest(df = .,type = "derived",ivar = "CANDIDATE") %>%
        mutate(PAQ="chaotic")) %>% mutate(COUNTRY="MY")

intrakwt_MY %>%
        mutate(pvalue=as.numeric(pvalue),effect=as.numeric(effect)) %>%
        kbl(caption = "Intra-country Kruskal-Wallis Test in MY",
            booktabs=T, digits = 3) %>%
kable_classic(full_width = F, html_font = "Cambria")| CRITERION | pvalue | effect | PAQ | COUNTRY |
|---|---|---|---|---|
| APPR | 0.028 | 0.066 | annoying | MY |
| UNDR | 0.441 | -0.007 | annoying | MY |
| CLAR | 0.199 | 0.011 | annoying | MY |
| IBAL | 0.081 | 0.035 | annoying | MY |
| ANTO | 0.577 | -0.012 | annoying | MY |
| ORTH | 0.261 | 0.005 | annoying | MY |
| NCON | 0.026 | 0.068 | annoying | MY |
| APPR | 0.580 | -0.012 | vibrant | MY |
| UNDR | 0.028 | 0.067 | vibrant | MY |
| CLAR | 0.882 | -0.017 | vibrant | MY |
| IBAL | 0.311 | 0.000 | vibrant | MY |
| CONN | 0.278 | 0.003 | vibrant | MY |
| APPR | 0.001 | 0.171 | calm | MY |
| UNDR | 0.014 | 0.088 | calm | MY |
| CLAR | 0.846 | -0.017 | calm | MY |
| IBAL | 0.622 | -0.013 | calm | MY |
| CONN | 0.594 | -0.012 | calm | MY |
| APPR | 0.014 | 0.074 | monotonous | MY |
| UNDR | 0.000 | 0.180 | monotonous | MY |
| CLAR | 0.787 | -0.017 | monotonous | MY |
| IBAL | 0.409 | -0.002 | monotonous | MY |
| CONN | 0.469 | -0.006 | monotonous | MY |
| APPR | 0.007 | 0.106 | chaotic | MY |
| UNDR | 0.944 | -0.017 | chaotic | MY |
| CLAR | 0.737 | -0.015 | chaotic | MY |
| IBAL | 0.581 | -0.012 | chaotic | MY |
| CONN | 0.864 | -0.017 | chaotic | MY |
#CIT

#identify which PAQ attribute and its respective criterion are < 5% significance level
intrakwtSG_sig <- intrakwt_SG %>%
        filter(pvalue<0.05)
intrakwtSG_sig %>% select(c(PAQ,CRITERION)) %>%
        kbl(caption = "PAQ attributes and criterions in SG with p < 0,05",
            booktabs=T) %>%
kable_classic(full_width = F, html_font = "Cambria")| PAQ | CRITERION |
|---|---|
| annoying | UNDR |
| annoying | IBAL |
| calm | APPR |
| calm | UNDR |
| monotonous | UNDR |
| chaotic | APPR |
intrakwtMY_sig <- intrakwt_MY %>%
        filter(pvalue<0.05)
intrakwtMY_sig %>% select(c(PAQ,CRITERION)) %>%
        kbl(caption = "PAQ attributes and criterions in SG with p < 0,05",
            booktabs=T) %>%
kable_classic(full_width = F, html_font = "Cambria")| PAQ | CRITERION |
|---|---|
| annoying | APPR |
| annoying | NCON |
| vibrant | UNDR |
| calm | APPR |
| calm | UNDR |
| monotonous | APPR |
| monotonous | UNDR |
| chaotic | APPR |
#monotonous
#unique criterion <5%
monotCrit_SG<-intrakwtSG_sig %>% filter(PAQ=="monotonous") %>%
               select(CRITERION) %>% unique(.) %>% .$CRITERION

monotSIG_SG<-monotformdf %>% select(c(COUNTRY,monotCrit_SG, CANDIDATE))

monotCrit_MY<-intrakwtMY_sig %>% filter(PAQ=="monotonous") %>%
               select(CRITERION) %>% unique(.) %>% .$CRITERION

monotSIG_MY<-monotformdf %>% select(c(COUNTRY,monotCrit_MY, CANDIDATE))


#CIT for monotonous across SG and MY
citResults<-rbind(ciTest(df=monotSIG_SG,
                         criterion = monotCrit_SG,
                         PAQ="monotonous") %>% mutate(COUNTRY="SG"),
                  ciTest(df=monotSIG_MY,
                         criterion = monotCrit_MY,
                         PAQ="monotonous") %>% mutate(COUNTRY="MY"))
## [1] "UNDR"
##
## Comparison of x by group
## (Bonferroni)
## Col Mean-|
## Row Mean | kurang k membosan
## ---------+----------------------
## membosan | -4.086271
## | 0.0001*
## |
## tidak be | 1.344389 5.430660
## | 0.2707 0.0000*
##
## alpha = 0.05
## Reject Ho if p <= alpha/2
## [1] "APPR"
##
## Comparison of x by group
## (Bonferroni)
## Col Mean-|
## Row Mean | kurang k membosan
## ---------+----------------------
## membosan | -0.299452
## | 1.0000
## |
## tidak be | 2.467117 2.766570
## | 0.0218* 0.0094*
##
## alpha = 0.05
## Reject Ho if p <= alpha/2
## [1] "UNDR"
##
## Comparison of x by group
## (Bonferroni)
## Col Mean-|
## Row Mean | kurang k membosan
## ---------+----------------------
## membosan | -4.086271
## | 0.0001*
## |
## tidak be | 1.344389 5.430660
## | 0.2707 0.0000*
##
## alpha = 0.05
## Reject Ho if p <= alpha/2
#Plot CIT results
citResults %>%
        mutate(pvalue=as.numeric(pvalue),adjval=as.numeric(adjval)) %>%
        kbl(caption = "Conover-Iman test results",
            booktabs=T, digits = 4) %>%
kable_classic(full_width = F, html_font = "Cambria")| PAQ | CRITERION | comparisons | pvalue | adjval | COUNTRY |
|---|---|---|---|---|---|
| monotonous | UNDR | kurang kepelbagaian oleh itu membosankan - membosankan | 0.0000 | 0.0001 | SG |
| monotonous | UNDR | kurang kepelbagaian oleh itu membosankan - tidak berubah oleh itu membosankan | 0.0902 | 0.2707 | SG |
| monotonous | UNDR | membosankan - tidak berubah oleh itu membosankan | 0.0000 | 0.0000 | SG |
| monotonous | APPR | kurang kepelbagaian oleh itu membosankan - membosankan | 0.3825 | 1.0000 | MY |
| monotonous | APPR | kurang kepelbagaian oleh itu membosankan - tidak berubah oleh itu membosankan | 0.0073 | 0.0218 | MY |
| monotonous | APPR | membosankan - tidak berubah oleh itu membosankan | 0.0031 | 0.0094 | MY |
| monotonous | UNDR | kurang kepelbagaian oleh itu membosankan - membosankan | 0.0000 | 0.0001 | MY |
| monotonous | UNDR | kurang kepelbagaian oleh itu membosankan - tidak berubah oleh itu membosankan | 0.0902 | 0.2707 | MY |
| monotonous | UNDR | membosankan - tidak berubah oleh itu membosankan | 0.0000 | 0.0000 | MY |
