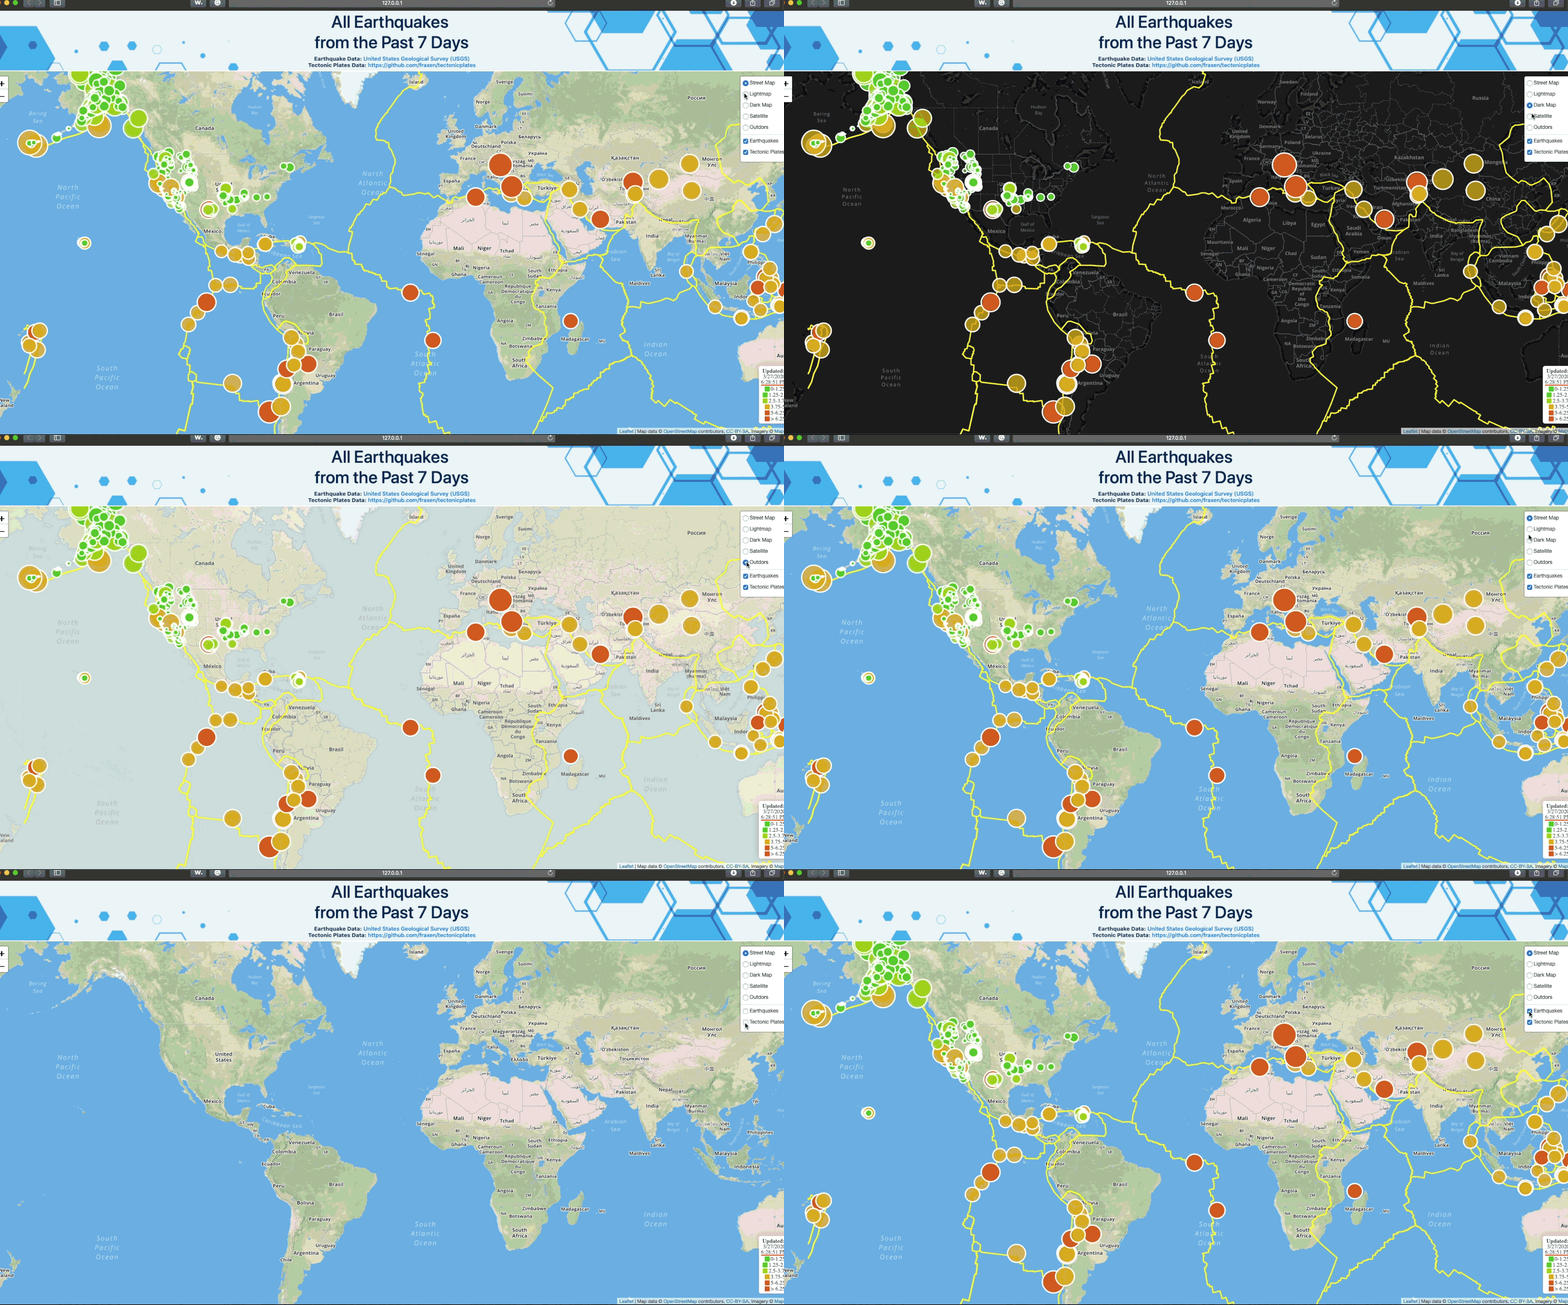
The goal of the project is to display multiple and interactive maps with the location and magnitude of earthquakes during the last 7 days around the world. The Javascript-Leaflet library, HTML, CSS, Bootstrap, and Javascript were used in the project. The Mapbox-API was also used to load the base maps. The project was divided into two steps with different levels of complexity.
-
Step 1: A single base layer and one set of data were used:
- Base layer: mapbox.streets-basic
- Data layer Source and Data:
-
Step 2: Multiple optional and interactive base layers were included. An additional dataset and plot were included and they can be activated and deactivated by the user.
- Base layer:
- Data layer Source and Data:
- Layer 1 Earthquake information
- Layer 2: Tectonic Plates
- D3 JavaScript
- Leaflet
- Step 1:
- Step 2:
- Download or clone all the files contained in this repo.
- Create a Mapbox Token
- Include your
Mapbox Tokenin the/Leaflet-Step-1/static/js/config.jsand/Leaflet-Step-2/static/js/config.jsfiles. - Run a python -m http.server or any other method for this purpose.
- Load the
Leaflet-Step-1/index.htmlandLeaflet-Step-2/index.htmlfiles.
- It contains all the files for the first part of the project.
- Contains the HTML code that drives the maps and references the required libraries
- It contains the
CSSfile with the formatting information - It contains the
jswith theJavascriptcode using the D3 library for the interactive plots.
- It contains the
gifandpngfiles with screenshots of the app running
- It contains all the files for the second part of the project.
- All folder are the same with this exception:
- It contains an additional folder that contains the
JSONfile with the tectonic-plate-boundaries information


