⚠️ I have developed a new python package pyGenomeViz that enables visualization of genome alignment by progressiveMauve. I recommend using that for now.
Automated genome alignment figure plot tool using progressiveMauve & genoPlotR.
Genome alignment figure is output from input genome sequence files.
Genbank or Fasta format genome sequence is available as input.

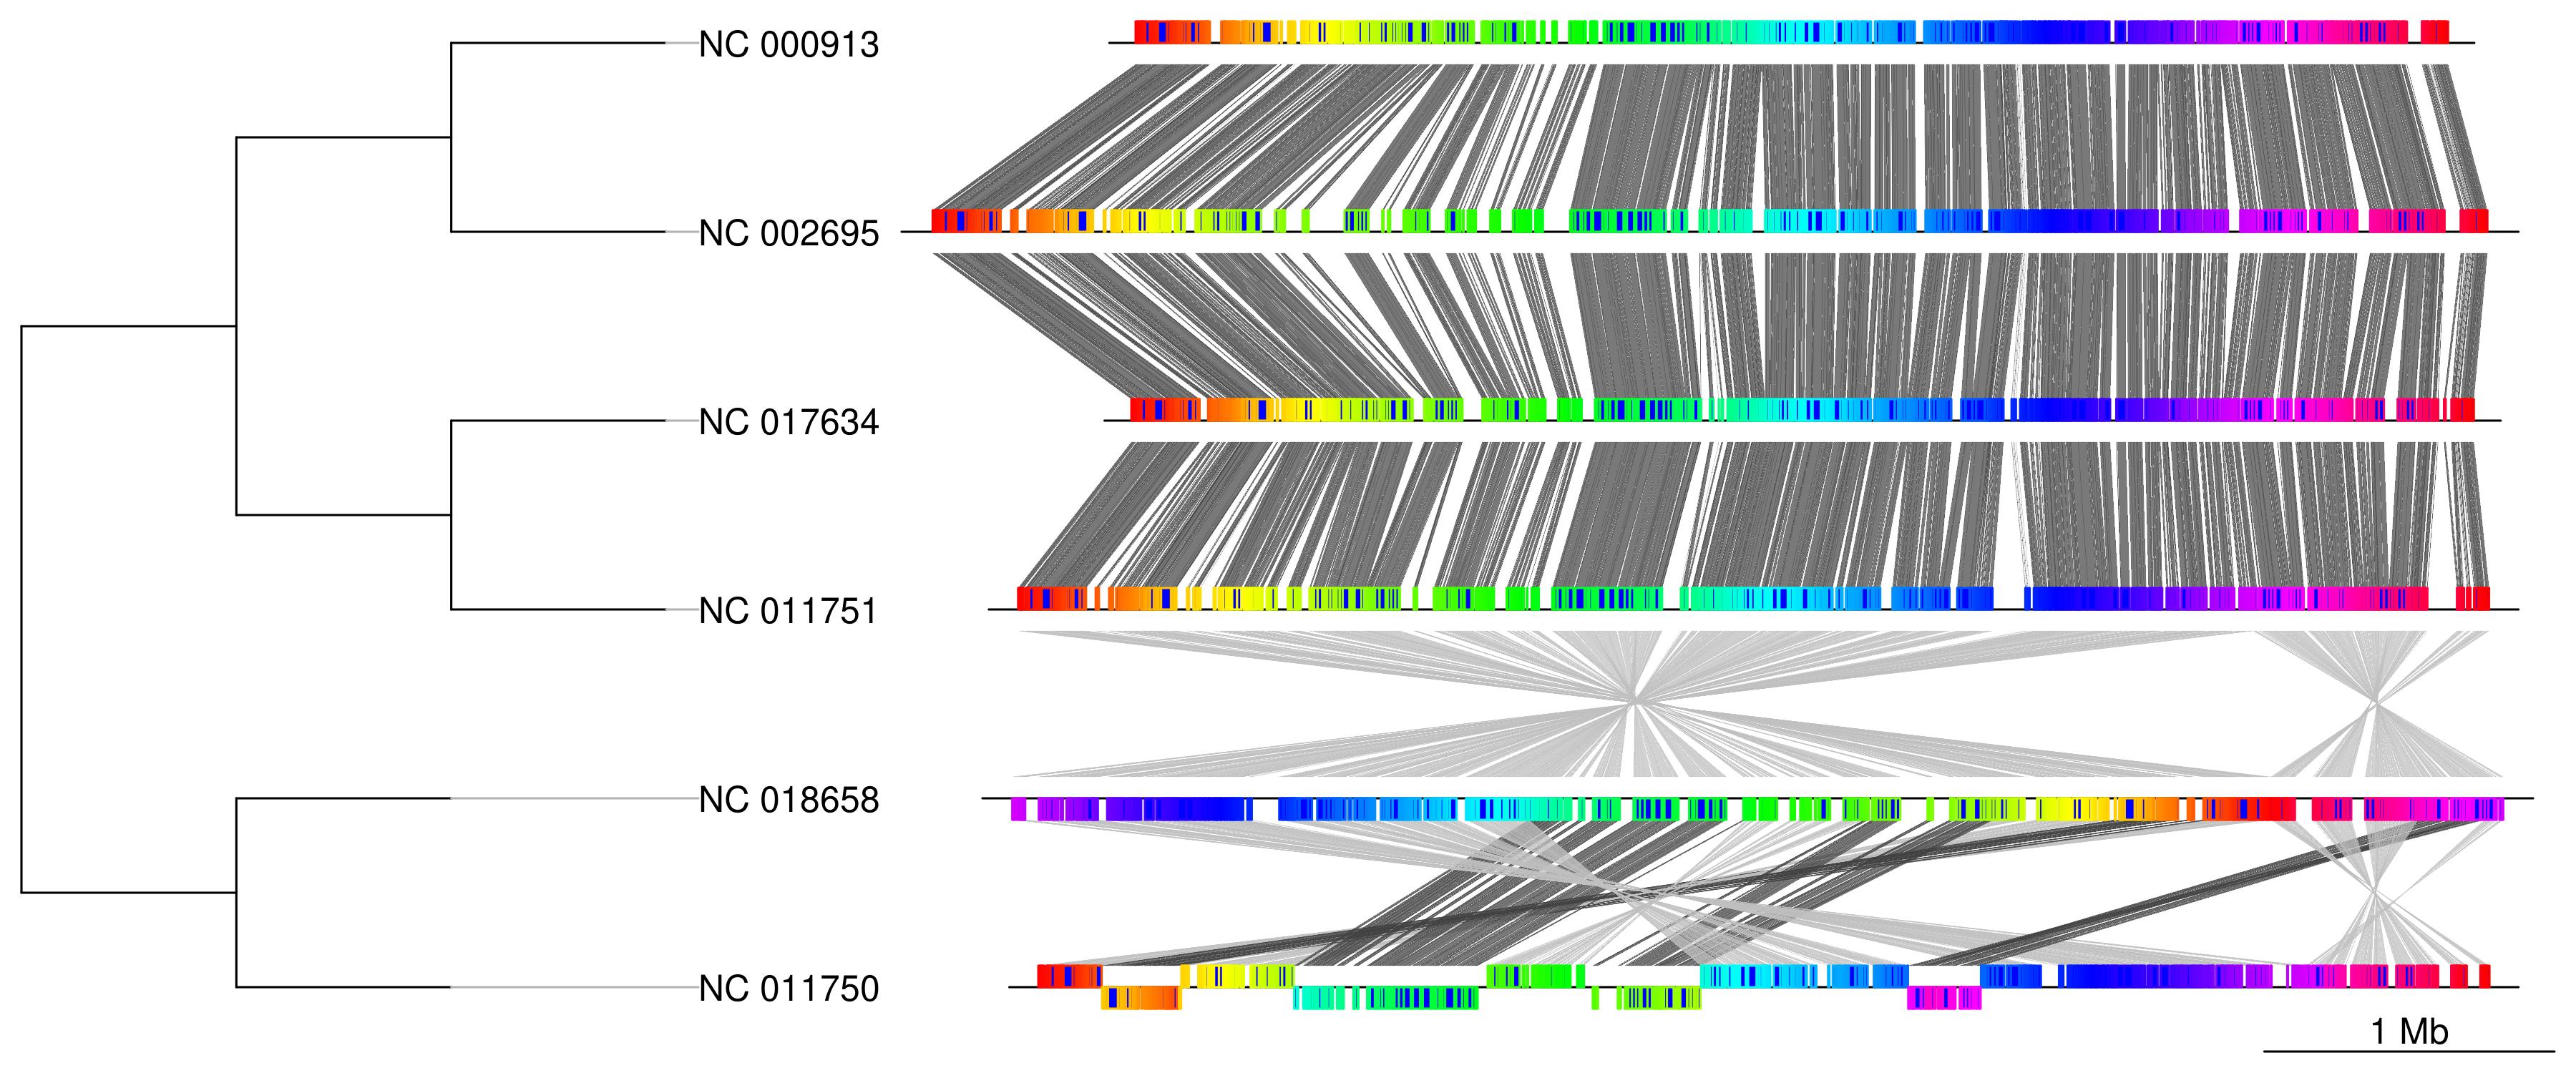
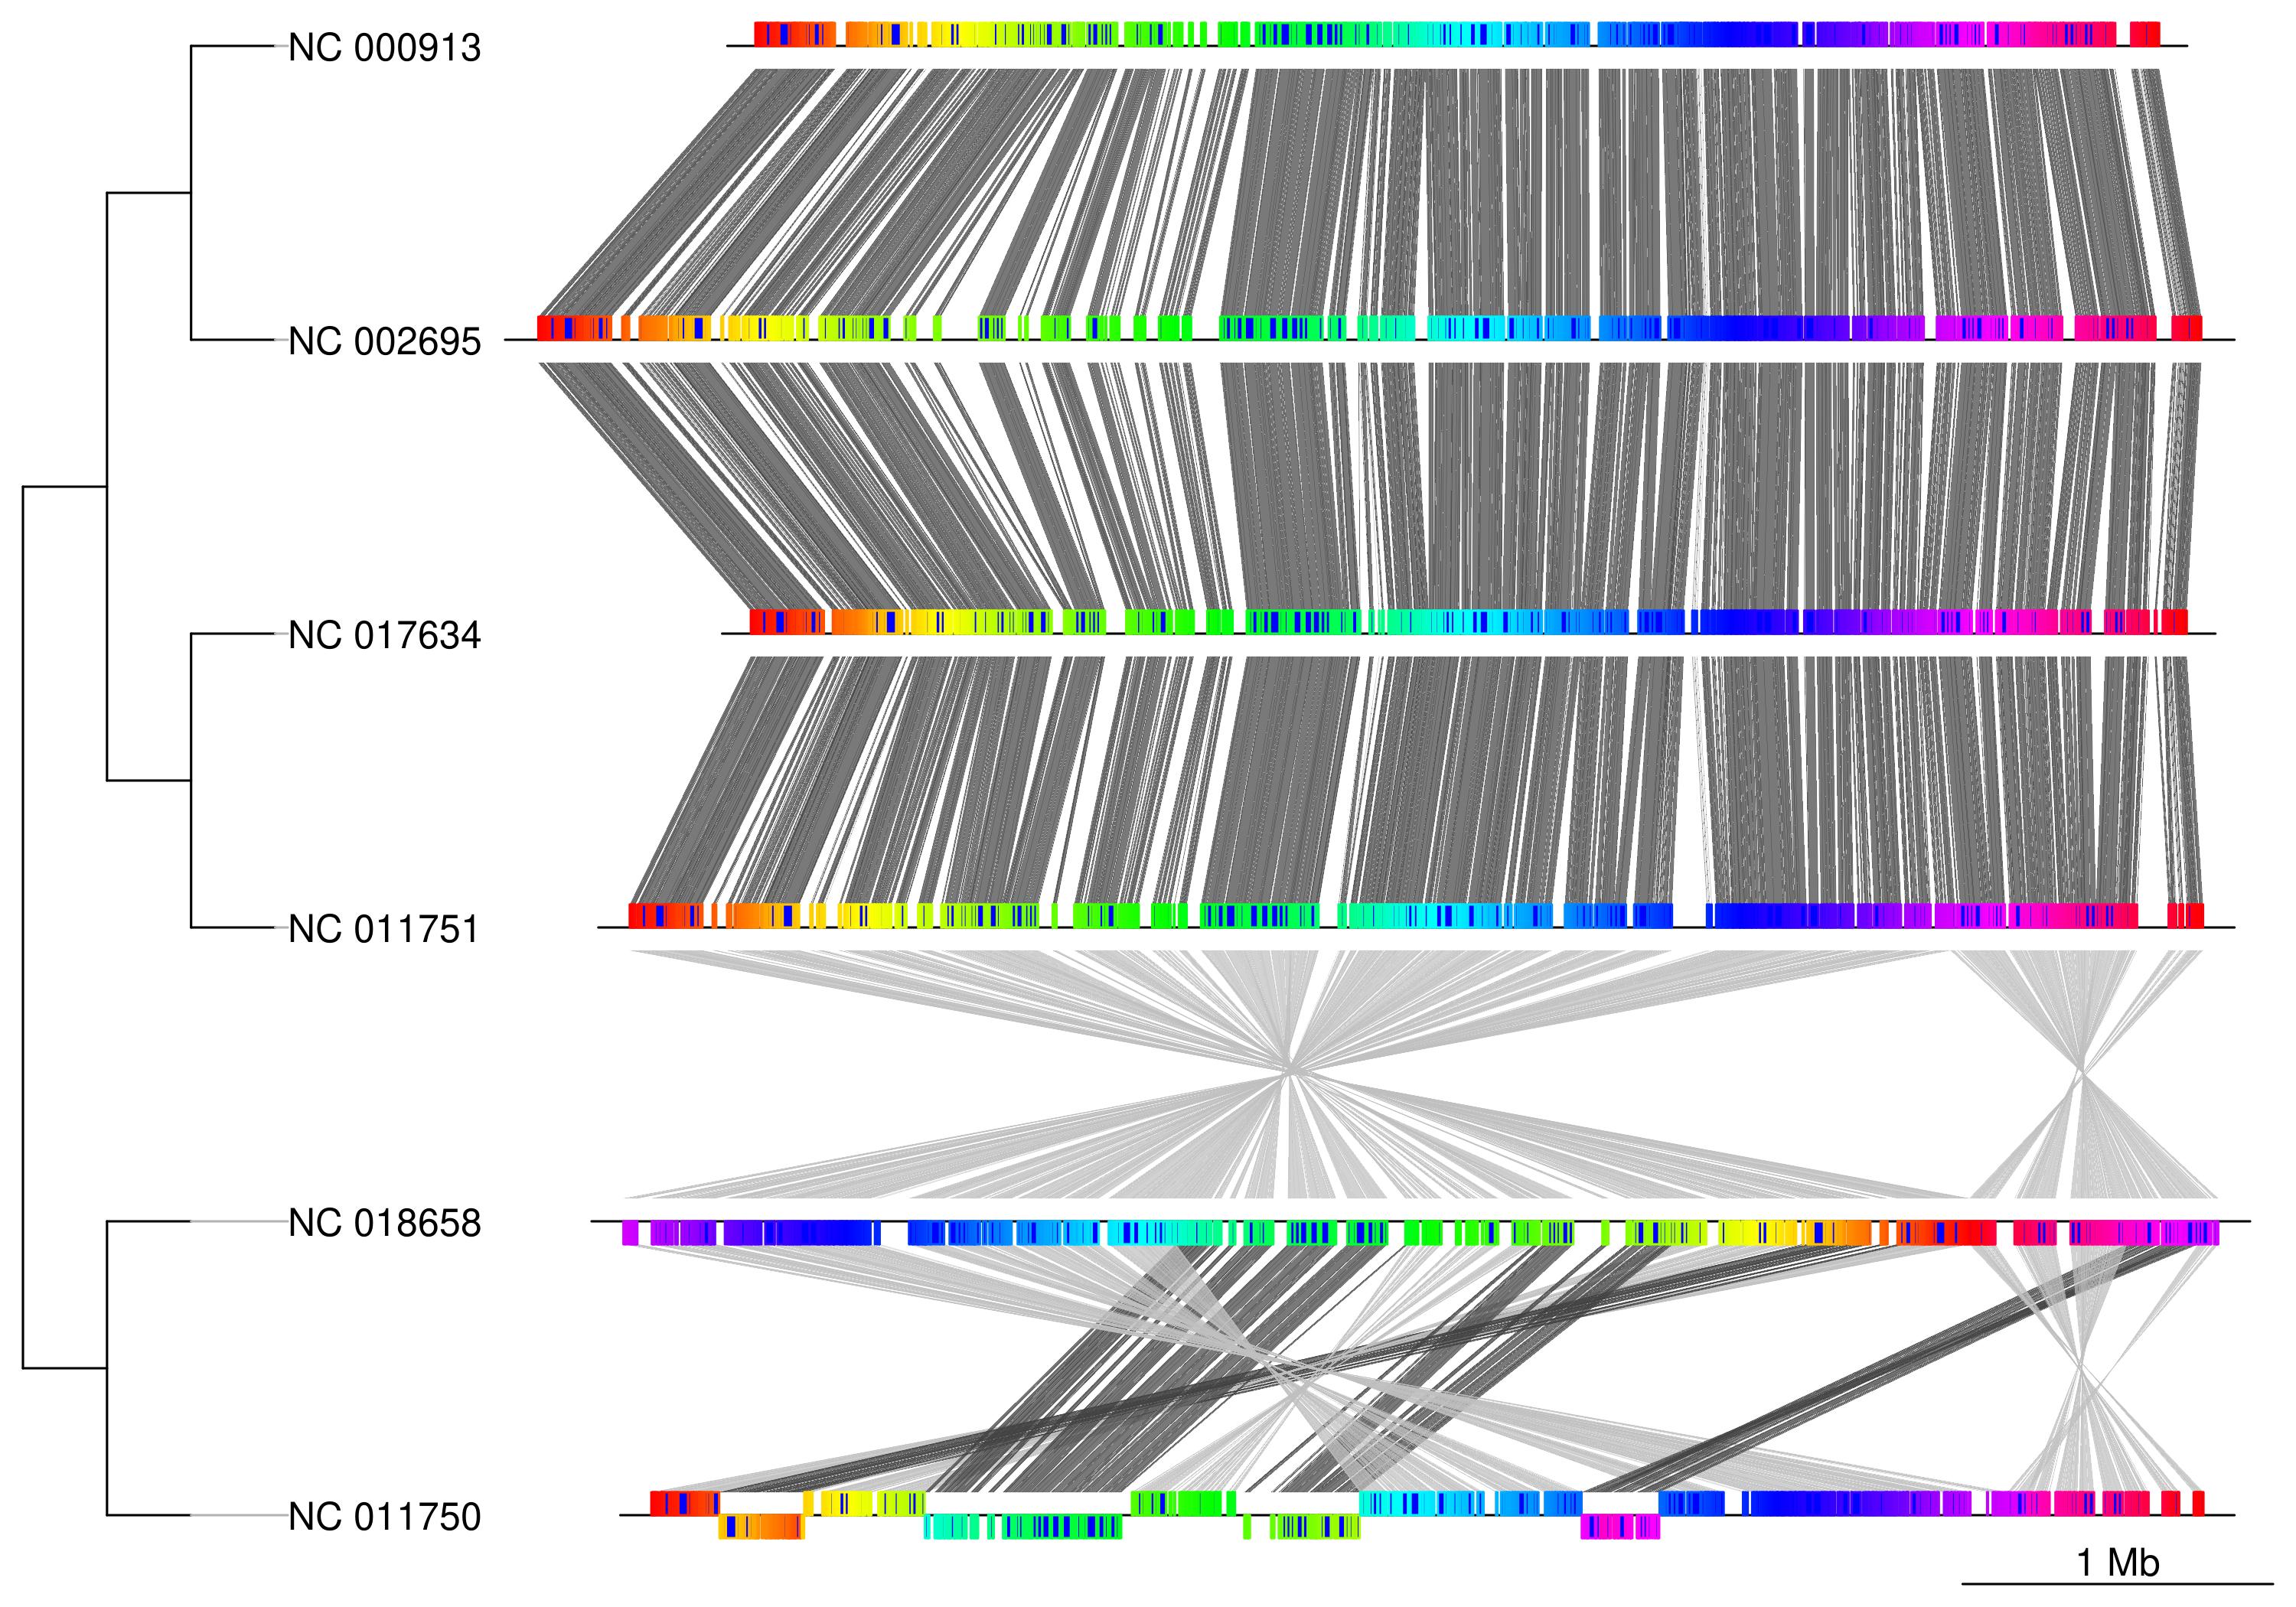
Fig. 6 E.coli genome alignment visualization result example
This tool is implemented in Python3 & R (Tested on Ubuntu20.04).
Following dependencies are required.
-
BioPython(Python library)pip install biopython -
genoPlotR,ape,ade4(R library)install.packages(c("genoPlotR", "ape", "ade4"), dependencies = TRUE) -
progressiveMauve(External binary)sudo apt install progressivemauve
python plot_genome_align_fig.py -i [genome_files_dir] -t [species_tree_file] -o [outdir]
-h, --help      show this help message and exit
-i , --indir    Input genome Genbank or Fasta files directory (*.gbk|*.fa)
-o , --outdir   Output directory
-t , --tree     Newick species tree file
--width         Plot width inch (Default: 10)
--height        Plot height inch (Default: 7)
--tree_width    Plot tree width inch (Default: 2)
⚠️ Input file name and input newick species tree leaf name must be match.
python plot_genome_align_fig.py -i example/ecoli/genbank -t example/ecoli/ecoli.nwk -o ecoli_plot1
Change width, height, tree_width parameters.
python plot_genome_align_fig.py -i example/ecoli/fasta -t example/ecoli/ecoli.nwk -o ecoli_plot2 --width 12 --height 5 --tree_width 4
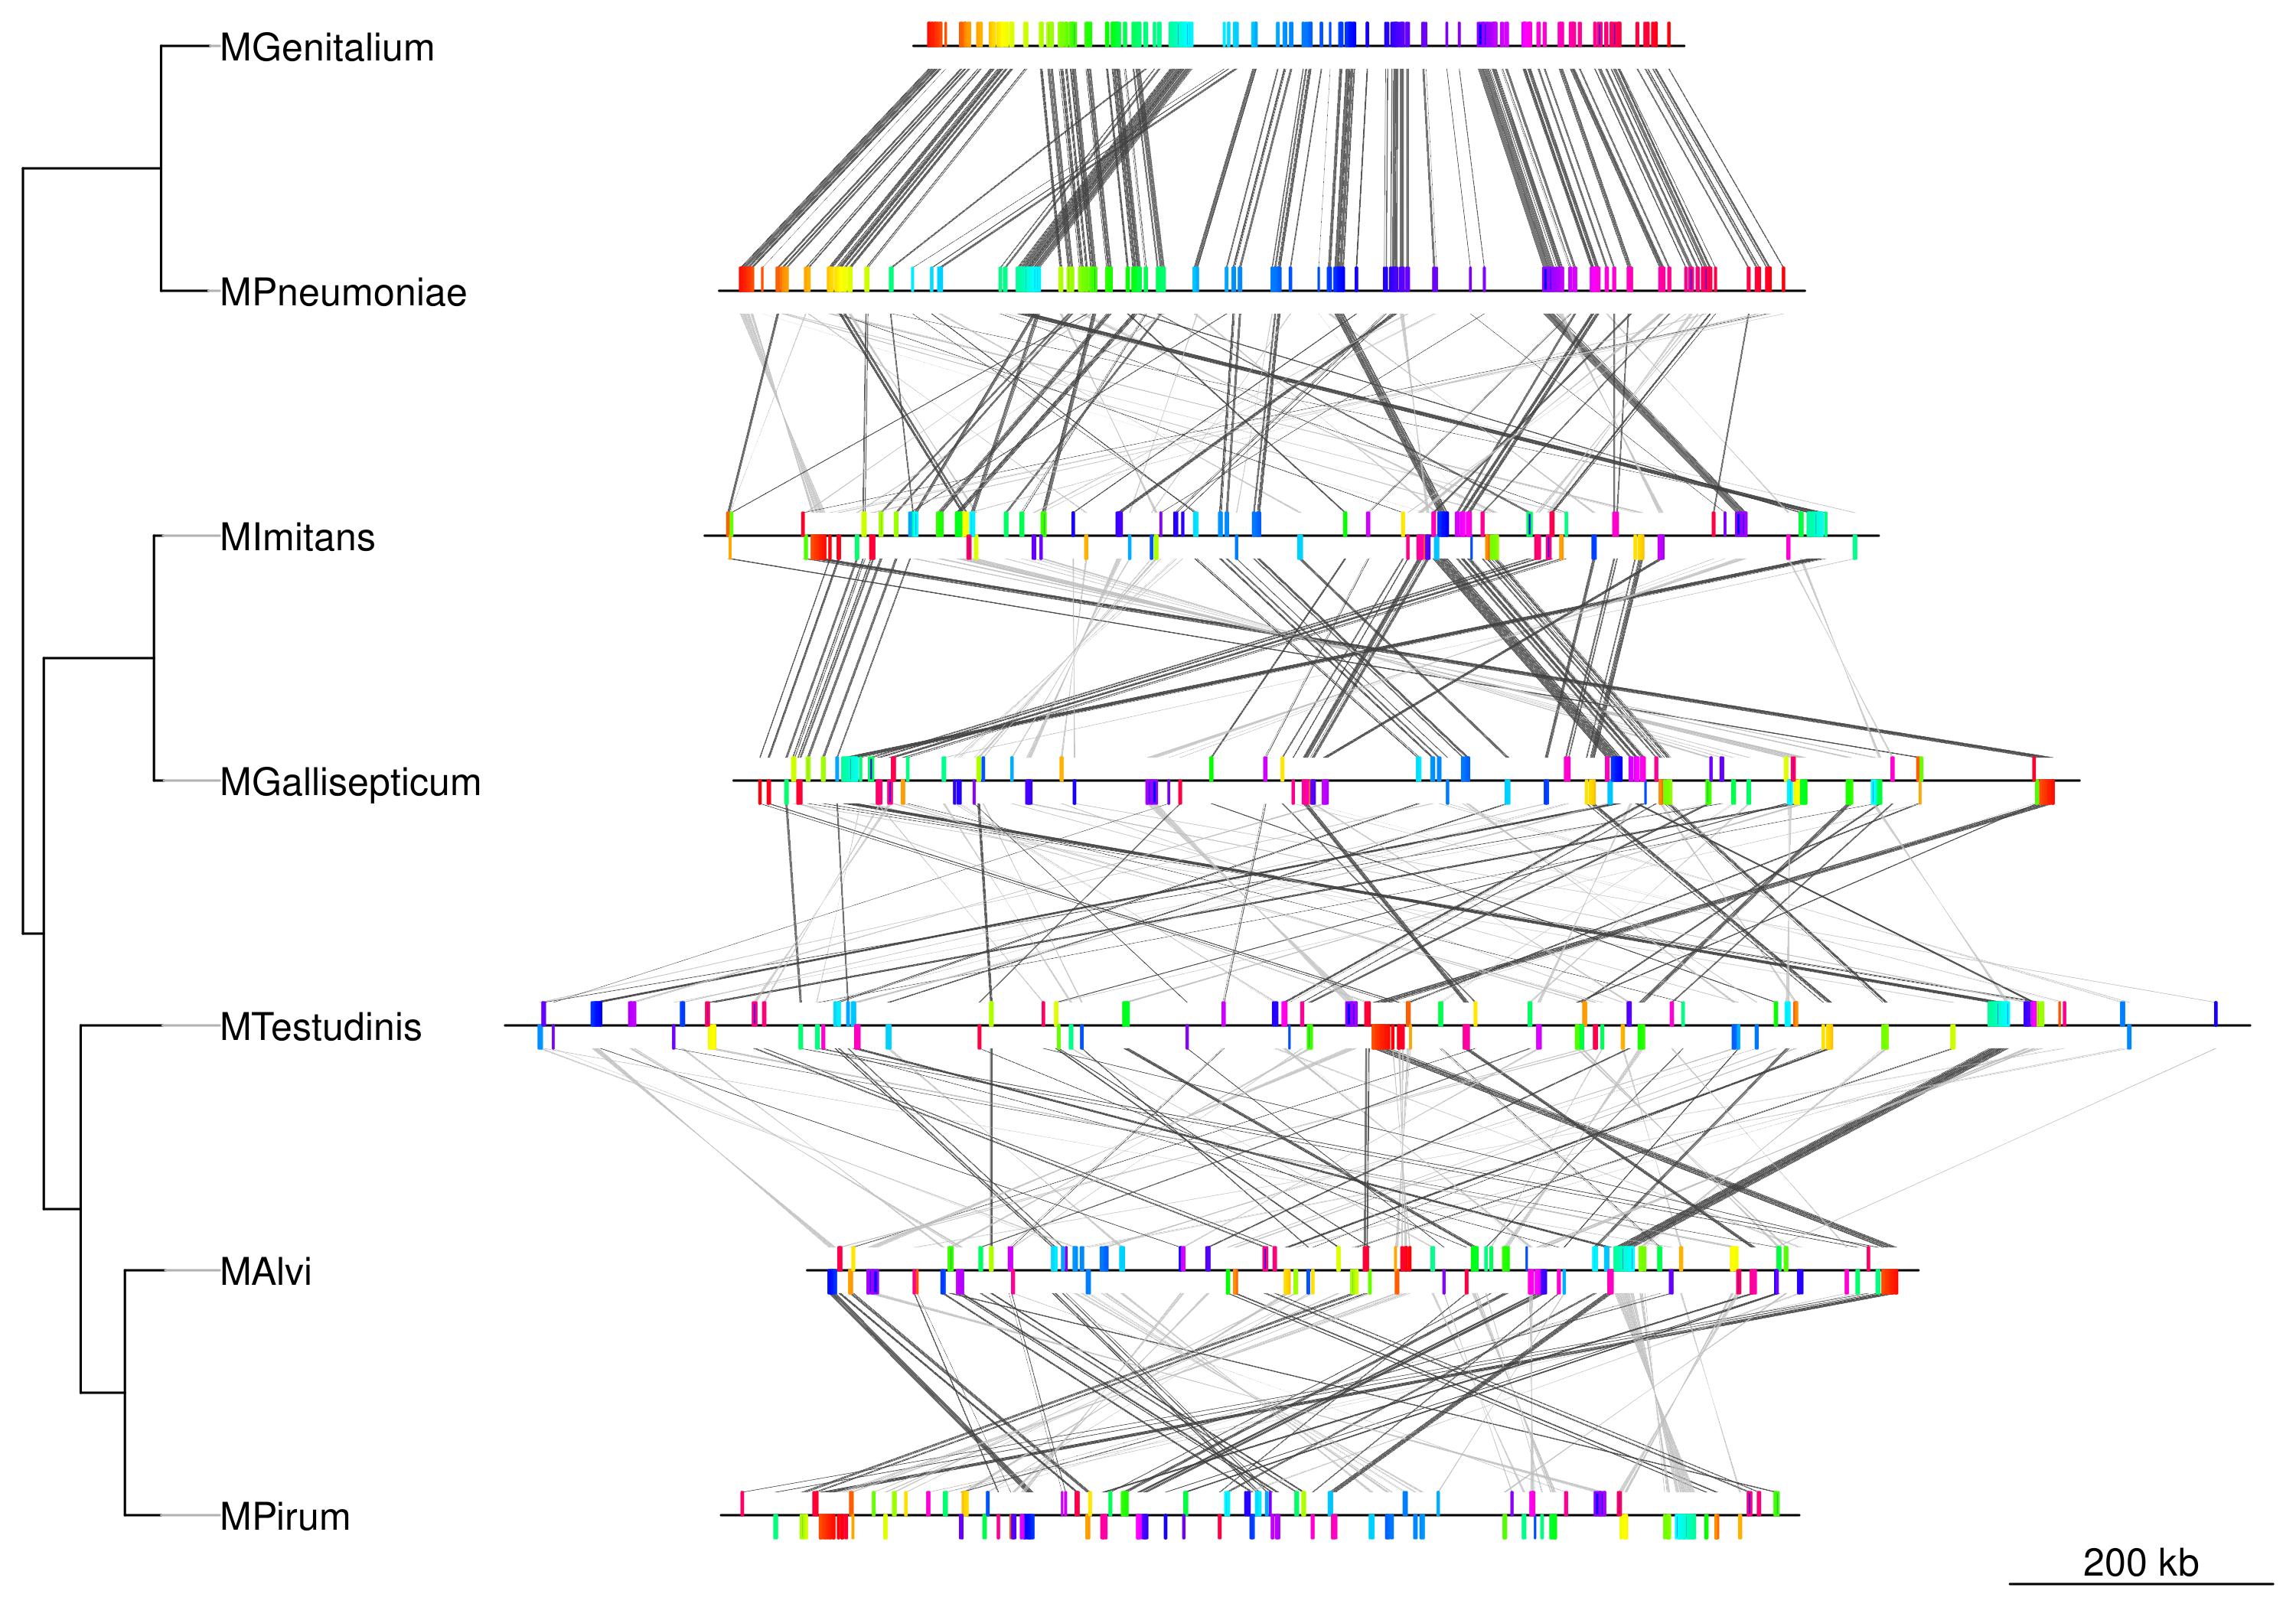
python plot_genome_align_fig.py -i example/mycoplasma/genbank -t example/mycoplasma/mycoplasma.nwk -o mycoplasma_plot


