The master branch is not up to date. The known bugs are fixed on the development branch. Since the API has not changed, the branches will be replaced soon. To avoid further problems, you should use the development branch as default from now on.
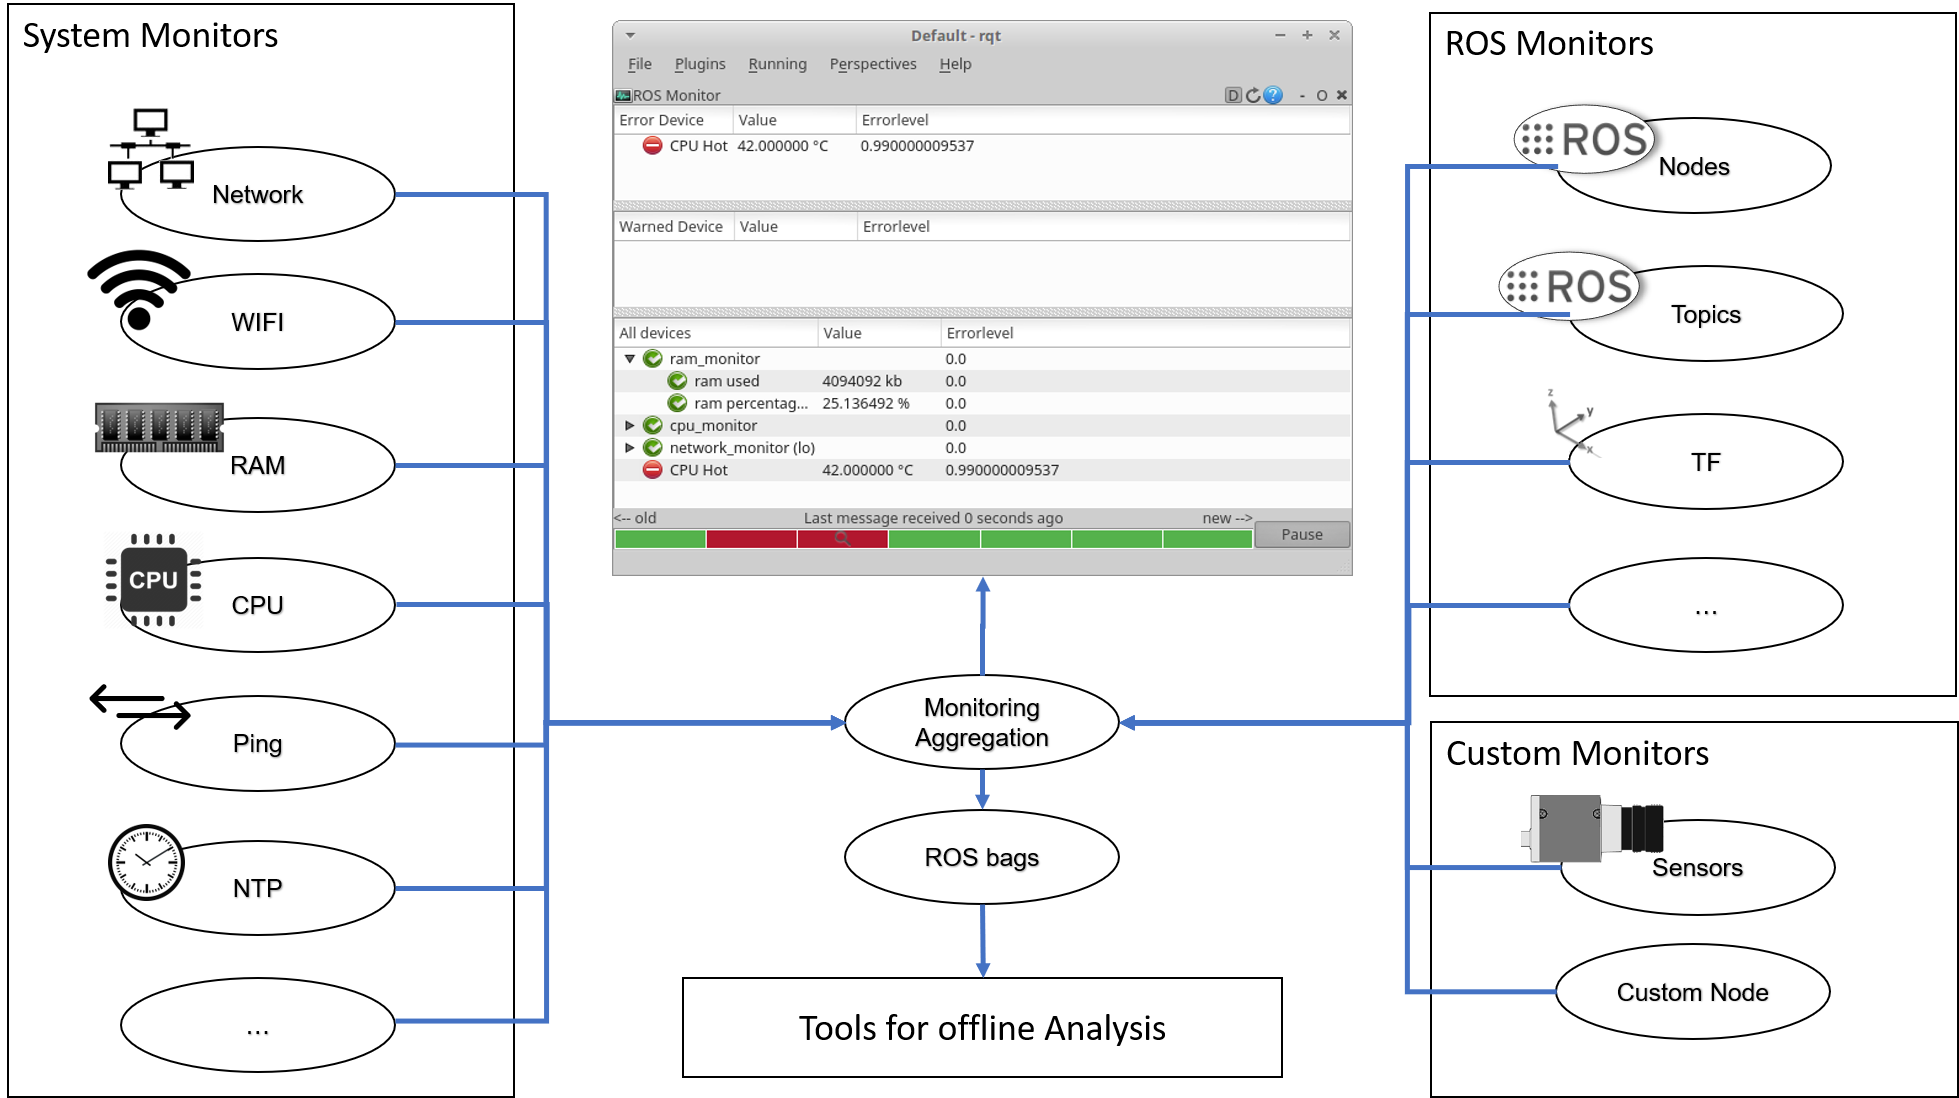
The ROS Monitoring Tools helps to analyse and improve ROS Systems. It collects information about the computer, operating system and ros environment and filters them. All Values and detected Warnings and Errors can be visualised in a RQT Plugin.
This tool is designed to collect and observe system values, detect and identify failures and to perform recovery if possible. It can handle a number of distributed Monitors. Some general Monitors are included within this package, for all other nodes libraries for C++ and Python exist to integrate the Monitoring into custom Nodes.
All Monitoring-Data is aggregated and can be visualised by two different RQT-Plugins (a varriant of the ROS Monitor and the ROS Plot, modified to support Monitoring)
Besides visualisation, fault-detection and recovery are supported.
The monitoring tools are tested on:
- Kinetik
- Melodic
To use all features the following packages are required.
sudo apt install libprocps4-dev python-ntplib
To build from source, clone the latest version from this repository into your catkin workspace and compile the package using catkin_make.
-
monitoring_bag_plot contains tools to plot from rosbags, usefull for offline analysis
-
monitoring_bridge contains a bridge to and from diagnostics
-
monitoring_core contains the c++ and python libraries. These are used by the monitors and help to include monitors in other nodes.
-
monitoring_example contains examples how to setup own monitors and launch files how to start and use the entire tool
-
monitoring_fdir contains a examples and libraries how to detect high level failures and how to react (restart nodes, call services etc.)
-
monitoring_monitors_ros contains monitors to observe the ros system:
- node monitor
- topic monitor
- node ressource monitor
- map monitor
- statistics monitor
- tf monitor
- topic value monitor
-
monitoring_monitors_system contains montiros to observer certain non ros-specific values of the system, currently the following monitors are included:
- clockdifff_monitor
- cpu_monitor
- cpu frequency monitor
- network interface monitor
- ping monitor
- ram monitor
- wifi monitor
-
monitoring_msgs contains the msgs used to distribute monitored values
-
monitoring_rqt contains a port of the diagnostics monitor to work with the monitoring tool
-
monitoring_rqt_plot contains an extension to the rqt plot plugin to work with monitoring
-
monitoring_visualisation contains a scripts and tool for visualistion and the gui concatination (aggregation) node
To launch a default configuration execute:
roslaunch monitoring_examples system.launch
For futher configuration all monitors offer a number of parameters to tune.
