Read, manipulate and visualize 'Pairwise mApping Format' data in R
This package is in the process of being turned from reseach code into a nice usable package. Much of the code is already here, but documentation tests and added-flexibility are still being added.
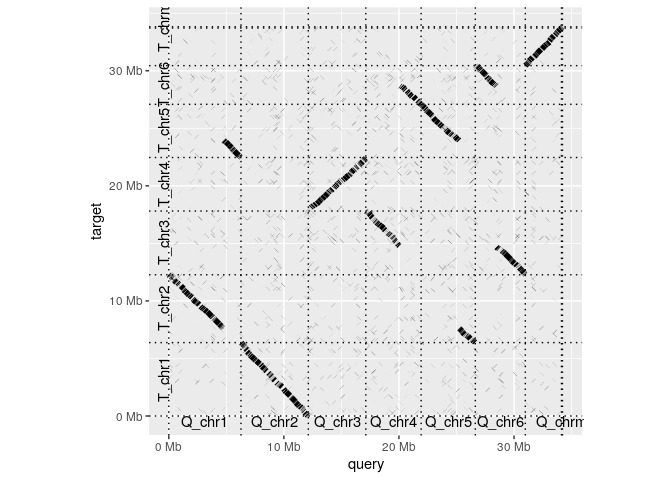
Nevertheless, you can check out the code and run it for youself. Here's how to make a basic whole-genome dotplot from a PAF file:
library(pafr, quietly=TRUE)
test_alignment <- system.file("extdata", "fungi.paf", package="pafr")
ali <- read_paf(test_alignment)
dotplot(ali, label_seqs=TRUE)If you want to play with the code already here, you can install this package using devtools
#install.packages(devtools)
devtools::install_github("dwinter/pafr")Please use the issue tracker on this repo to let us know about any bugs or issues that arise as you use this package.


