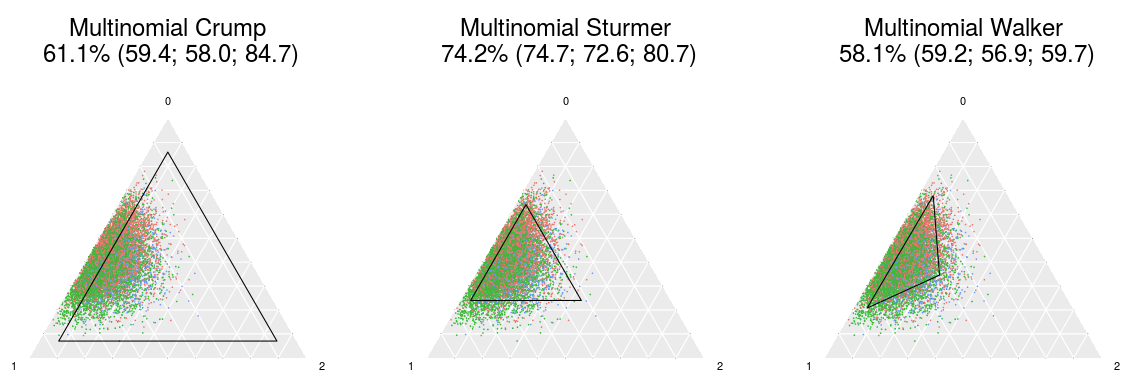
This is the code repository for our upcoming paper on propensity score (PS) trimming in settings with multiple (3 or more) treatment groups. In this paper, we proposed definitions to extend three existing PS trimming methods (Crump et al. Biometrika 2009;96:187, Stürmer et al. Am J Epidemiol 2010;172:843, and Walker et al. Comp Eff Res 2013;3:11) for multinomial exposures.
- Paper: in press
- ICPE 2018 poster: https://github.com/kaz-yos/icpe-2018-org-mode-poster
- Web app: https://kaz-yos.shinyapps.io/shiny_trim_ternary/
- Web app source code: https://github.com/kaz-yos/shiny-trim-ternary
*.R: Main R script files for generating simulation data, analyzing data, and reporting results. Execution each file will generate a plain text report file named *.R.txt underlog/.*_o2.sh: Example shell scripts for the Linux SLURM batch job system. These are designed for Harvard Medical School’s O2 cluster specifically, and are not expected to work without modification elsewhere.data/: Folder for simulation data. Due to file size issues, only the summary file for running06_assess_results.Ris kept.log/: Folder for log files.out/: Folder for figure PDFs.
Two custom R packages must be installed before running the R scripts provided in this repository.
## Install devtools (if you do not have it already)
install.packages("devtools")
## Install the data generation package
devtools::install_github(repo = "kaz-yos/datagen3")
## Install the simulation package
devtools::install_github(repo = "kaz-yos/trim3")
Additionally, packages doParallel, doRNG, grid, gtable, and tidyverse, are required in the scripts.
Running the following will generate raw data files under the data/ folder using 8 cores.
Rscript ./01_generate_data.R 8If you have access to a SLURM-based computing cluster, the following can be used with appropriate modifications to the shell script.
sh ./01_generate_data_o2.shRunning the following will process the specified data file (PS estimation and trimming) and generate a new file with the same name except that raw changes to prepared.
Rscript ./02_prepare_data.R ./data/scenario_raw001_part001_r50.RData 8If you have access to a SLURM-based computing cluster, the following can be used with appropriate modifications to the shell script. This will dispatch a SLURM job for each file.
sh ./02_prepare_data_o2.sh ./data/scenario_raw*Running the following will analyze the specified data file (outcome model estimation) and generate a new file with the same name except that prepared changes to analyzed.
Rscript ./03_analyze_data.R ./data/scenario_prepared001_part001_r50.RData 8If you have access to a SLURM-based computing cluster, the following can be used with appropriate modifications to the shell script. This will dispatch a SLURM job for each file.
sh ./03_analyze_data_o2.sh ./data/scenario_prepared*Running the following will aggregate all the analyzed data files under data/ and generate a single new file named all_analysis_results.RData.
Rscript ./04_aggregate_results.R 1If you have access to a SLURM-based computing cluster, the following can be used with appropriate modifications to the shell script.
sh ./04_aggregate_results_o2.shRunning the following will summarize the results (scenario-level summaries) and generate a new file named all_analysis_summary.RData.
Rscript ./05_summarize_results.R ./data/all_analysis_results.RData 1If you have access to a SLURM-based computing cluster, the following can be used with appropriate modifications to the shell script.
sh ./05_summarize_results_o2.sh ./data/all_analysis_results.RDataRunning the following will create figures under out/ describing the summary statistics in all_analysis_summary.RData.
./Rscriptee ./06_assess_results.R ./data/all_analysis_summary.RData 1Kazuki Yoshida <kazukiyoshida@mail.harvard.edu>
