- Upgrade to cellxgene v 1.1.1. After pull, please run "config.sh"
- Install new modules if needed, e.g., pip install anndata==0.8.0
Cellxgene VIP unleashes full power of interactive visualization and integrative analysis of scRNA-seq, spatial transcriptomics, and multiome data
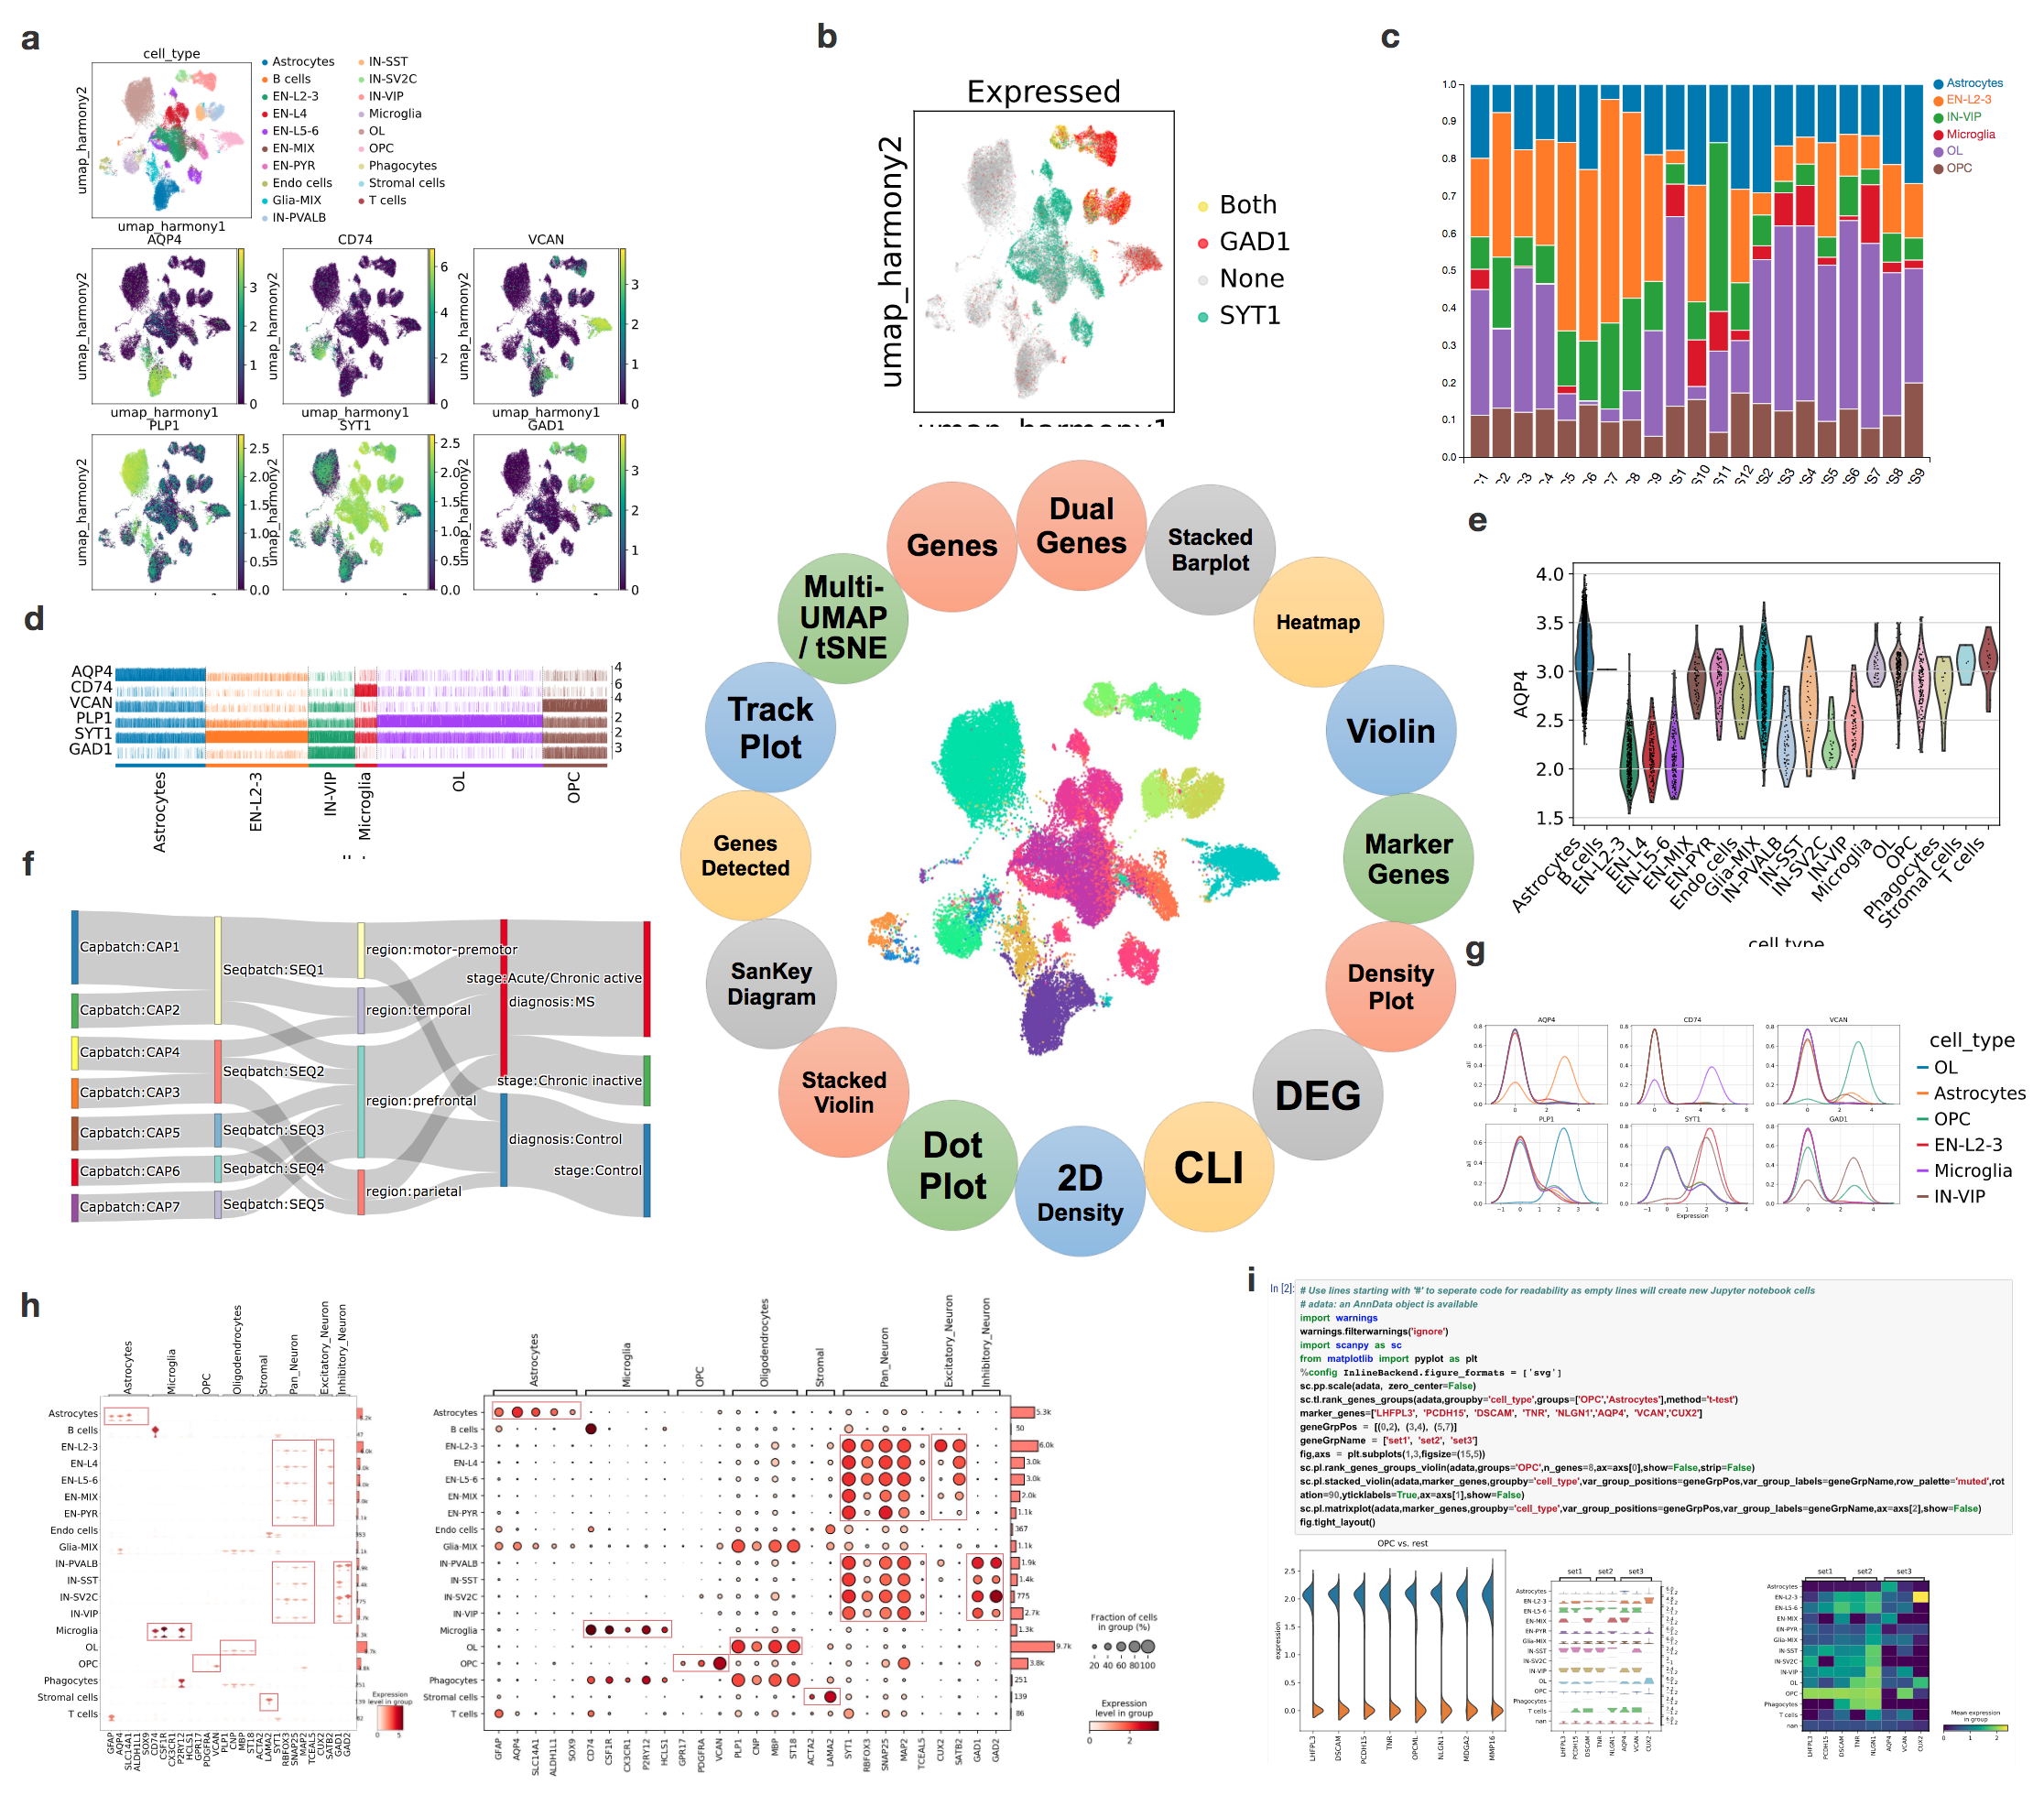
To meet the growing demands from scientists to effectively extract deep insights from single cell RNA sequencing, spatial transcriptomics, and emerging multiome datasets, we developed cellxgene VIP (Visualization In Plugin), a frontend interactive visualization plugin of cellxgene framework, which greatly expanded capabilities of the base tool in the following aspects. First, it generates a comprehensive set of over eighteen commonly used quality control and analytical plots in high resolution with highly customizable settings in real time. Second, it provides more advanced analytical functions to gain insights on cellular compositions and deep biology, such as marker gene identification, differential gene expression analysis, and gene set enrichment analysis. Third, it empowers advanced users to perform analysis in a Jupyter Notebook like environment, dubbed Command Line Interface (CLI) by programming in Python and/or R directly without limiting themselves to functional modules available via graphical user interface (GUI). Finally, it pioneers methods to visualize multi-modal data, such as spatial transcriptomics embedding aligned with histological image on one slice or multiple slices in a grid format, and the latest 10x Genomic Multiome dataset where both DNA accessibility and gene expression in the same cells are measured, under the same framework in an integrative way to fully leverage the functionalities mentioned above. Taken together, the open-source tool makes large scale single cell data visualization and analysis more accessible to biologists in a user-friendly manner and fosters computational reproducibility by simplifying data and code reuse through the CLI. Going forward, it has the potential to become a crowdsourcing ecosystem for the scientific community to contribute even more modules to the Swiss Army knife of single cell data exploration tools.

Demo site: https://cellxgenevip-ms.bxgenomics.com , https://cellxgenevip-spatial.bxgenomics.com, and https://cellxgenevip-multiome.bxgenomics.com
Online tutorial: https://interactivereport.github.io/cellxgene_VIP/tutorial/docs
Video tutorial: https://youtu.be/s3Cdz77ioGk
1. Install anaconda if not available on server (https://docs.anaconda.com/anaconda/install/linux/)
bash ~/Downloads/Anaconda3-2020.02-Linux-x86_64.shClone the repo to your local,
git clone https://github.com/interactivereport/cellxgene_VIP.git
cd cellxgene_VIP
- For Linux users
./install_VIPlight.sh
- For MacOS users (including M1/M2 users)
./install_VIPlight.sh
Users can change the conda env location by changing appPATH in the above script.
And lauch the VIP by (all input arguments the same as cellxgene:
./VIPlight launch <path/to/h5ad> --host <IP> -p <port>
And then skip following step 3/4/5/6/
git clone https://github.com/interactivereport/cellxgene_VIP.git
cd cellxgene_VIP

source <path to Anaconda3>/etc/profile.d/conda.sh (Default: /opt/anaconda3/etc/profile.d/conda.sh)
conda config --set channel_priority flexible
conda env create -n <env name, such as: VIP> -f VIP.yml (system-wide R) or VIP_conda_R.yml (local R under conda, no root privilege needed)

For Mac User, conda env create -n <env name, such as: VIP> -f VIP.macOS.yml

conda activate <env name, such as: VIP>
or
source activate <env name>./config.sh
For Mac User, ./config.macOS.shexport LIBARROW_MINIMAL=false
unset R_LIBS_USER
# ensure that the right instance of R is used. e.g. system-wide: /bin/R or /usr/bin/R ; local R under conda: ~/.conda/envs/VIP_conda_R/bin/R
which R
# The version of a Bioconductor package is controlled by BiocManager, whose version is provided
R -q -e 'if(!require(devtools)) install.packages("devtools",repos = "http://cran.us.r-project.org")'
R -q -e 'if(!require(Cairo)) devtools::install_version("Cairo",version="1.5-12",repos = "http://cran.us.r-project.org")'
R -q -e 'if(!require(foreign)) devtools::install_version("foreign",version="0.8-76",repos = "http://cran.us.r-project.org")'
R -q -e 'if(!require(ggpubr)) devtools::install_version("ggpubr",version="0.3.0",repos = "http://cran.us.r-project.org")'
R -q -e 'if(!require(ggrastr)) devtools::install_version("ggrastr",version="0.2.1",repos = "http://cran.us.r-project.org")'
R -q -e 'if(!require(arrow)) devtools::install_version("arrow",version="2.0.0",repos = "http://cran.us.r-project.org")'
R -q -e 'if(!require(Seurat)) devtools::install_version("Seurat",version="3.2.3",repos = "http://cran.us.r-project.org")'
R -q -e 'if(!require(rmarkdown)) devtools::install_version("rmarkdown",version="2.5",repos = "http://cran.us.r-project.org")'
R -q -e 'if(!require(tidyverse)) devtools::install_version("tidyverse",version="1.3.0",repos = "http://cran.us.r-project.org")'
R -q -e 'if(!require(viridis)) devtools::install_version("viridis",version="0.5.1",repos = "http://cran.us.r-project.org")'
R -q -e 'if(!require(hexbin)) devtools::install_version("hexbin",version="1.28.2",repos = "http://cran.us.r-project.org")'
R -q -e 'if(!require(ggforce)) devtools::install_version("ggforce",version="0.3.3",repos = "http://cran.us.r-project.org")'
R -q -e 'if(!require(RcppRoll)) devtools::install_version("RcppRoll",version="0.3.0",repos = "http://cran.r-project.org")'
R -q -e 'if(!require(fastmatch)) devtools::install_version("fastmatch",version="1.1-3",repos = "http://cran.r-project.org")'
R -q -e 'if(!require(BiocManager)) devtools::install_version("BiocManager",version="1.30.10",repos = "http://cran.us.r-project.org")'
R -q -e 'if(!require(fgsea)) BiocManager::install("fgsea")'
R -q -e 'if(!require(rtracklayer)) BiocManager::install("rtracklayer")'
R -q -e 'if(!require(rjson)) devtools::install_version("rjson",version="0.2.20",repos = "https://cran.us.r-project.org")'
R -q -e 'if(!require(ComplexHeatmap)) BiocManager::install("ComplexHeatmap")'
# These should be already installed as dependencies of above packages
R -q -e 'if(!require(dbplyr)) devtools::install_version("dbplyr",version="1.0.2",repos = "http://cran.us.r-project.org")'
R -q -e 'if(!require(RColorBrewer)) devtools::install_version("RColorBrewer",version="1.1-2",repos = "http://cran.us.r-project.org")'
R -q -e 'if(!require(glue)) devtools::install_version("glue",version="1.4.2",repos = "http://cran.us.r-project.org")'
R -q -e 'if(!require(gridExtra)) devtools::install_version("gridExtra",version="2.3",repos = "http://cran.us.r-project.org")'
R -q -e 'if(!require(ggrepel)) devtools::install_version("ggrepel",version="0.8.2",repos = "http://cran.us.r-project.org")'
R -q -e 'if(!require(MASS)) devtools::install_version("MASS",version="7.3-51.6",repos = "http://cran.us.r-project.org")'
R -q -e 'if(!require(data.table)) devtools::install_version("data.table",version="1.13.0",repos = "http://cran.us.r-project.org")'6. Run cellxgene by specifiying a h5ad file storing scRNA-seq data along with a host and a port, use "ps" to find used ports to spare, see https://chanzuckerberg.github.io/cellxgene/posts/launch for details.
ps -ef | grep cellxgene
Rscript -e 'reticulate::py_config()'
# Run the following command if the output of the above command doesn't point to the Python in your env.
export RETICULATE_PYTHON=`which python`
cellxgene launch --host <xxx> --port <xxx> --disable-annotations --verbose <h5ad file>
7. From web browser (Chrome is preferred, Version 87.0.4280.88 or 87.0.4280.141 is used), access http(s)://host:port
You should be able to see this in Console of Chrome Developer Tools if everything is right.

note: while spinning up the cellxgene from HPC, do NOT use qlogin. ssh directly to the server.
./update.VIPInterface.sh all # if "interface.html" or "VIPInterface.py" is modified or new source code needs to go to right location, often.

./update.index_template.sh # if jsPanel is modified, very rare.