

This Python package provides statistical post-hoc tests for pairwise multiple comparisons and outlier detection algorithms.
Contents:
Pairwise multiple comparisons parametric and nonparametric tests:
- Conover, Dunn, and Nemenyi tests for use with Kruskal-Wallis test.
- Conover, Nemenyi, Siegel, and Miller tests for use with Friedman test.
- Quade, van Waerden, and Durbin tests.
- Student, Mann-Whitney, Wilcoxon, and TukeyHSD tests.
- Anderson-Darling test.
- Mack-Wolfe test.
- Nashimoto and Wright's test (NPM test).
- Scheffe test.
- Tamhane T2 test.
Plotting functionality (e.g. significance plots).
Outlier detection algorithms:
- Simple test based on interquartile range (IQR).
- Grubbs test.
- Tietjen-Moore test.
- Generalized Extreme Studentized Deviate test (ESD test).
All tests are capable of p adjustments for multiple pairwise comparisons.
Package is compatible with Python 2 and Python 3.
You can install the package with:
pip install scikit-posthocs
import scikit_posthocs as sp
x = [[1,2,3,5,1], [12,31,54], [10,12,6,74,11]]
sp.posthoc_conover(x, p_adjust = 'holm')
array([[-1. , 0.00119517, 0.00278329],
[ 0.00119517, -1. , 0.18672227],
[ 0.00278329, 0.18672227, -1. ]])
Columns specified with val_col and group_col args must be melted prior to making comparisons.
import scikit_posthocs as sp
import pandas as pd
x = pd.DataFrame({"a": [1,2,3,5,1], "b": [12,31,54,62,12], "c": [10,12,6,74,11]})
x = x.melt(var_name='groups', value_name='values')
groups values 0 a 1 1 a 2 2 a 3 3 a 5 4 a 1 5 b 12 6 b 31 7 b 54 8 b 62 9 b 12 10 c 10 11 c 12 12 c 6 13 c 74 14 c 11
sp.posthoc_conover(x, val_col='values', group_col='groups', p_adjust = 'fdr_bh')a b c a -1.000000 0.000328 0.002780 b 0.000328 -1.000000 0.121659 c 0.002780 0.121659 -1.000000
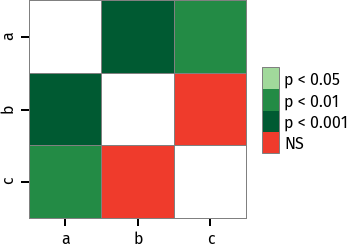
P values can be plotted using a heatmap:
pc = sp.posthoc_conover(x, val_col='values', group_col='groups')
heatmap_args = {'linewidths': 0.25, 'linecolor': '0.5', 'clip_on': False, 'square': True, 'cbar_ax_bbox': [0.80, 0.35, 0.04, 0.3]}
sp.sign_plot(pc, **heatmap_args)
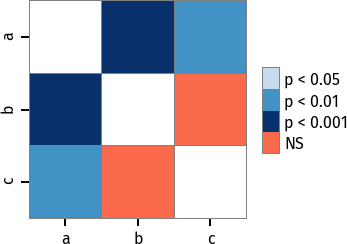
Custom colormap applied to a plot:
pc = sp.posthoc_conover(x, val_col='values', group_col='groups')
# Format: diagonal, non-significant, p<0.001, p<0.01, p<0.05
cmap = ['1', '#fb6a4a',  '#08306b',  '#4292c6', '#c6dbef']
heatmap_args = {'cmap': cmap, 'linewidths': 0.25, 'linecolor': '0.5', 'clip_on': False, 'square': True, 'cbar_ax_bbox': [0.80, 0.35, 0.04, 0.3]}
sp.sign_plot(pc, **heatmap_args)Thorsten Pohlert, PMCMR author and maintainer


