


![]()

A plugin to create Matplotlib plots from napari layers
napari-matplotlib is a bridge between napari and matplotlib, making it easy to create publication quality Matplotlib plots based on the data loaded in napari layers.
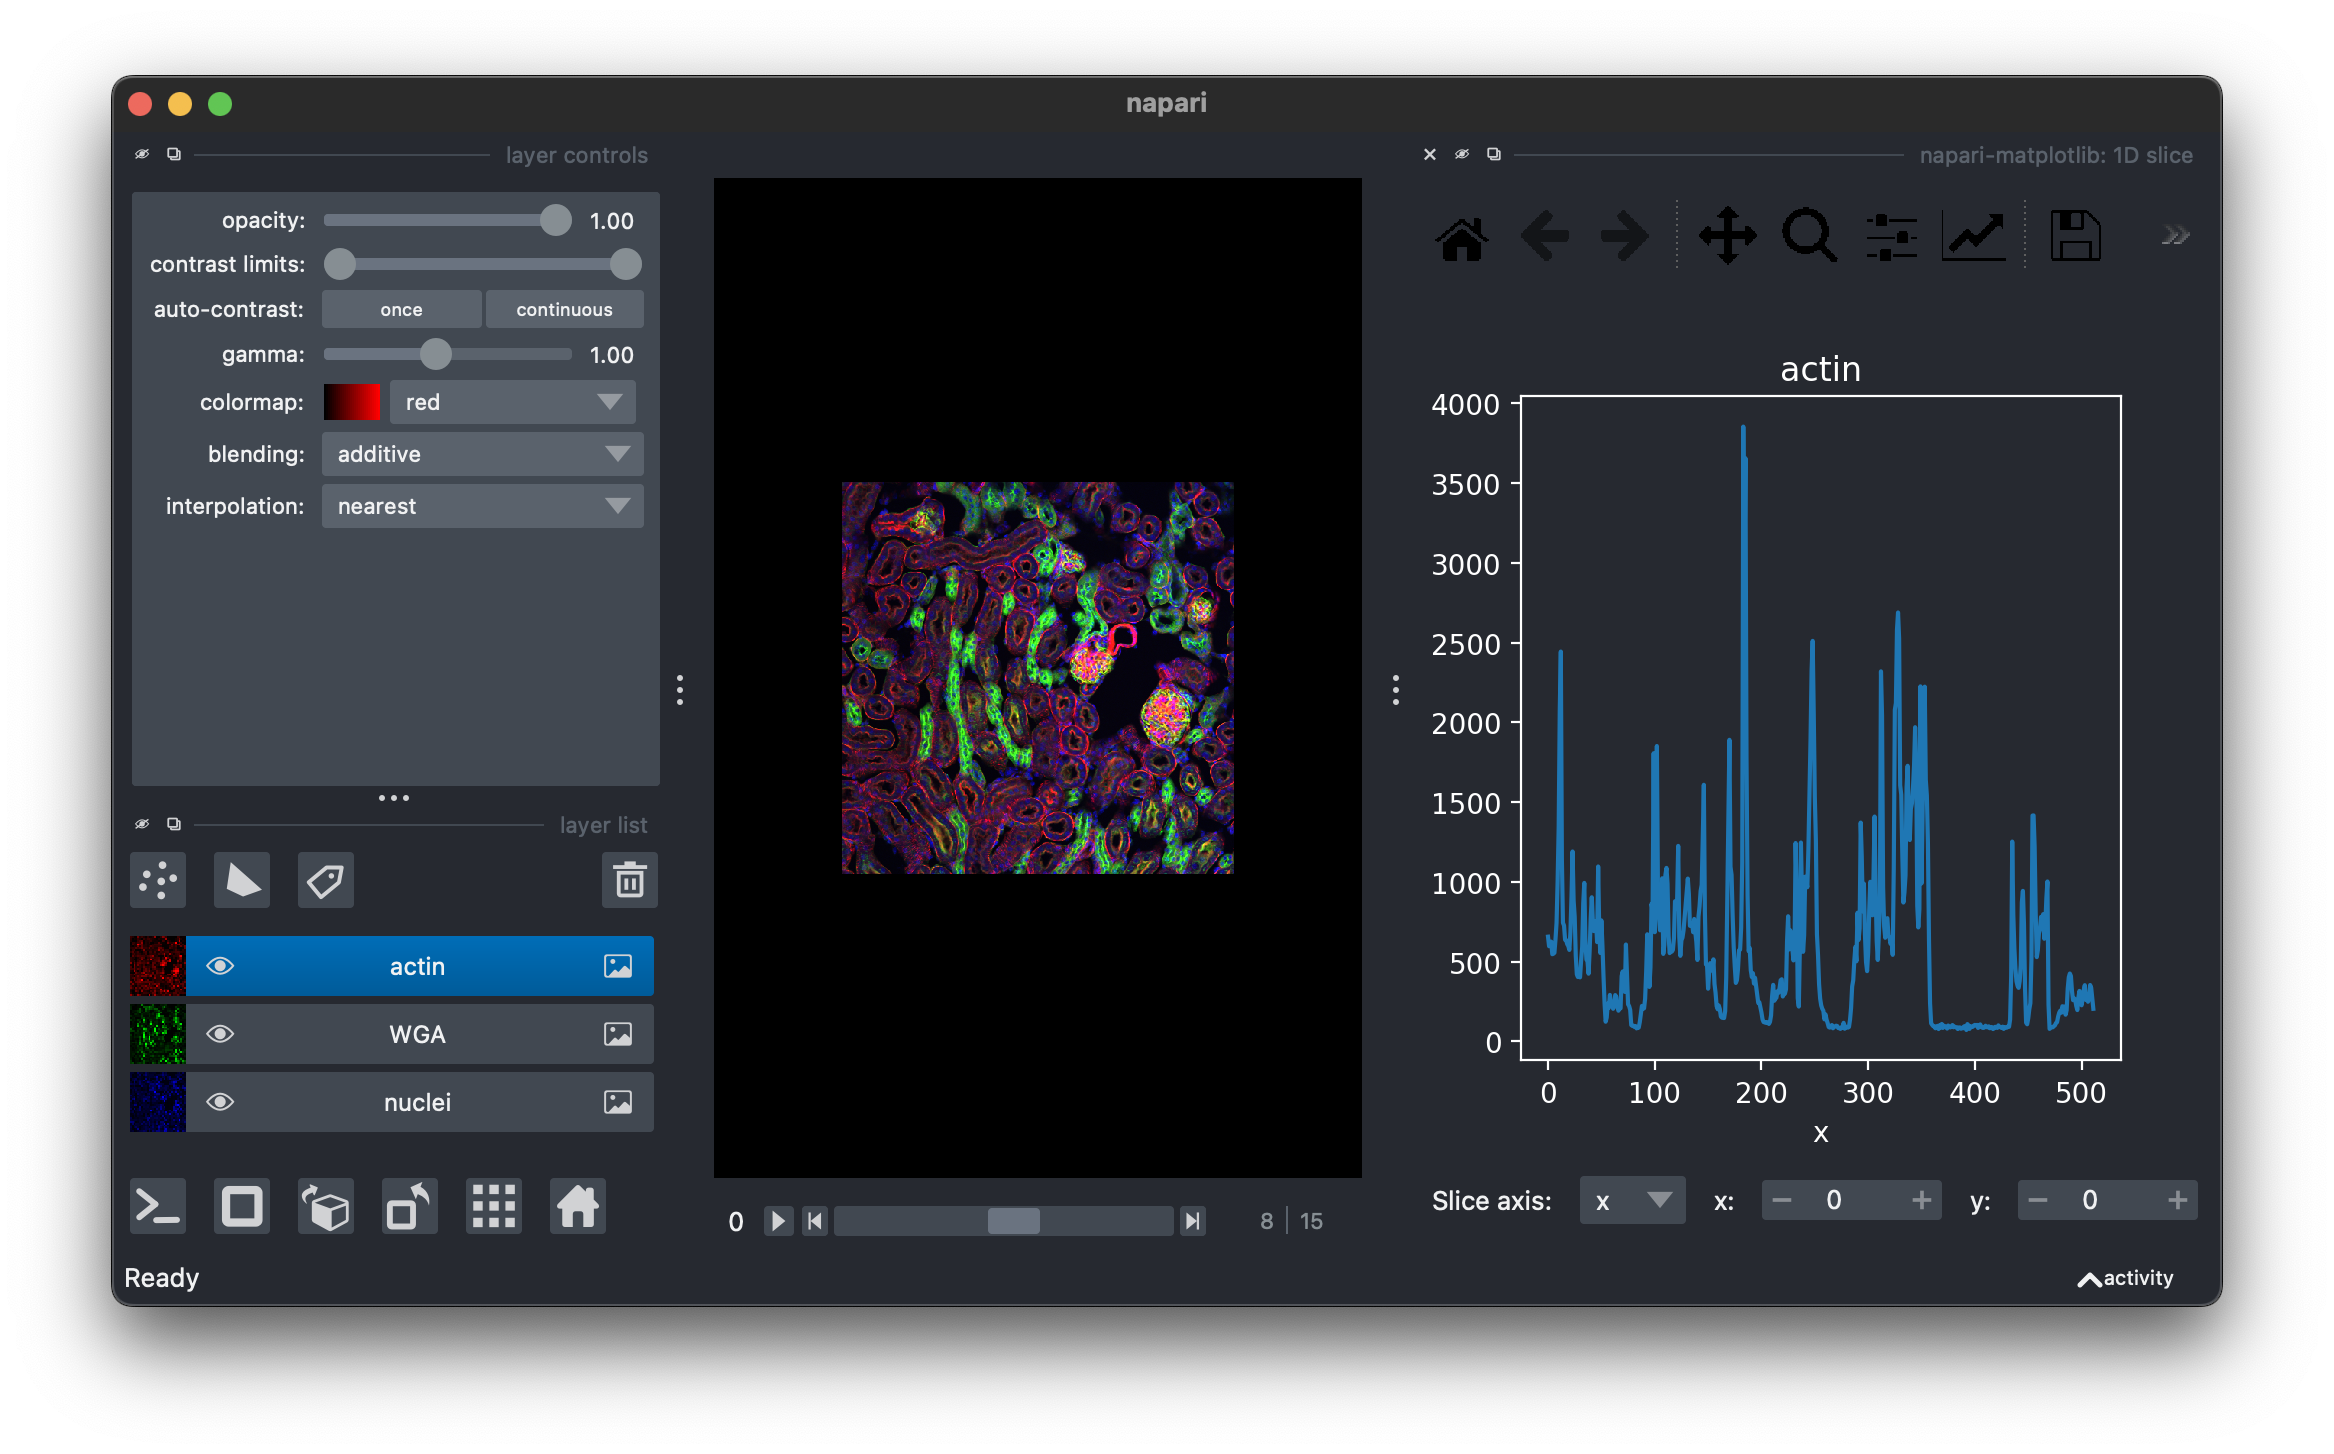
Plots 1D slices of data along a specified axis.
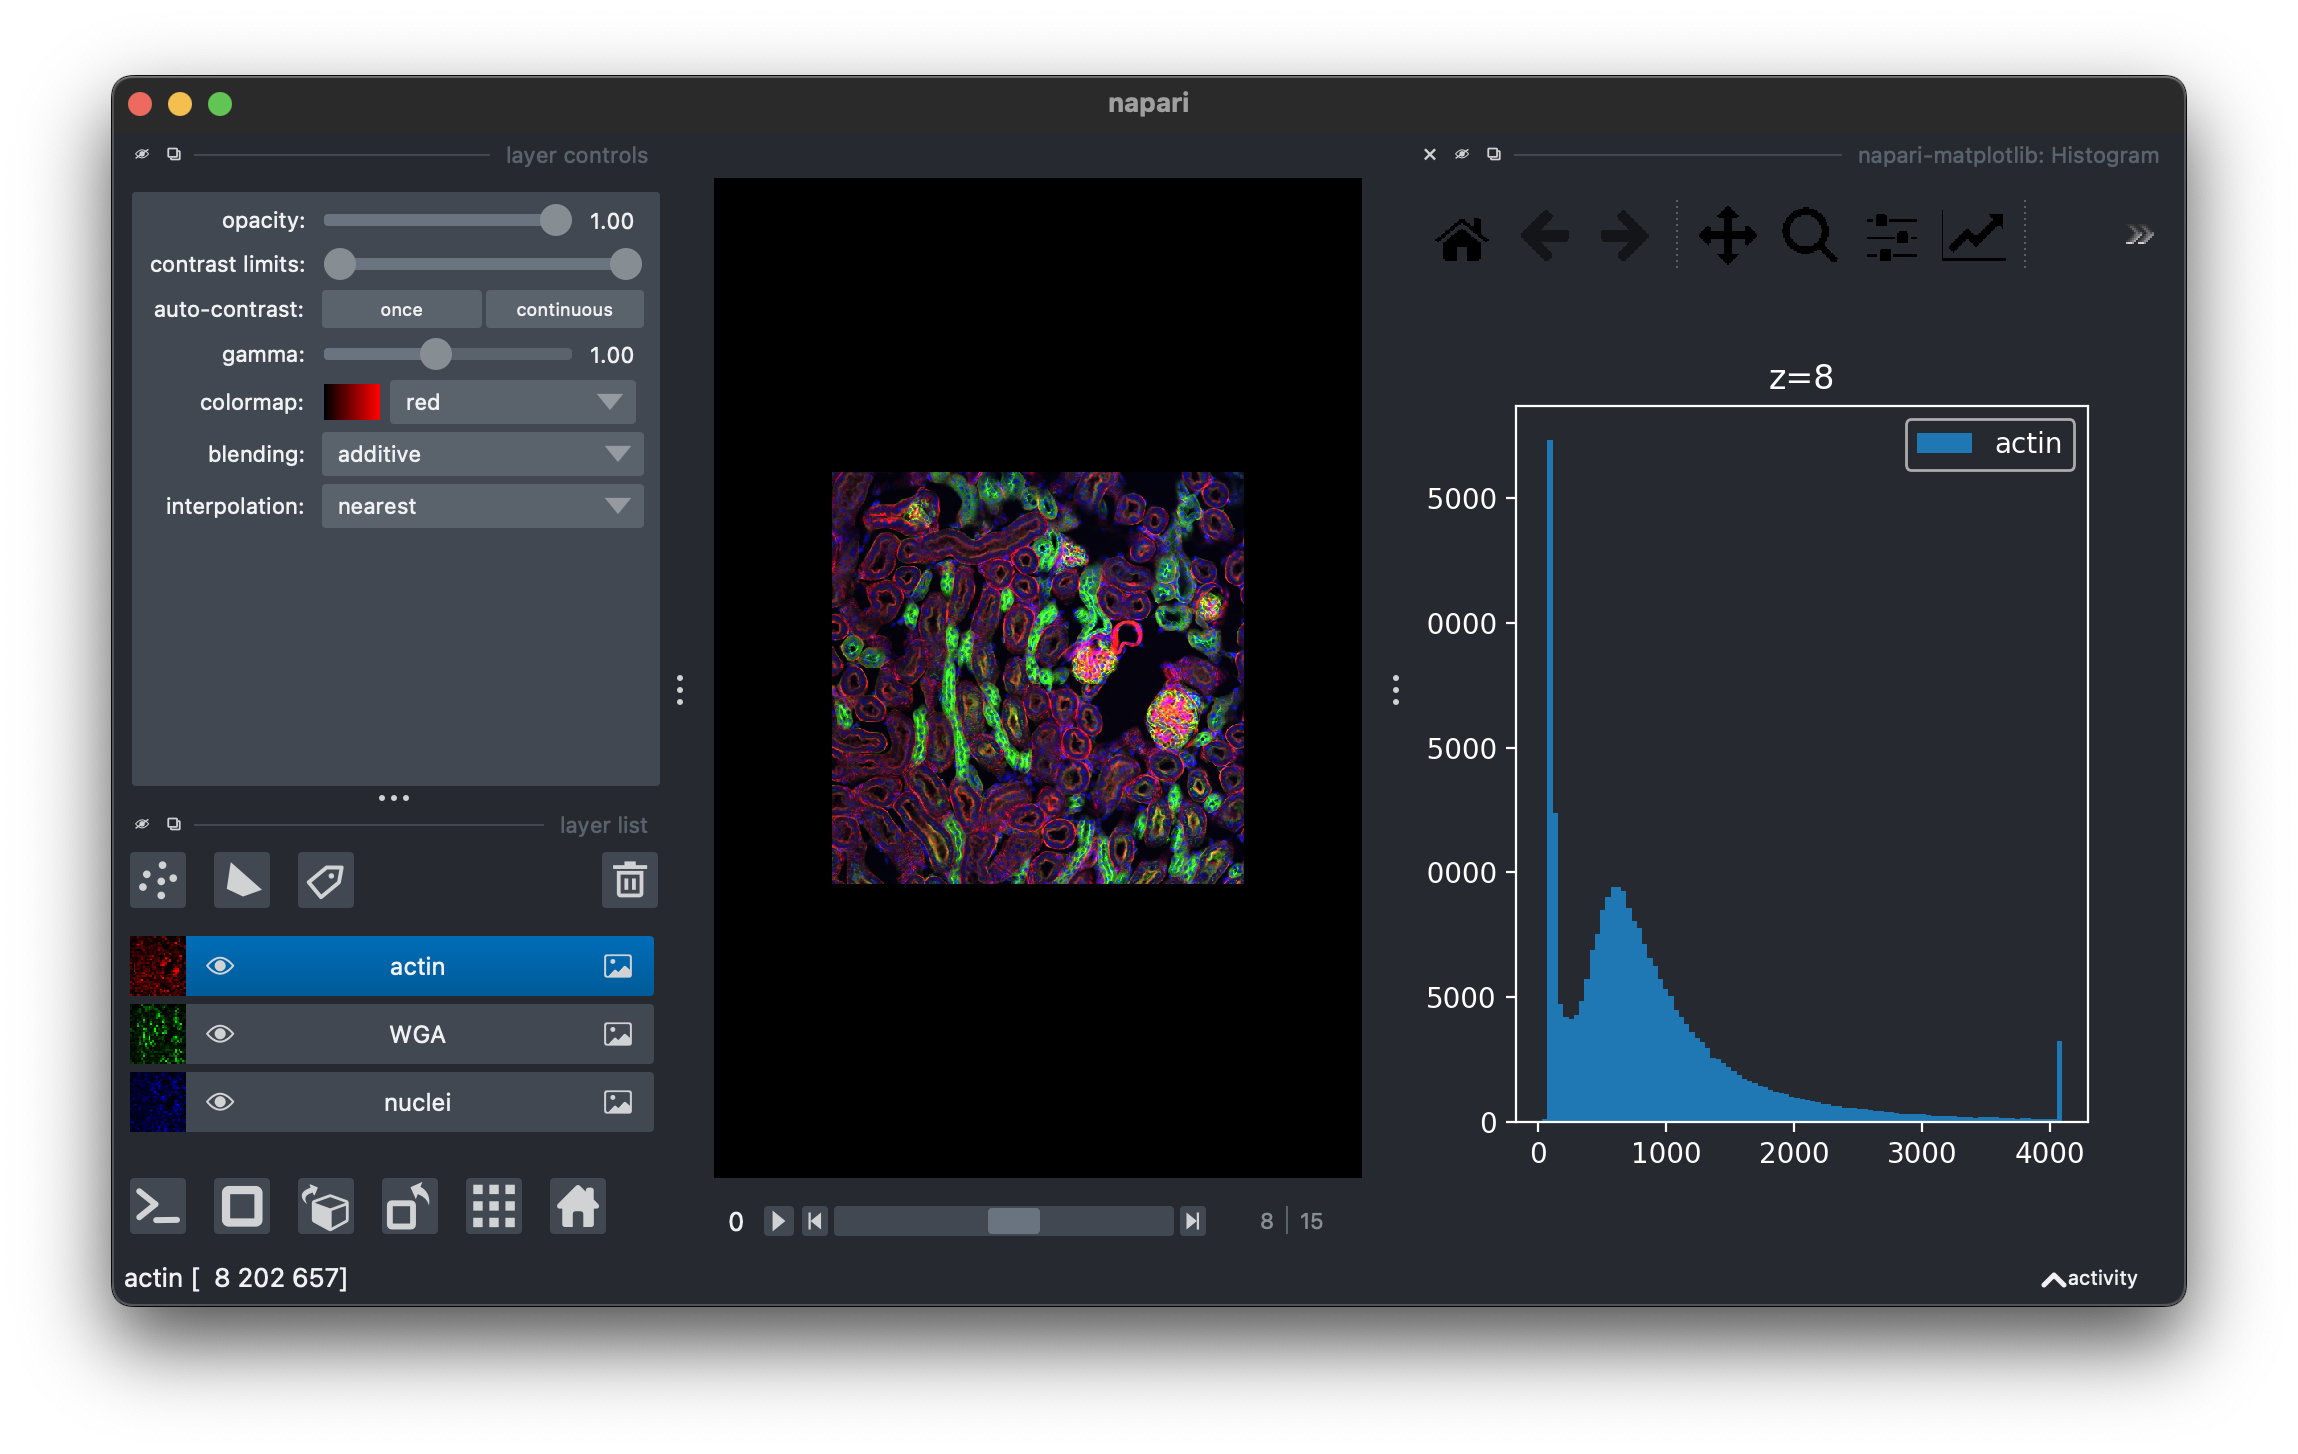
Plots histograms of individual image layers, or RGB histograms of an RGB image
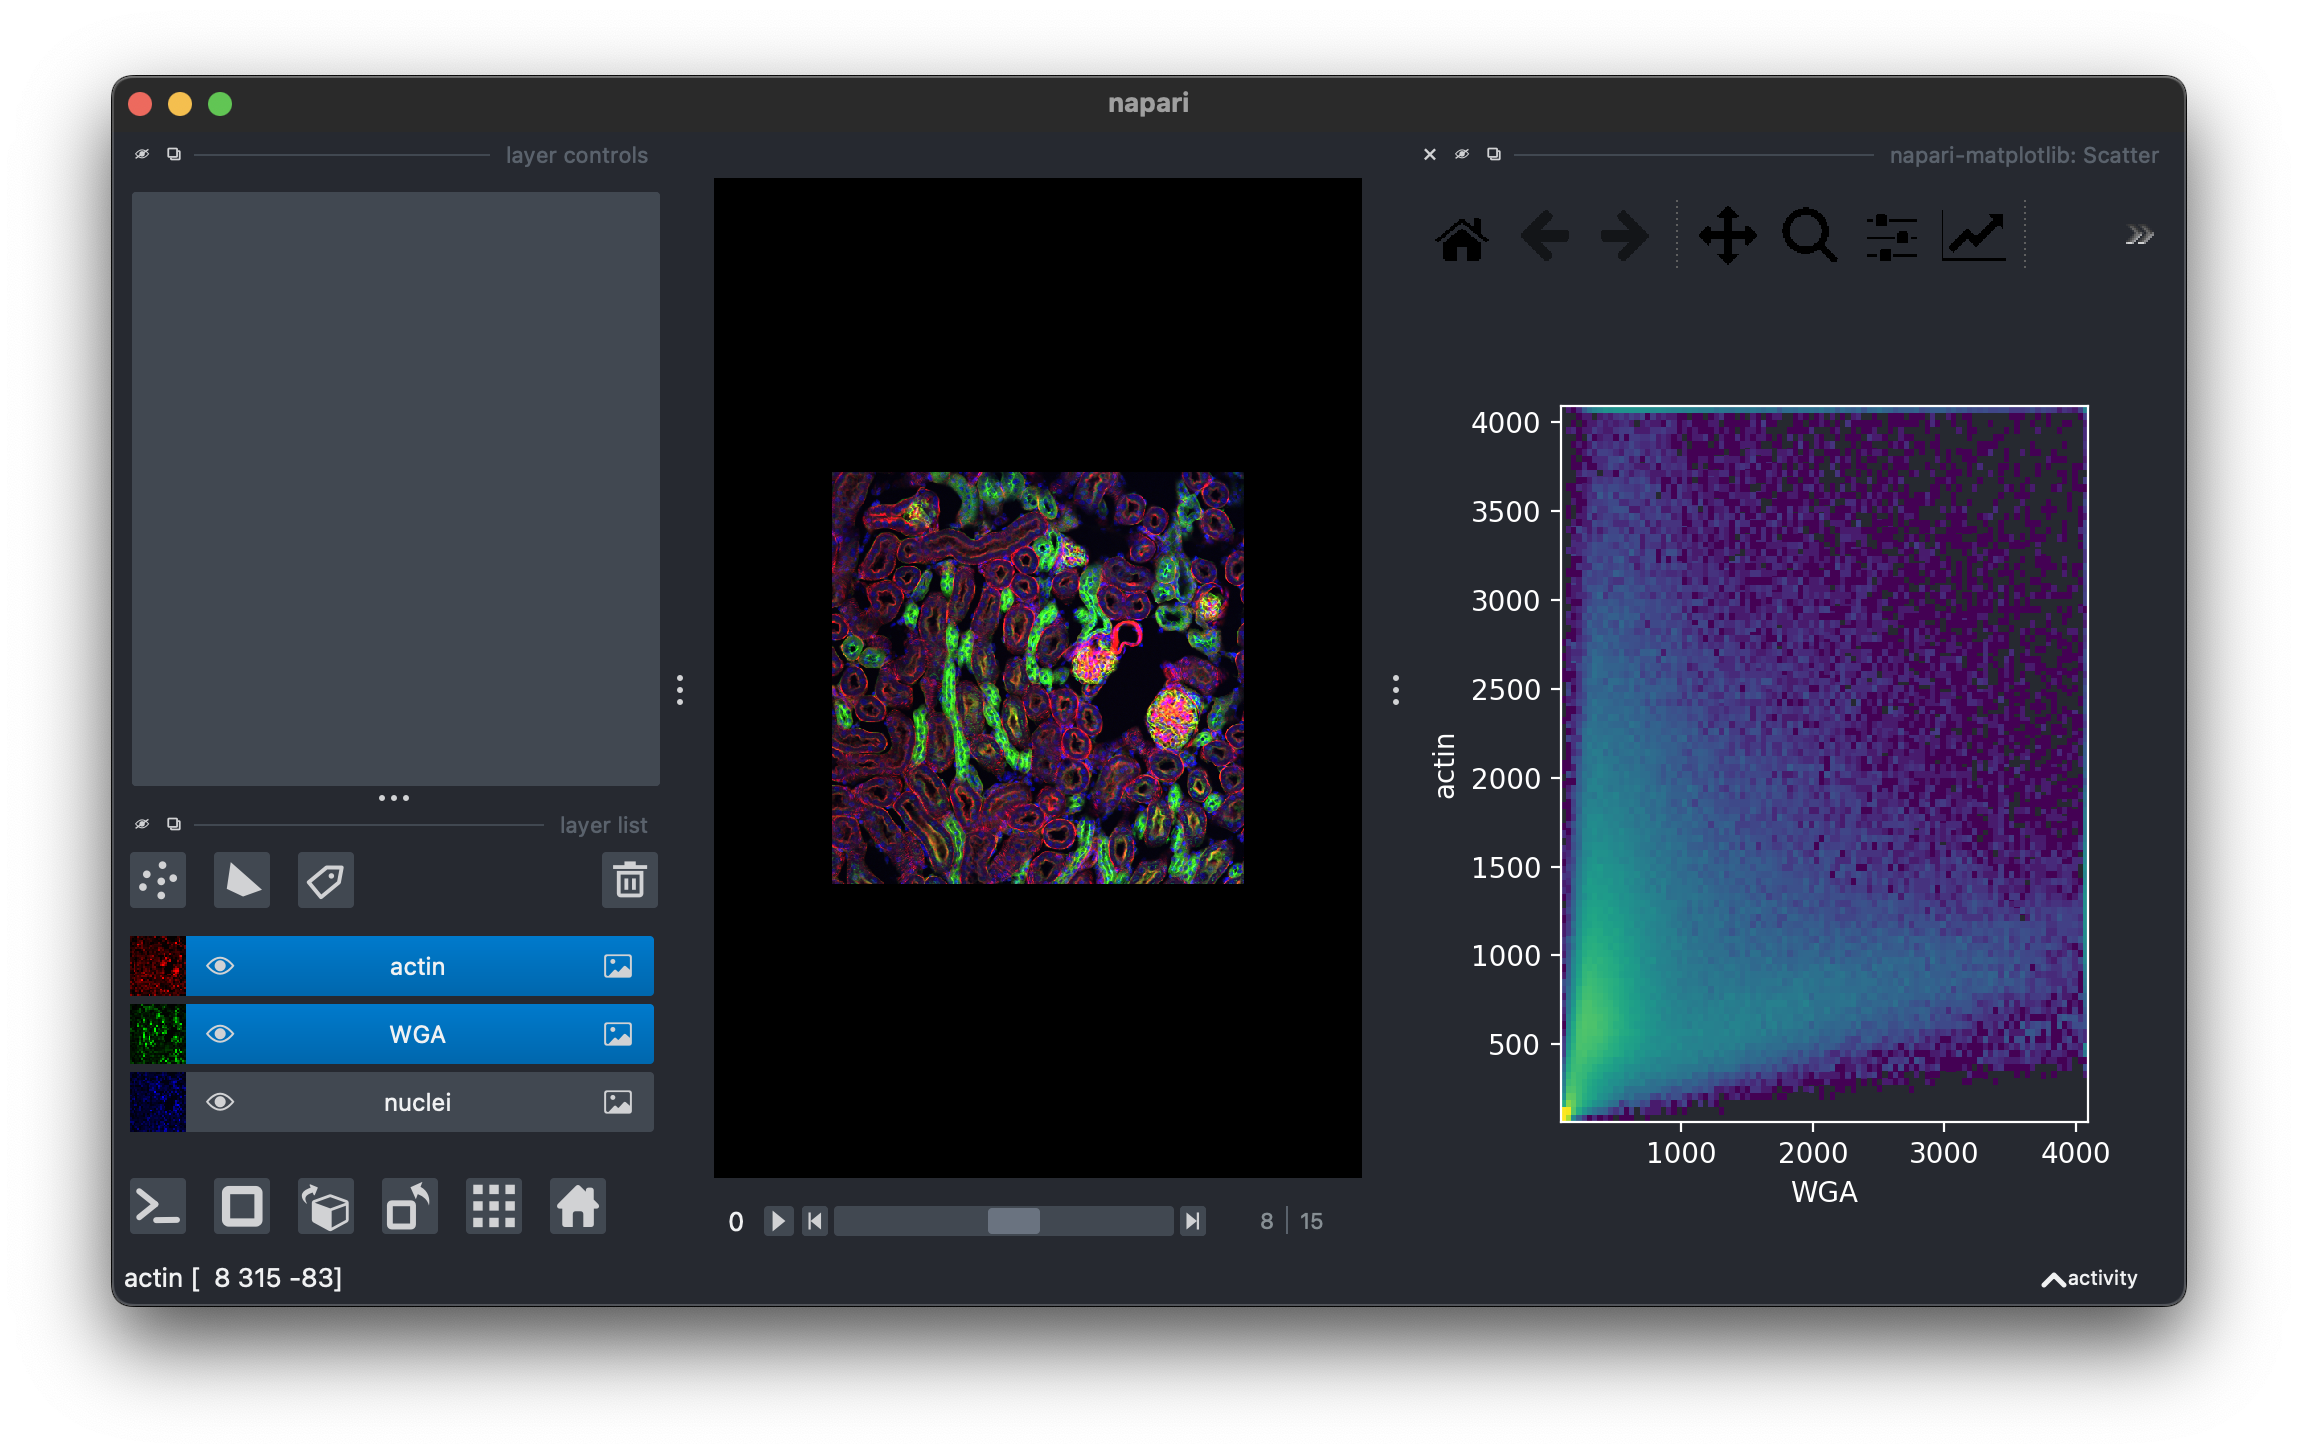
Scatters the values of two similarly sized images layers against each other.
You can install napari-matplotlib via pip:
pip install napari-matplotlib
To install latest development version :
pip install git+https://github.com/dstansby/napari-matplotlib.git
Contributions are very welcome! Tests can be run with tox, please ensure the coverage at least stays the same before you submit a pull request.
Distributed under the terms of the BSD-3 license,
napari-matplotlib is free and open source software.
If you encounter any problems, please file an issue along with a detailed description.