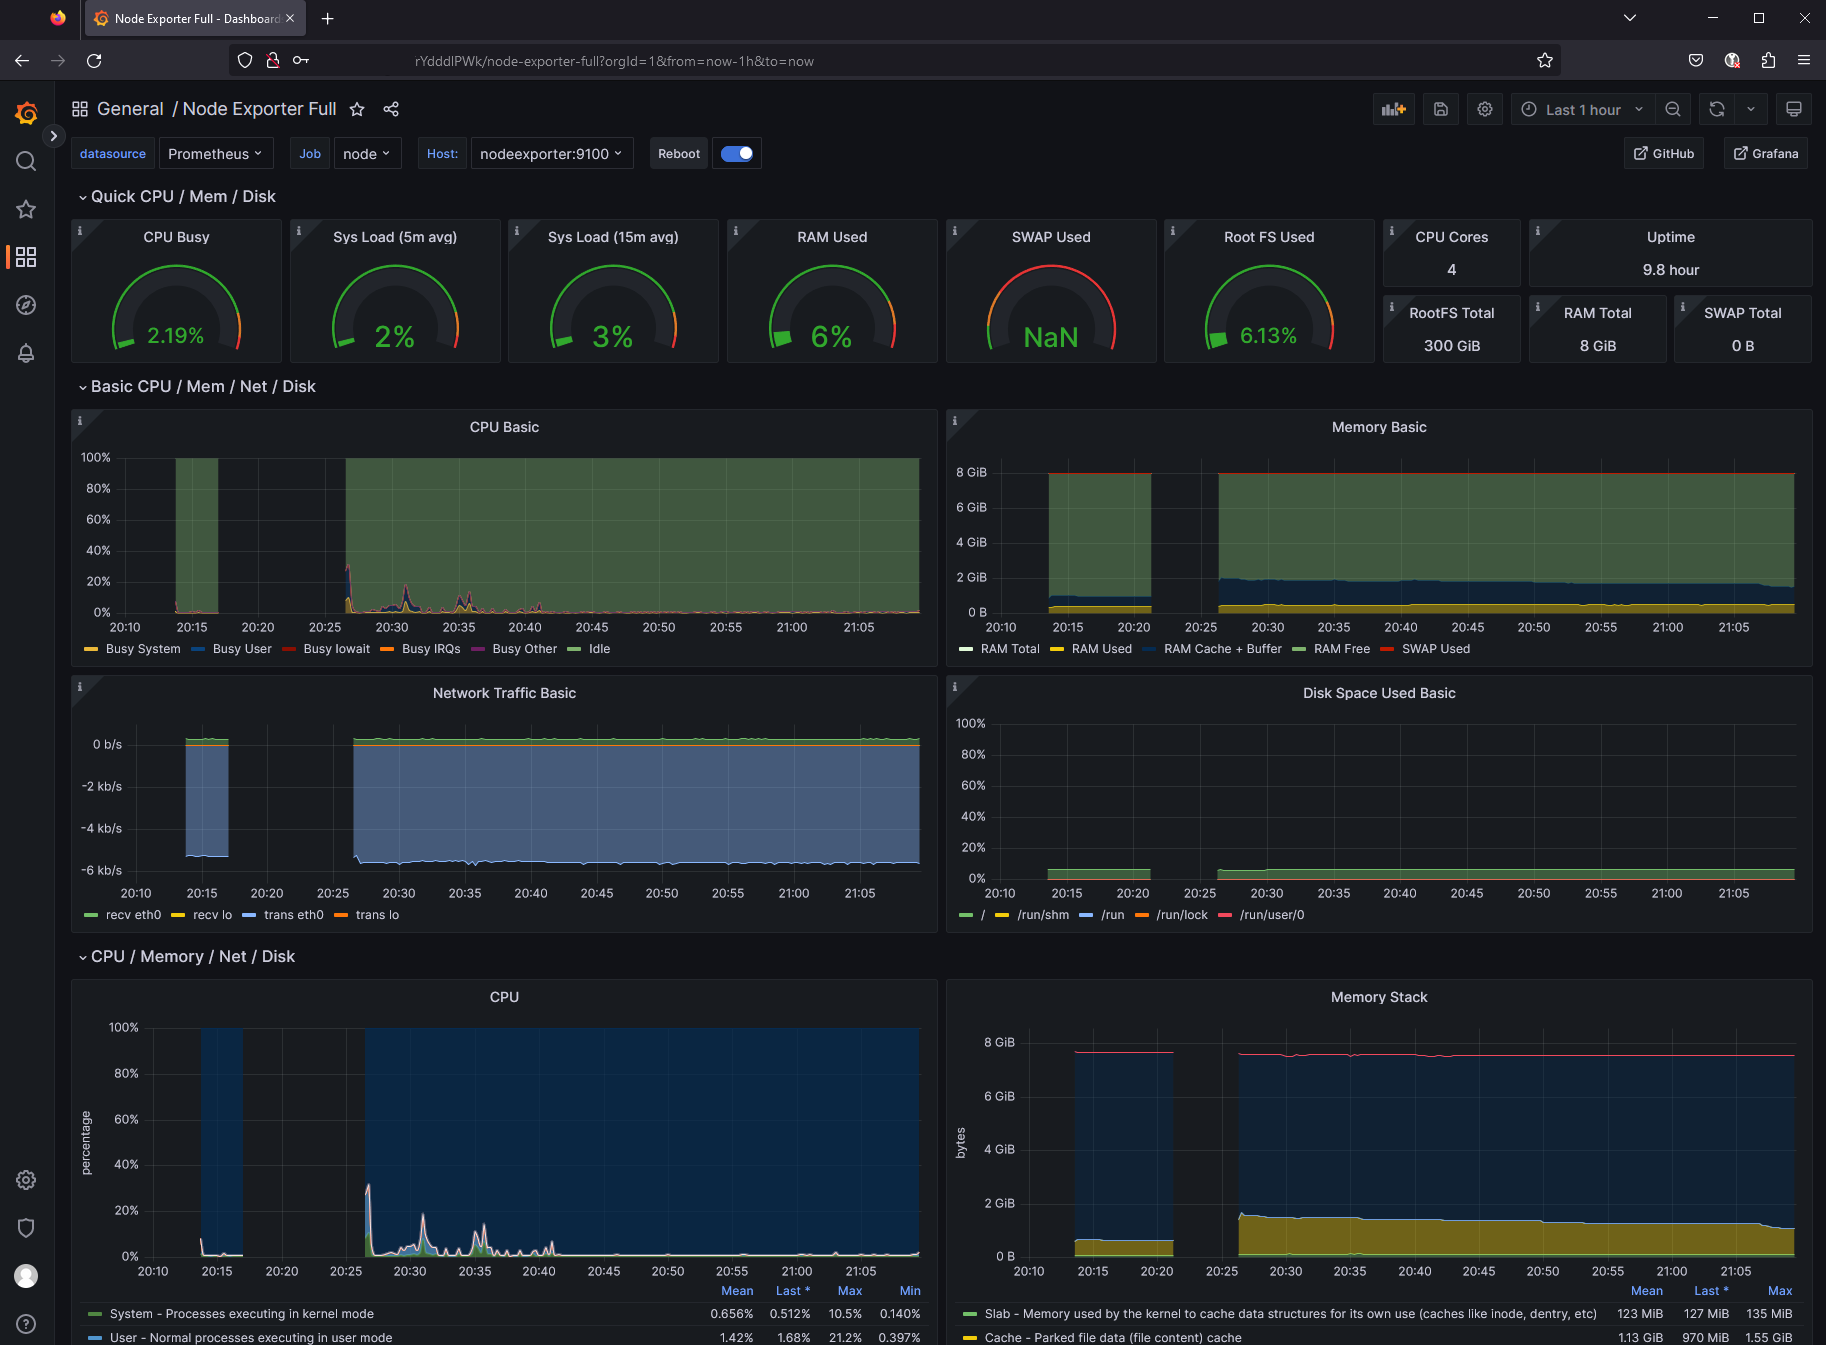
Example of a traefik proxy with monitoring and logs active using:
- node-exporter:v1.6.1
- grafana/promtail:2.9.0
- grafana/loki:2.9.0
- grafana/grafana:10.0.5
- prom/prometheus:v2.47.0
- traefik:2.10.4
- portainer/portainer-ce:2.19.0
Note: This is not a production ready setup. Its missing the whole HTTPS, letsencript and non-root-docker part. It is just a example of how to use traefik with monitoring and logs with all the current versions of the used tools fitting well together (what was kind of a hassle 👼).
- Clone this repo
- Copy or rename the file
example.envto.env - Start the infrastructure and two sample apps
docker-compose -f proxy-docker-compose.yml up -d
docker-compose -f apps-docker-compose.yml up -d-
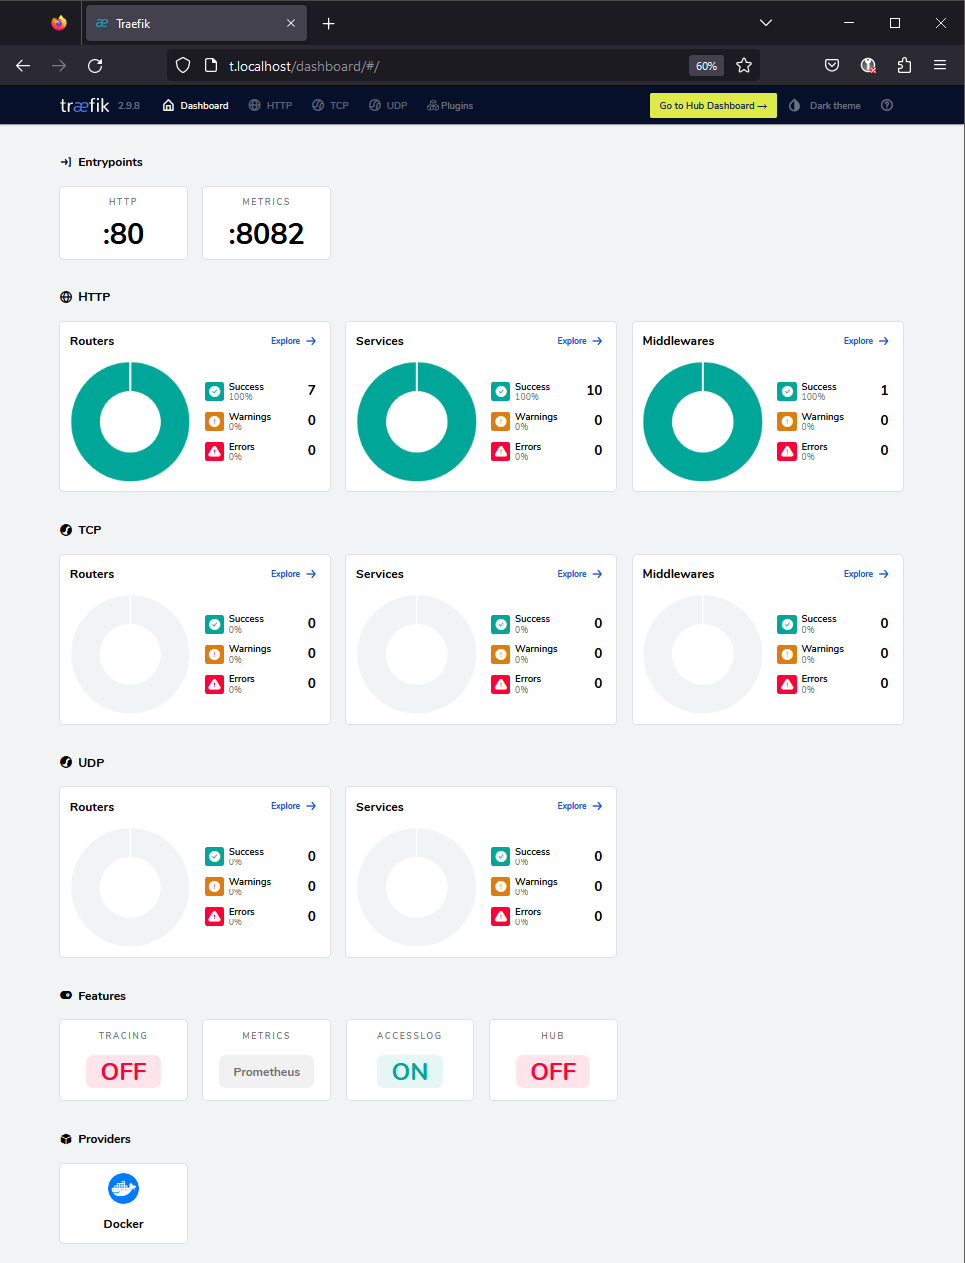
Open the traefik dashboard at http://t.localhost using the credentials username:admin and password:admin
-
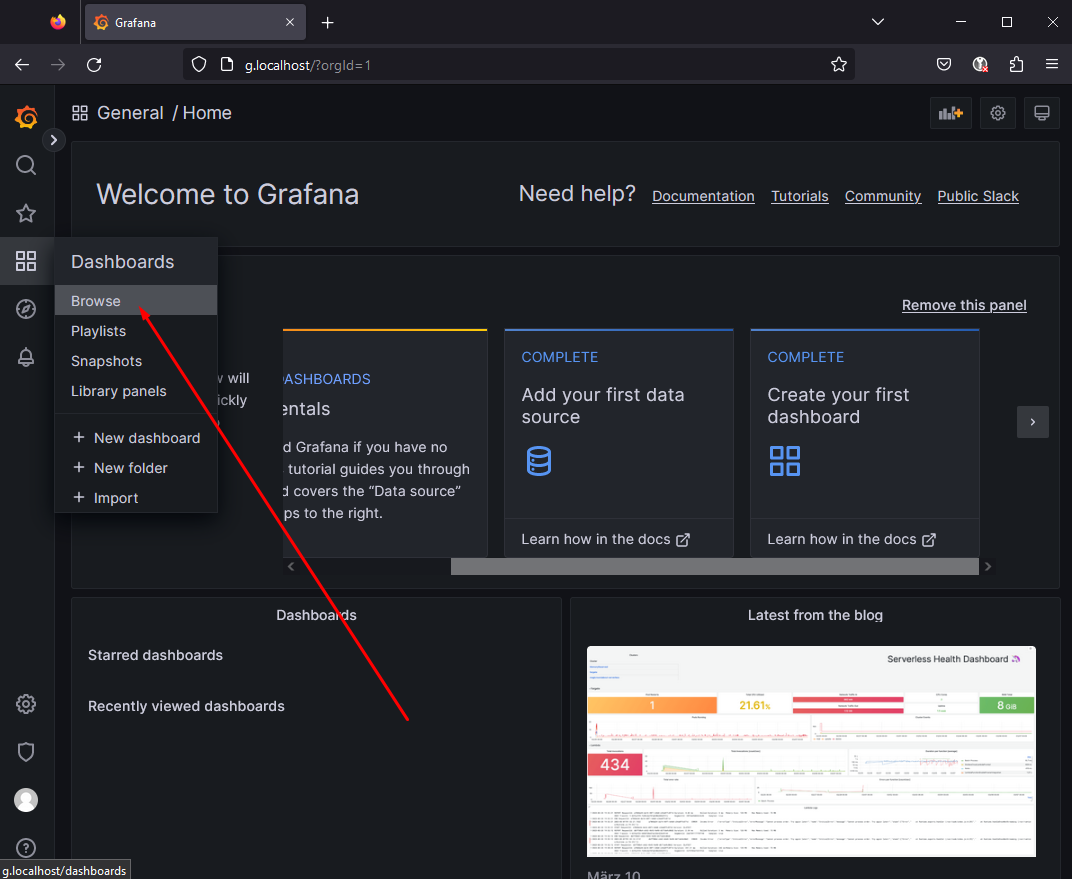
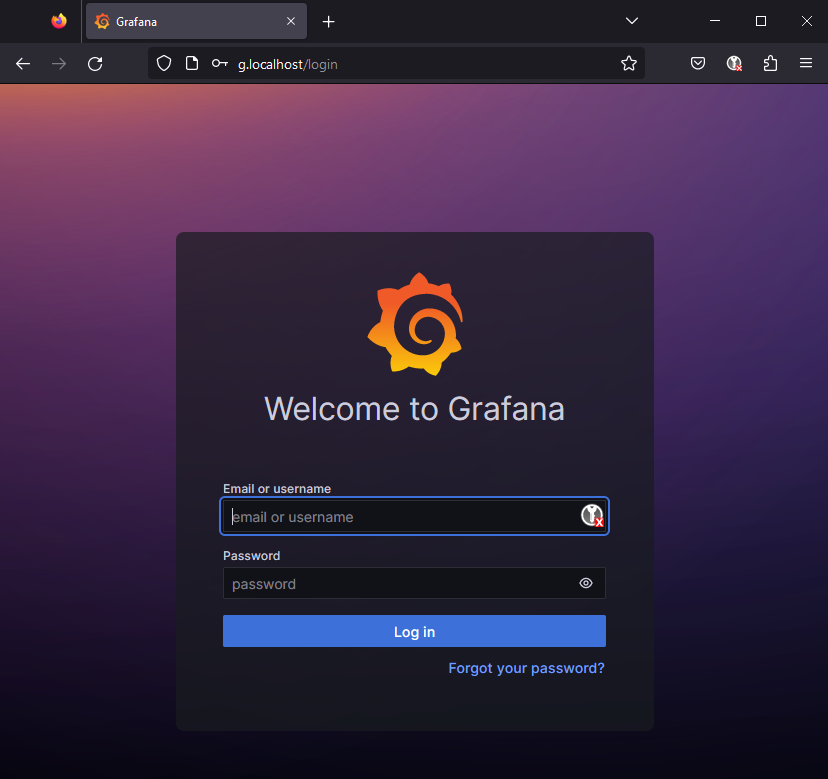
Open the grafana dashboard to see all the dashboards at http://g.localhost using the credentials admin/admin, then set a new password also with credentials admin/admin
-
Open the sample apps at http://web1.localhost and http://web2.localhost
-
Maybe create some sample data and errors for the dashboard to show by visiting http://web1.localhost/error and http://web2.localhost/error
I used many parts from a lot of diffent souces including the documentation of most of the projects. I you feel, like i missed to mention you, please let me know.
This is free and unencumbered software released into the public domain. For more information, please refer to https://unlicense.org
Proxy traefik:
We see, that the modules for metrics and logs are active and see that we have 10 services running and 7 routers.
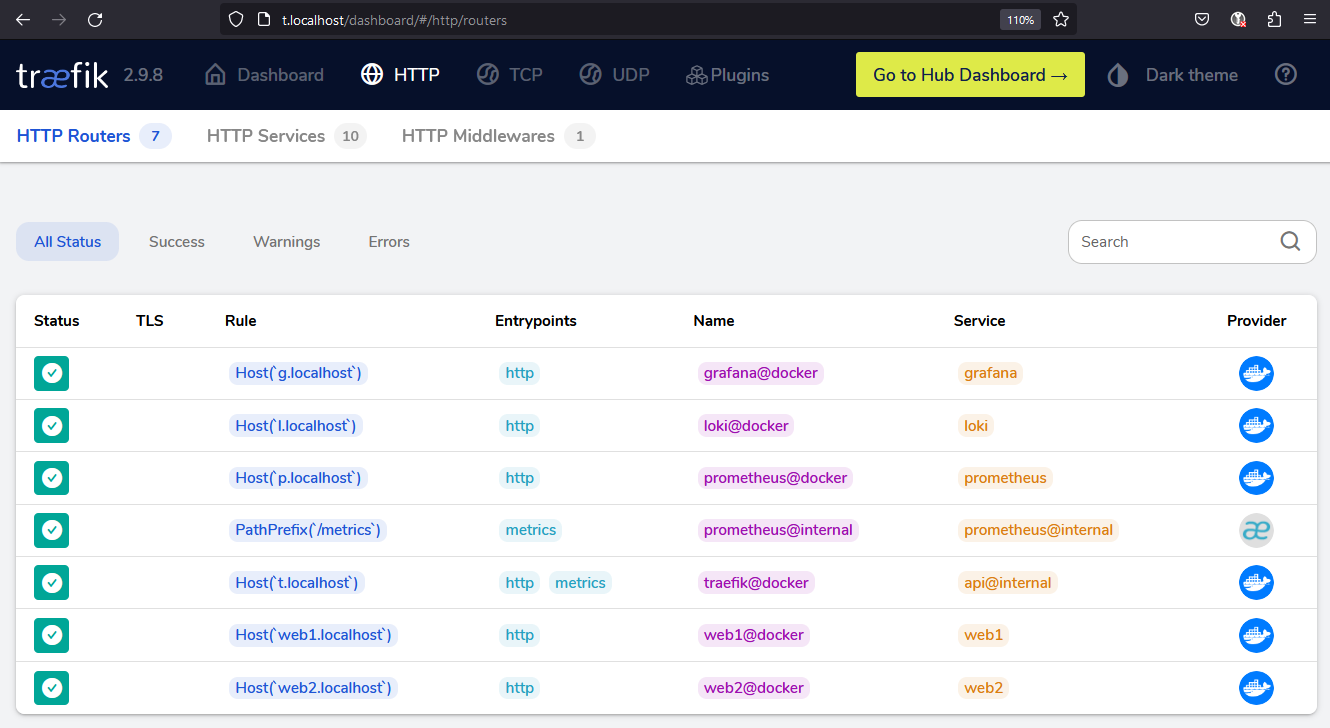
Here we see all the available routes:
Dashboard Grafana:
After you passed the basic-auth with admin/admin you can set a new password for the admin user in Grfana.
Find HTTP status codes from all the services:
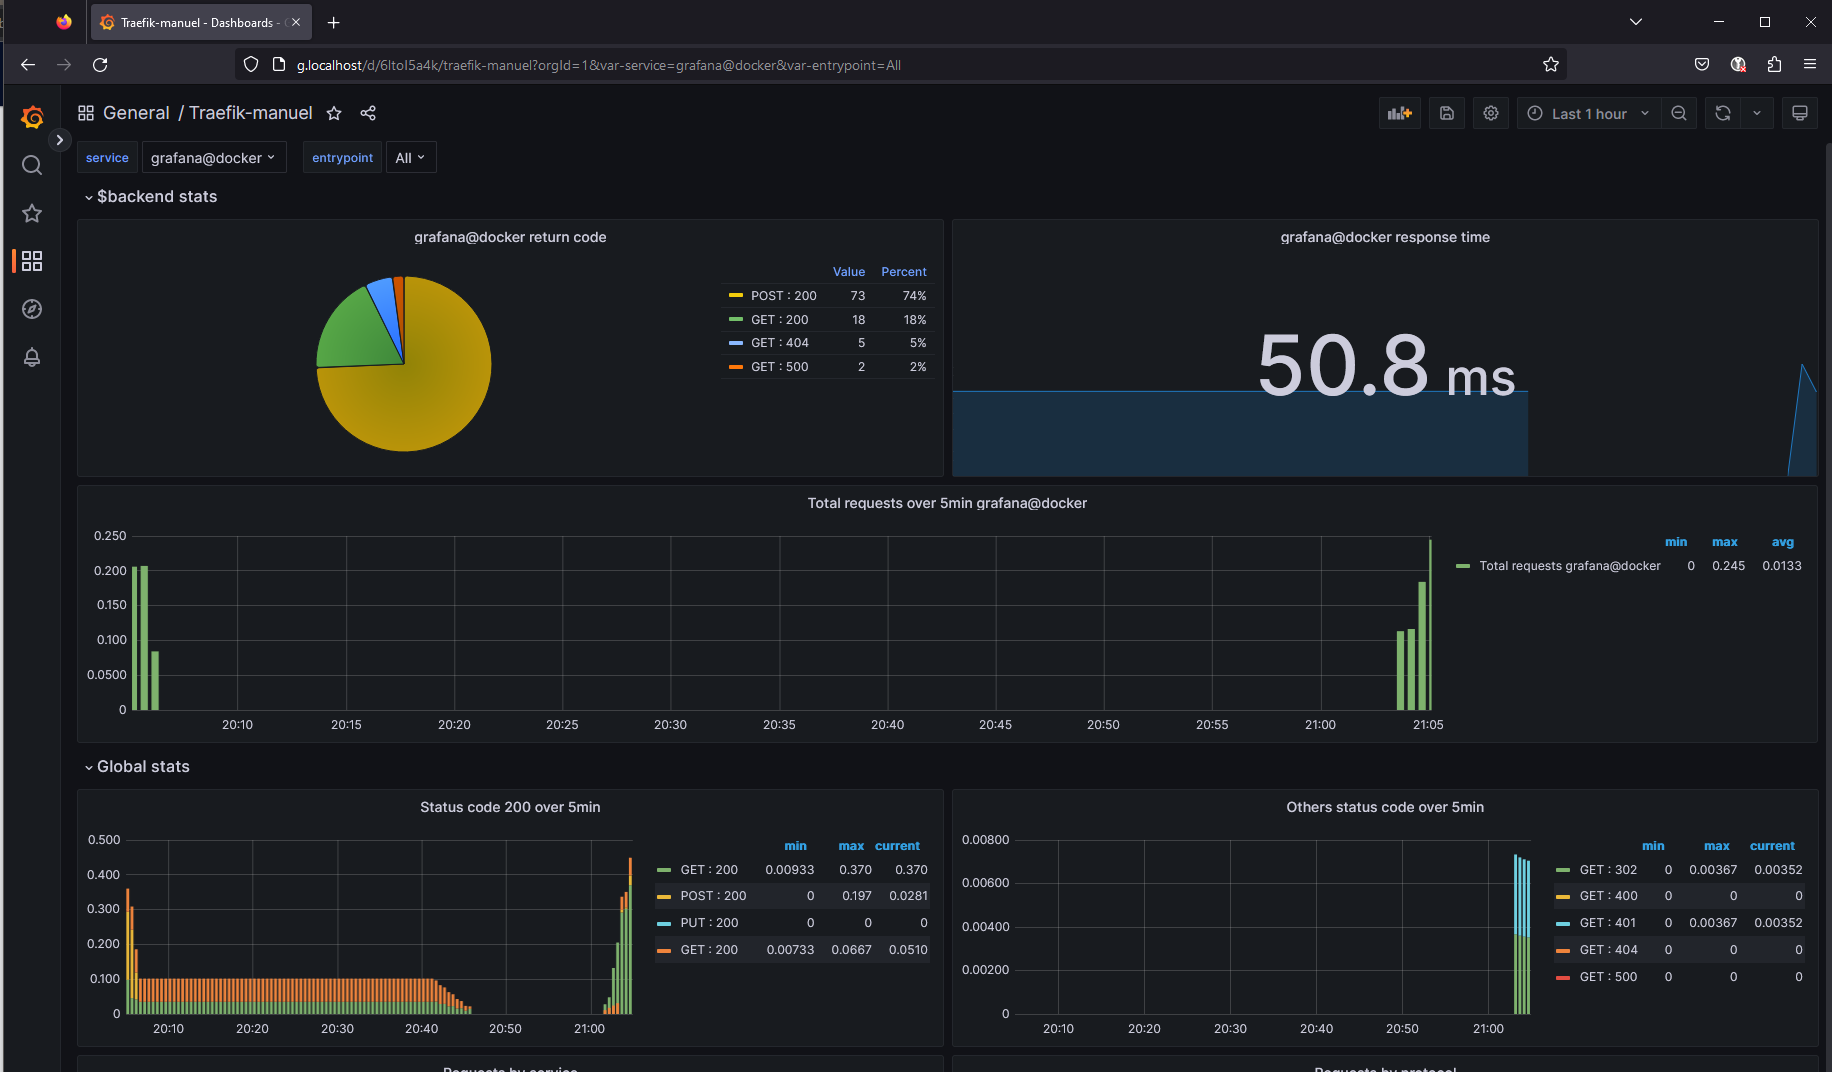
More on the HTTP status codes:
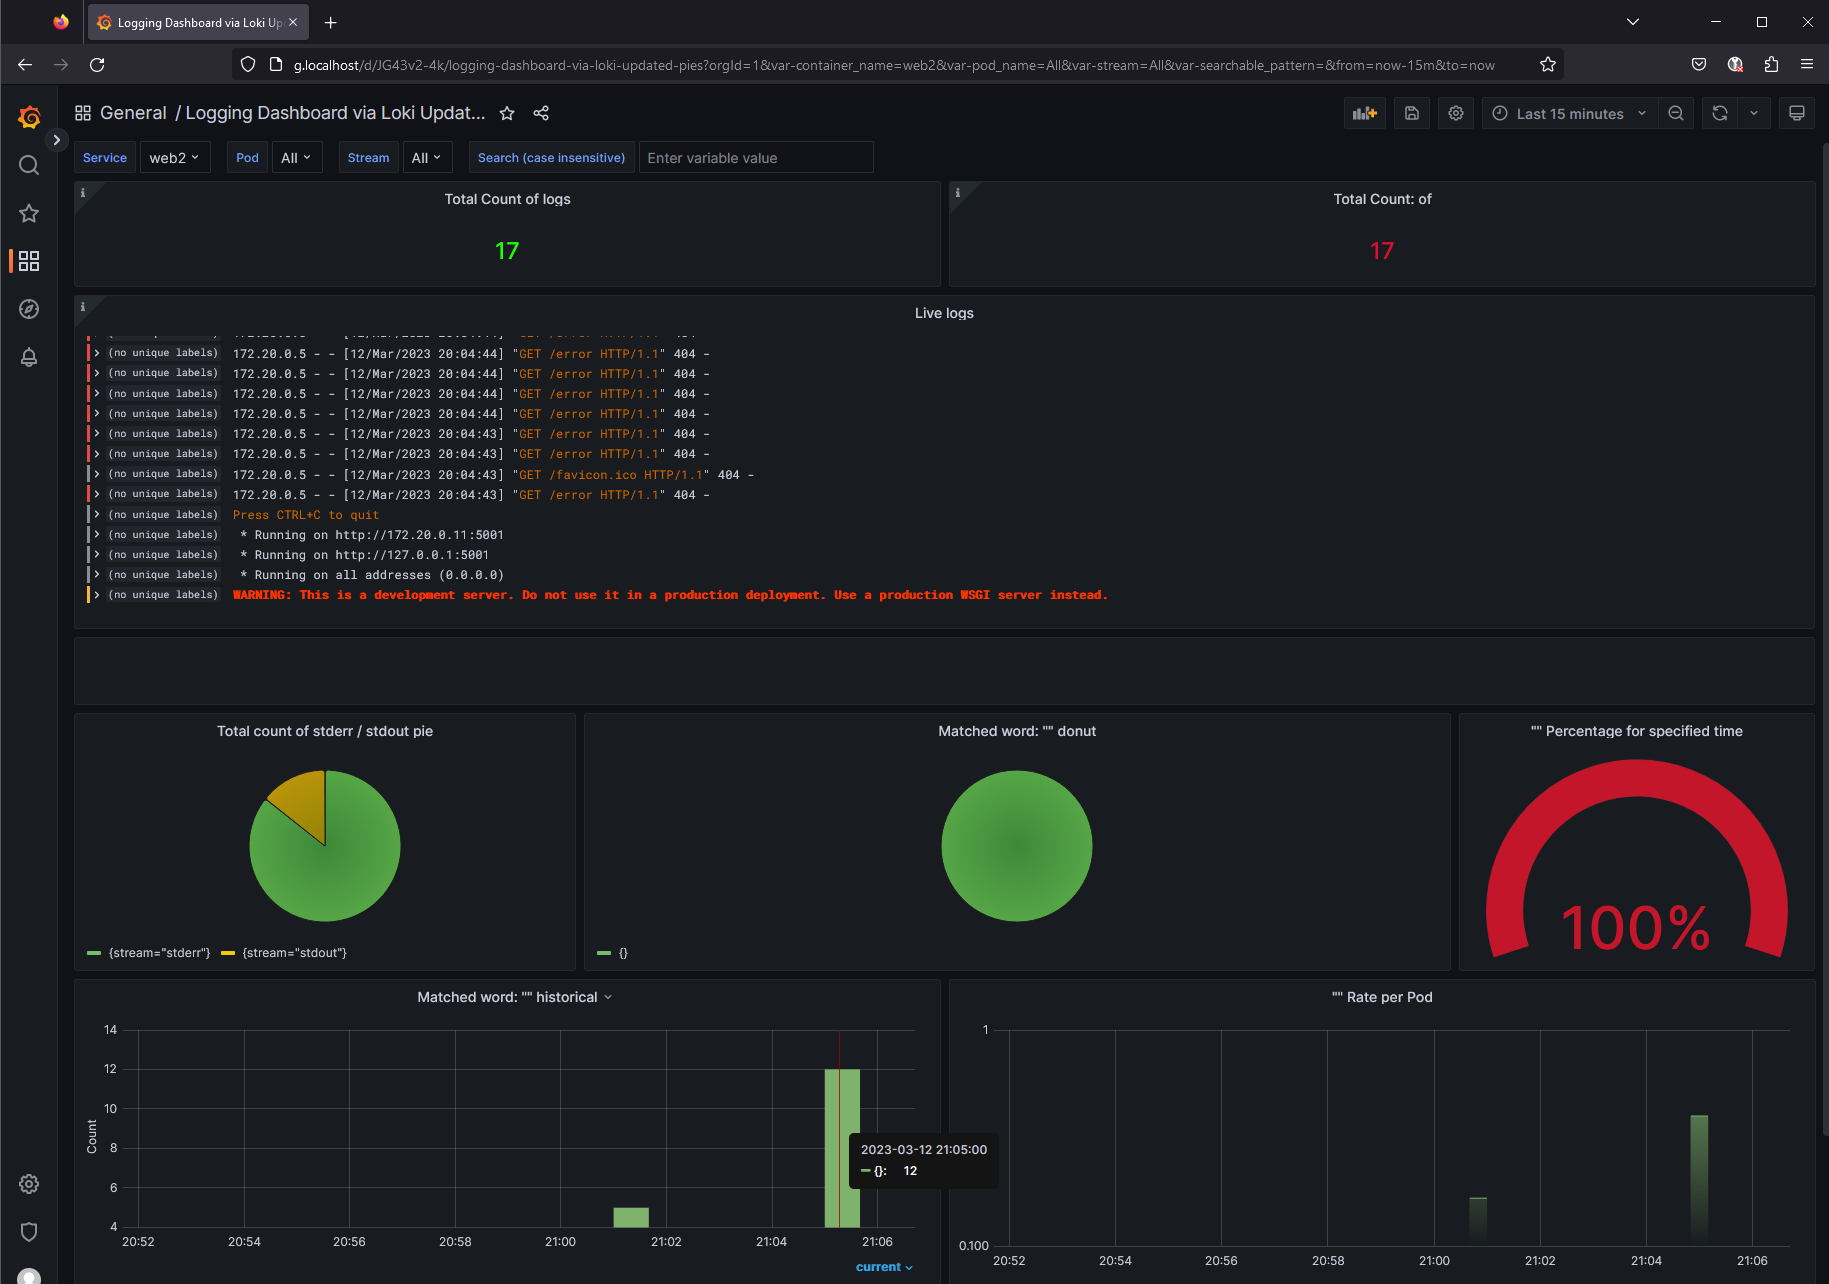
And find the logs of all the running docker services:
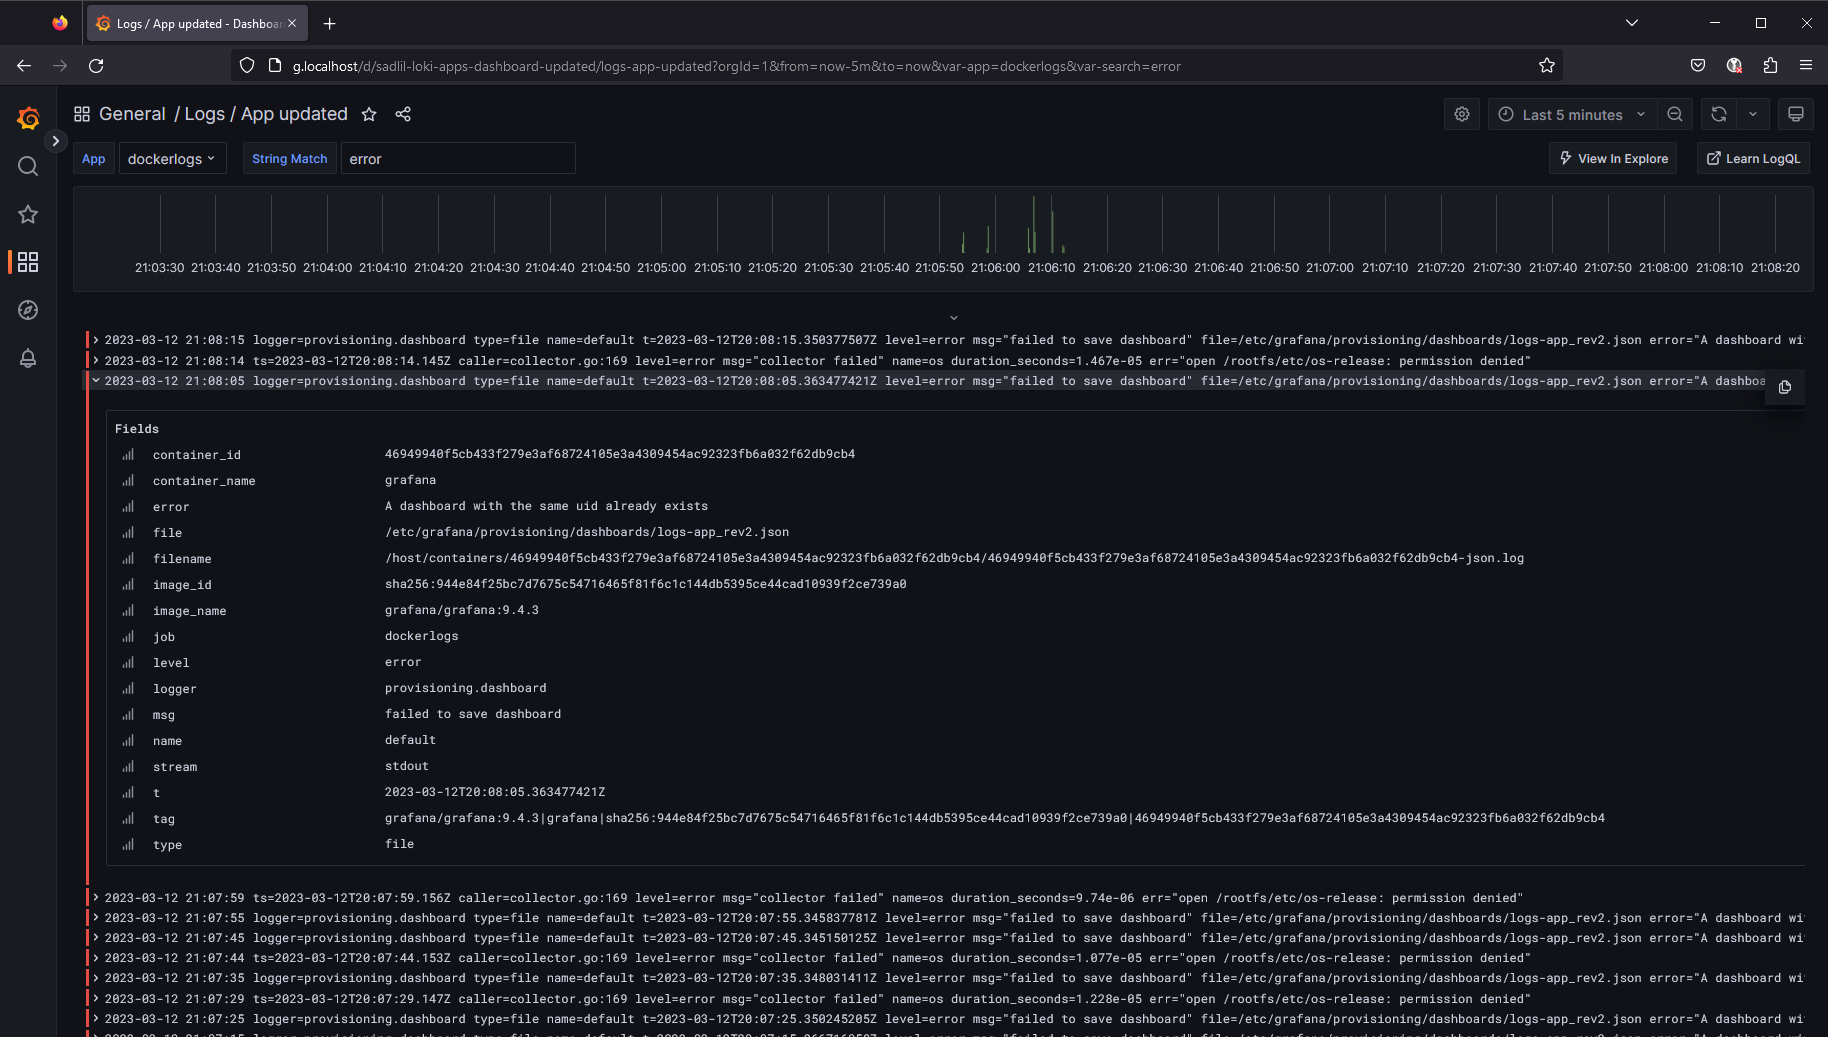
If you run this on a linux system, you can also see the system metrics:
