Demo: http://85.217.171.57:6006/#projector (you might need to refresh the page a few times to load the content).
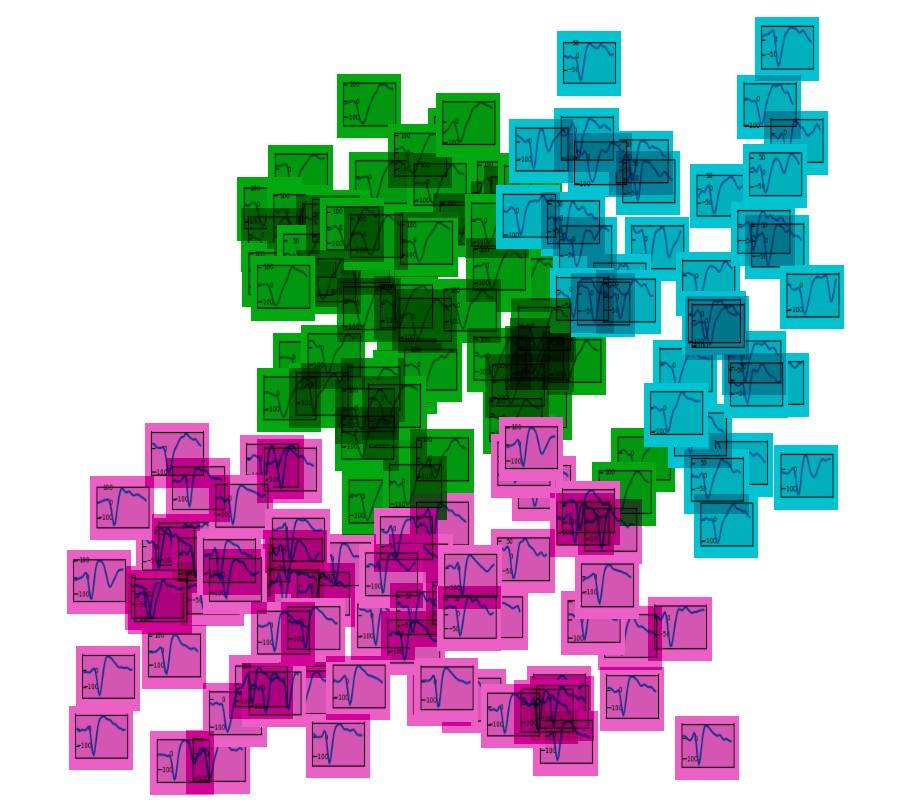
Ever wonder how the spike waveforms of your electrophysiological recordings look like in the context of the applied spike sorting? TensorBoard can visualize waveform samples in the PCA space such that you can pick individual waveforms and compare them with the waveforms of the same and other units (neurons) recorded on the same electrode of the recording.
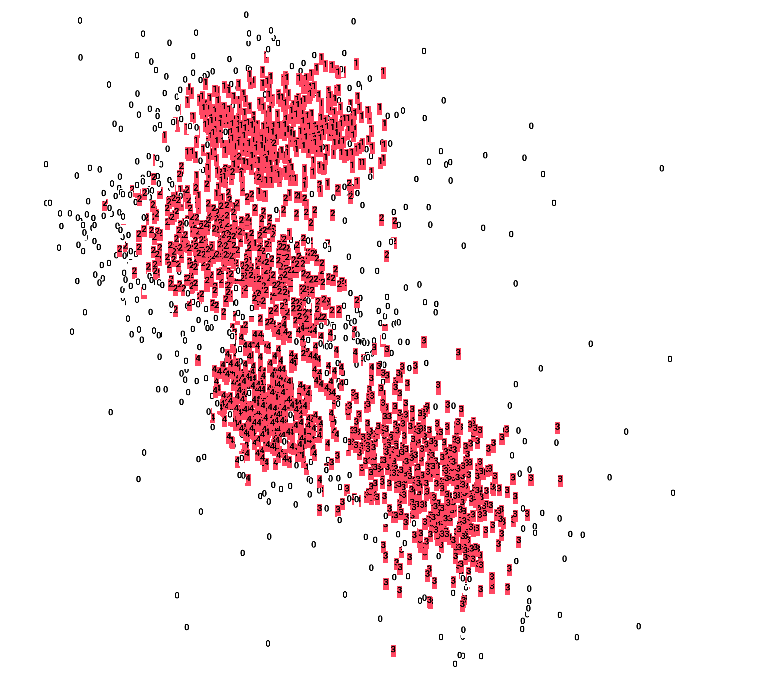
In this demo, we illustrate the approach using channel 79 of Utah array in monkey N recordings in macaque motor cortex published in [1]. 2500 waveforms of all 5 units, including the noise cluster ID 0, that are found in this channel are randomly selected and shown.
To run the demo locally, you need to have Python 3.6+ installed, download the multielectrode_grasp dataset (see the References) to a separate folder and move the datasets folder to the root of this repository. Then run the following commands in a terminal:
pip install -r requirements.txtpython visualize.pytensorboard --logdir=runs- Open http://localhost:6006 in your browser.
Navigating to http://localhost:6006 should redirect you to http://localhost:6006/#projector (only the projector tab is filled with information).
Once in the projector tab, click on the button A  on the top panel to turn images off and show the labels (unit IDs) only.
Noise waveforms, i.e., waveforms that are not a clear single or multiunit, are labeled as unit 0. Let's filter them out by clicking on the regex button .*  and typing
 [1-9] to select non-zero units only. This will highlight the chosen samples in red.
Click Isolate xxx points. Finally, click on the button A again to turn the images on. Explore the waveforms.
Try playing with different visualization methods - PCA, T-SNE, and UMAP. You can turn the colors on and off by clicking on the "Color by" button on the left panel.
- Massively parallel recordings in macaque motor cortex during an instructed delayed reach-to-grasp task, Scientific Data, 5, 180055. Data link: https://gin.g-node.org/INT/multielectrode_grasp

