⚠️ This package is broken (R v4.2). Instead please use ggh4x and see teunbrand/ggh4x#94 how to achieve the grouping behavior. The remainder of this README is kept for reference.
gggroupedscale is a ggplot2
extensions to easily group categorical variables without resorting to
facets.
For similar functionality, check out the
guide_axis_nested
function in the ggh4x
package.
You can install the released version of gggroupedscale from Github with:
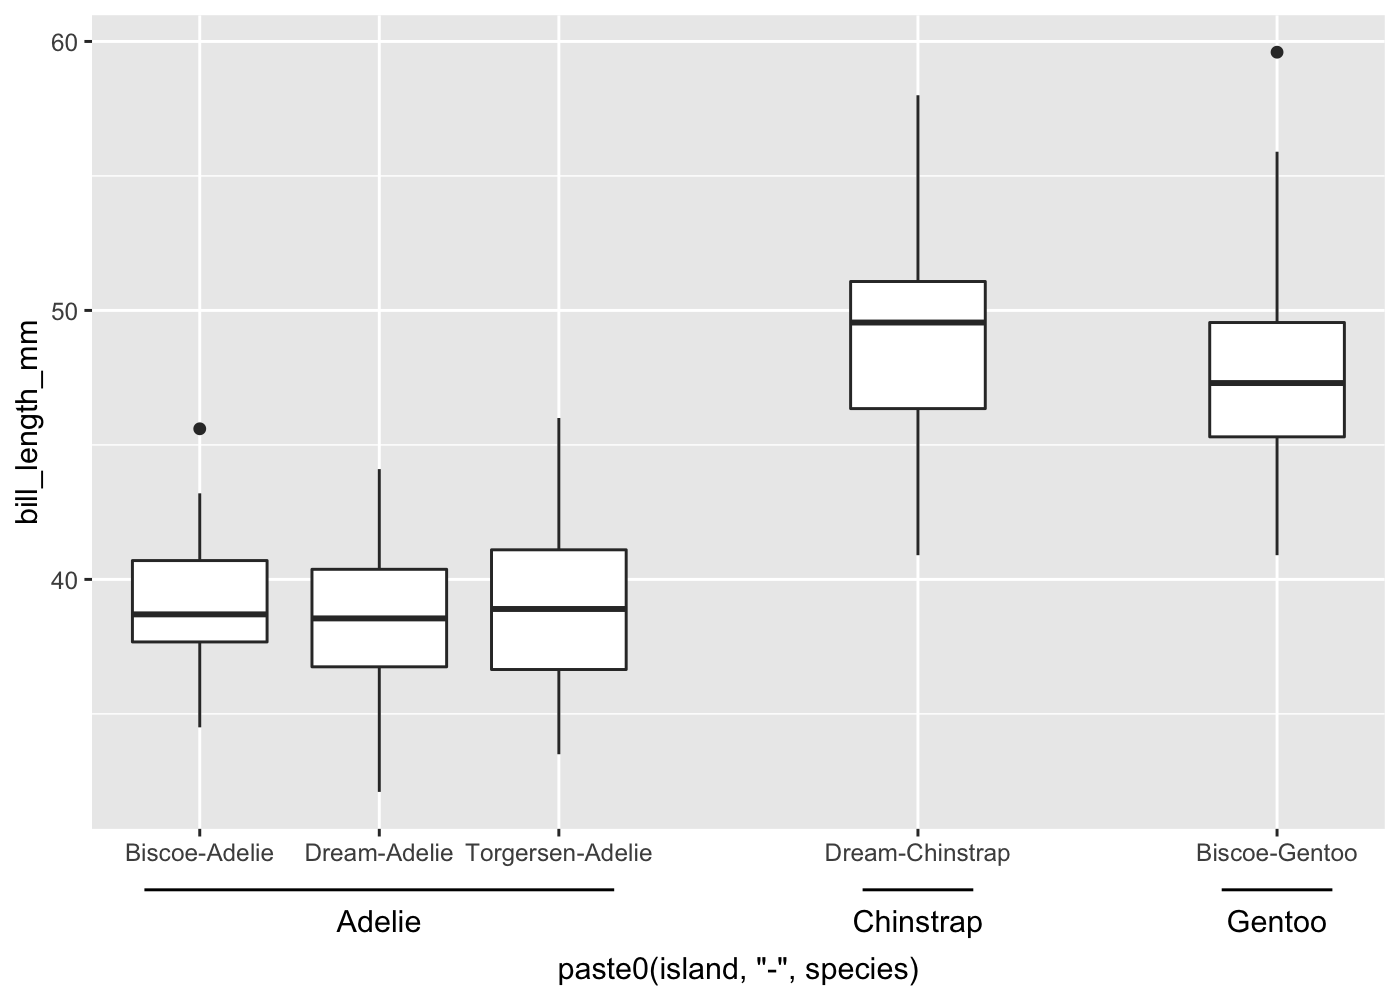
devtools::install_github("const-ae/gggroupedscale")I plot the bill_length_mm of the palmer penguins for the different
combinations of species and island. The breaks on the x-axis are grouped
by island
library(ggplot2)
library(gggroupedscale)
library(palmerpenguins)

ggplot(penguins,
       aes(x = paste0(island, "-", species), y = bill_length_mm)) +
  geom_boxplot() +
  scale_x_grouped_discrete(grouping = function(x){
    sapply(strsplit(x, split = "-"), function(.x) .x[1])
  }, gap_size = 1, add_group_label = TRUE)
#> Warning: Removed 2 rows containing non-finite values (stat_boxplot).
Setting add_group_label = FALSE suppresses the additional labels
ggplot(penguins,
       aes(x = paste0(island, "-", species), y = bill_length_mm)) +
  geom_boxplot() +
  scale_x_grouped_discrete(grouping = function(x){
    sapply(strsplit(x, split = "-"), function(.x) .x[1])
  }, gap_size = 1, add_group_label = FALSE)
#> Warning: Removed 2 rows containing non-finite values (stat_boxplot).
You can also define the grouping using a regular vector or a formula style function
ggplot(penguins, aes(x = paste0(island, "-", species), y = bill_length_mm)) +
  geom_boxplot() +
  scale_x_grouped_discrete(grouping = c("A", "B", "A", "B", "C"), add_group_label = TRUE)
#> Warning: Removed 2 rows containing non-finite values (stat_boxplot).ggplot(penguins, aes(x = paste0(island, "-", species), y = bill_length_mm)) +
geom_boxplot() +
scale_x_grouped_discrete(grouping = ~ stringr::str_split_fixed(.x, "-", n=2)[,2],
gap_size = 1, add_group_label = TRUE)
#> Warning: Removed 2 rows containing non-finite values (stat_boxplot).The grouping also works for the y-axis
ggplot(penguins, aes(x = bill_length_mm, y = paste0(island, "-", species))) +
  geom_boxplot() +
  scale_y_grouped_discrete(grouping = function(x){
    sapply(strsplit(x, split = "-"), function(.x) .x[1])
  }, gap_size = 0.8, add_group_label = TRUE) +
  labs(y = "")
#> Warning: Removed 2 rows containing non-finite values (stat_boxplot).Note that this is not a polished package. For example, the package uses
internal functions from ggplot2 and has a hack to extend the range, so
it might break with any new release of ggplot2. However, it seems to
get the job done, so it’s good enough for me. I am currently not
planning to submit to CRAN and it should probably be rather added to one
of the existing ggplot extension packages that provide custom scales.
sessionInfo()
#> R version 4.1.1 (2021-08-10)
#> Platform: x86_64-apple-darwin17.0 (64-bit)
#> Running under: macOS Big Sur 10.16
#>
#> Matrix products: default
#> BLAS:   /Library/Frameworks/R.framework/Versions/4.1/Resources/lib/libRblas.0.dylib
#> LAPACK: /Library/Frameworks/R.framework/Versions/4.1/Resources/lib/libRlapack.dylib
#>
#> locale:
#> [1] en_US.UTF-8/en_US.UTF-8/en_US.UTF-8/C/en_US.UTF-8/en_US.UTF-8
#>
#> attached base packages:
#> [1] stats     graphics  grDevices utils     datasets  methods   base
#>
#> other attached packages:
#> [1] palmerpenguins_0.1.0 gggroupedscale_0.0.3 ggplot2_3.3.5
#>
#> loaded via a namespace (and not attached):
#>  [1] highr_0.9        pillar_1.6.2     compiler_4.1.1   tools_4.1.1
#>  [5] digest_0.6.27    evaluate_0.14    lifecycle_1.0.0  tibble_3.1.4
#>  [9] gtable_0.3.0     pkgconfig_2.0.3  rlang_0.4.11     DBI_1.1.1
#> [13] yaml_2.2.1       xfun_0.26        fastmap_1.1.0    withr_2.4.2
#> [17] stringr_1.4.0    dplyr_1.0.7      knitr_1.34       generics_0.1.2
#> [21] vctrs_0.3.8      grid_4.1.1       tidyselect_1.1.1 glue_1.4.2
#> [25] R6_2.5.1         fansi_0.5.0      rmarkdown_2.11   farver_2.1.0
#> [29] purrr_0.3.4      magrittr_2.0.1   scales_1.1.1     ellipsis_0.3.2
#> [33] htmltools_0.5.2  assertthat_0.2.1 colorspace_2.0-2 labeling_0.4.2
#> [37] utf8_1.2.2       stringi_1.7.4    munsell_0.5.0    crayon_1.4.1


