( ⌛ If some animations are not loaded, try to refresh the page. 🔁 )
On this page, I would like to share my approach to designing routes for outdoor activities like hike, run or cycling.
- Written in 2023: the showcased features may well become outdated or improved over time.
- Not exhaustive: be sure to visit the missing tools section.
- Perhaps you are already aware of existing alternatives, or you have ideas and time to create solution, in which case please check the Your suggestions section. 🙏
1) get inspiration
2) connect the dots
3) check and adjust
My favourite sections are marked with ⭐.
- Essential tools
- [1] Get inspired
- [2] Draft
- [3] Check and adjust
- Conclusion
Before I begin, I would like to briefly introduce two key tools, which will be used in the following sections:
komootstrava global heatmap
The majority of the showcased features are accessible with a basic free account. 😃
Disclaimer: It is worth noting that while I find some of their tools fascinating, I do not have any vested interest in promoting komoot and strava.
Click to expand
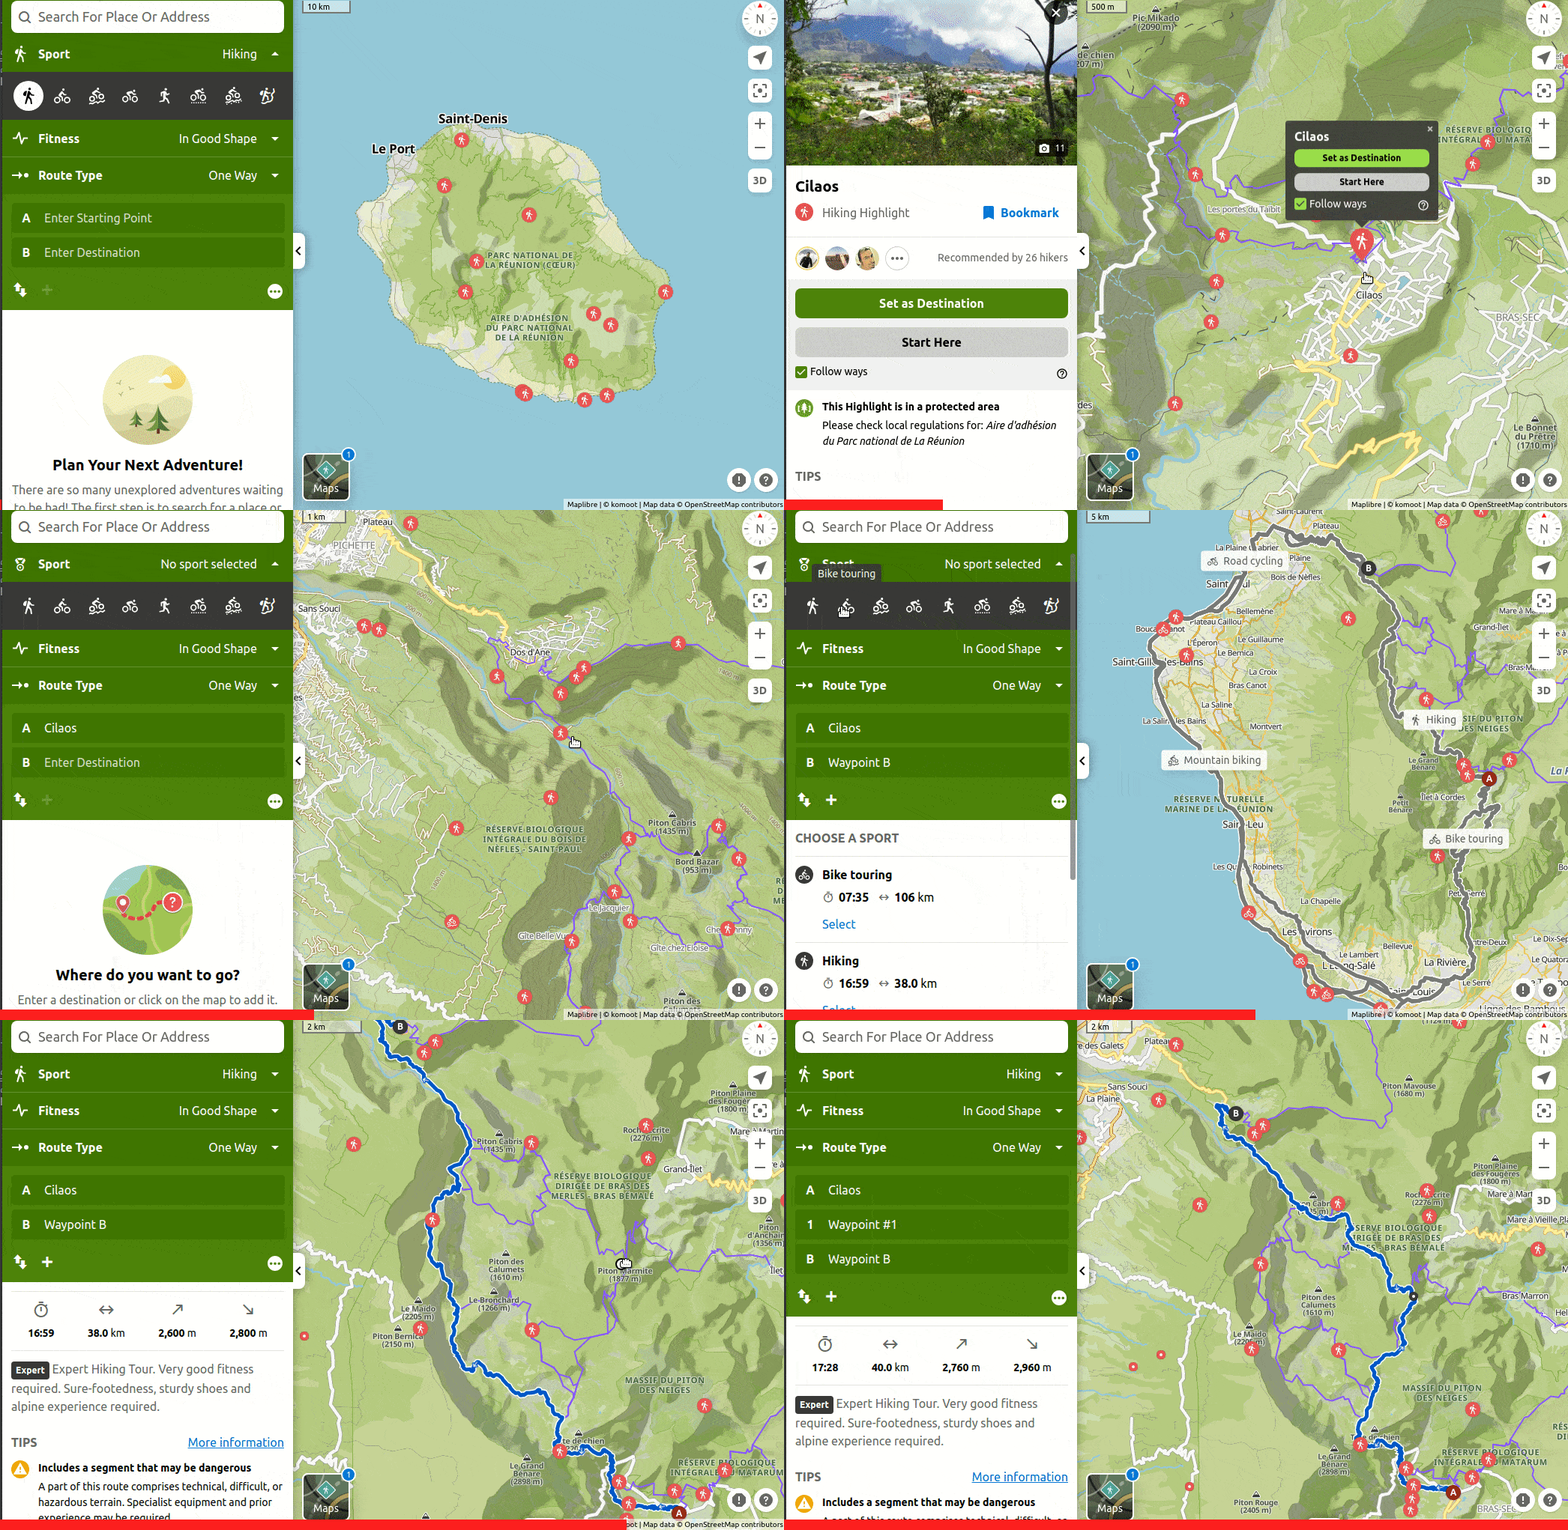
komoot is a comprehensive route planning and navigation app, available on both web and mobile platforms.
In their own words: "our technology allows everybody to better find, plan and live authentic outdoor experiences."
 |
|---|
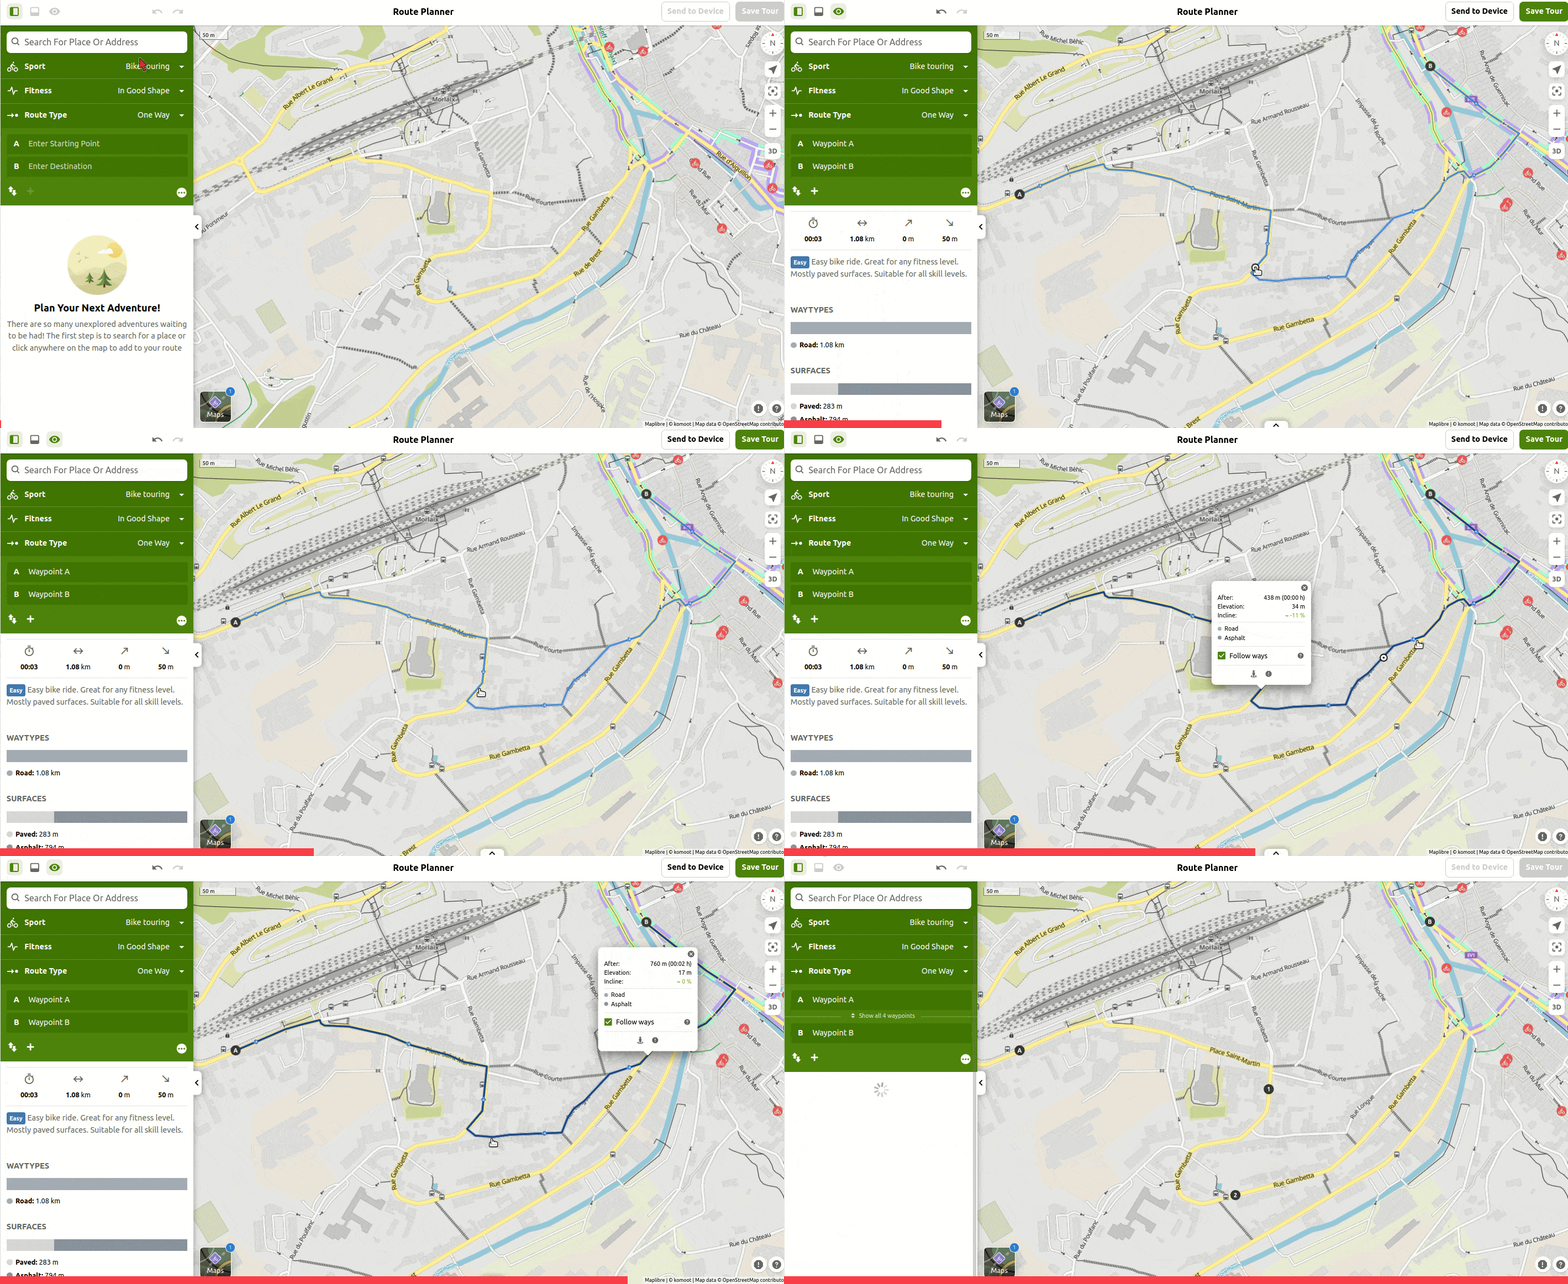
komoot provides a wide range of features. Here is a brief example of how to easily draw a (albeit long 😅) hiking route. |
Click to expand
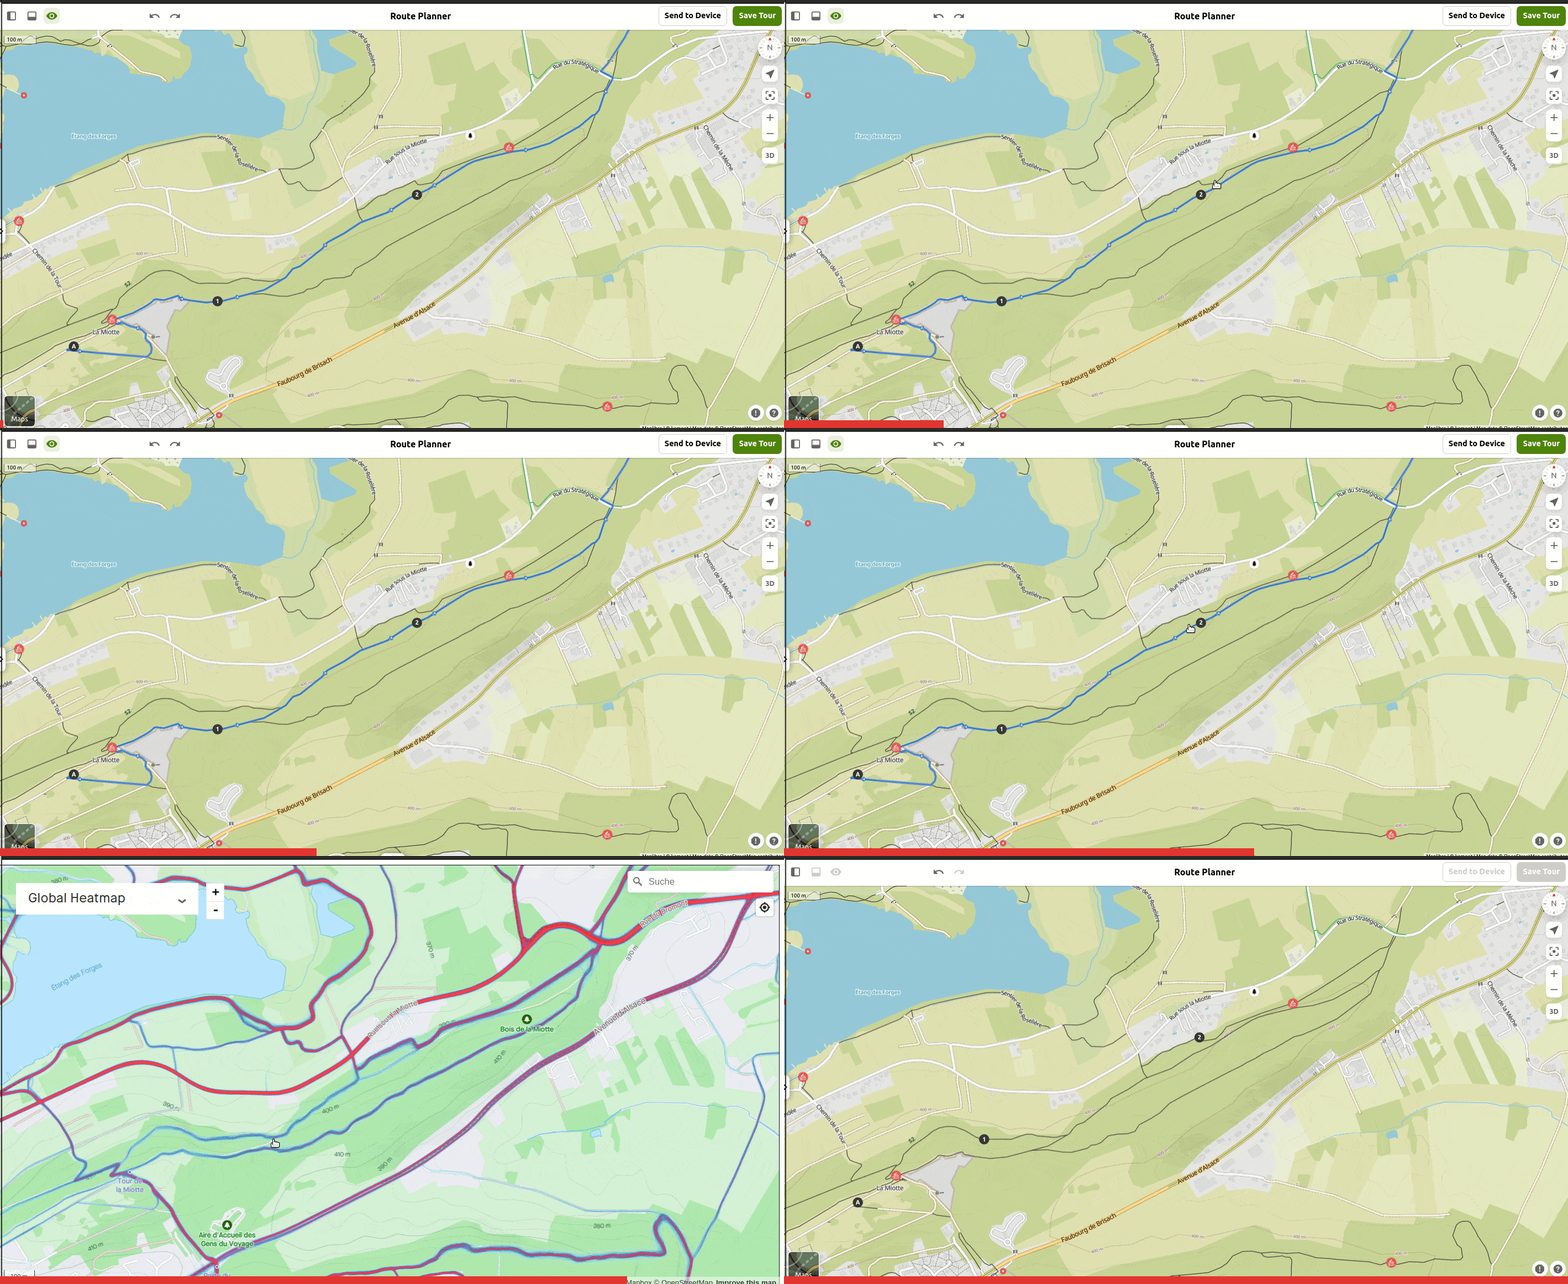
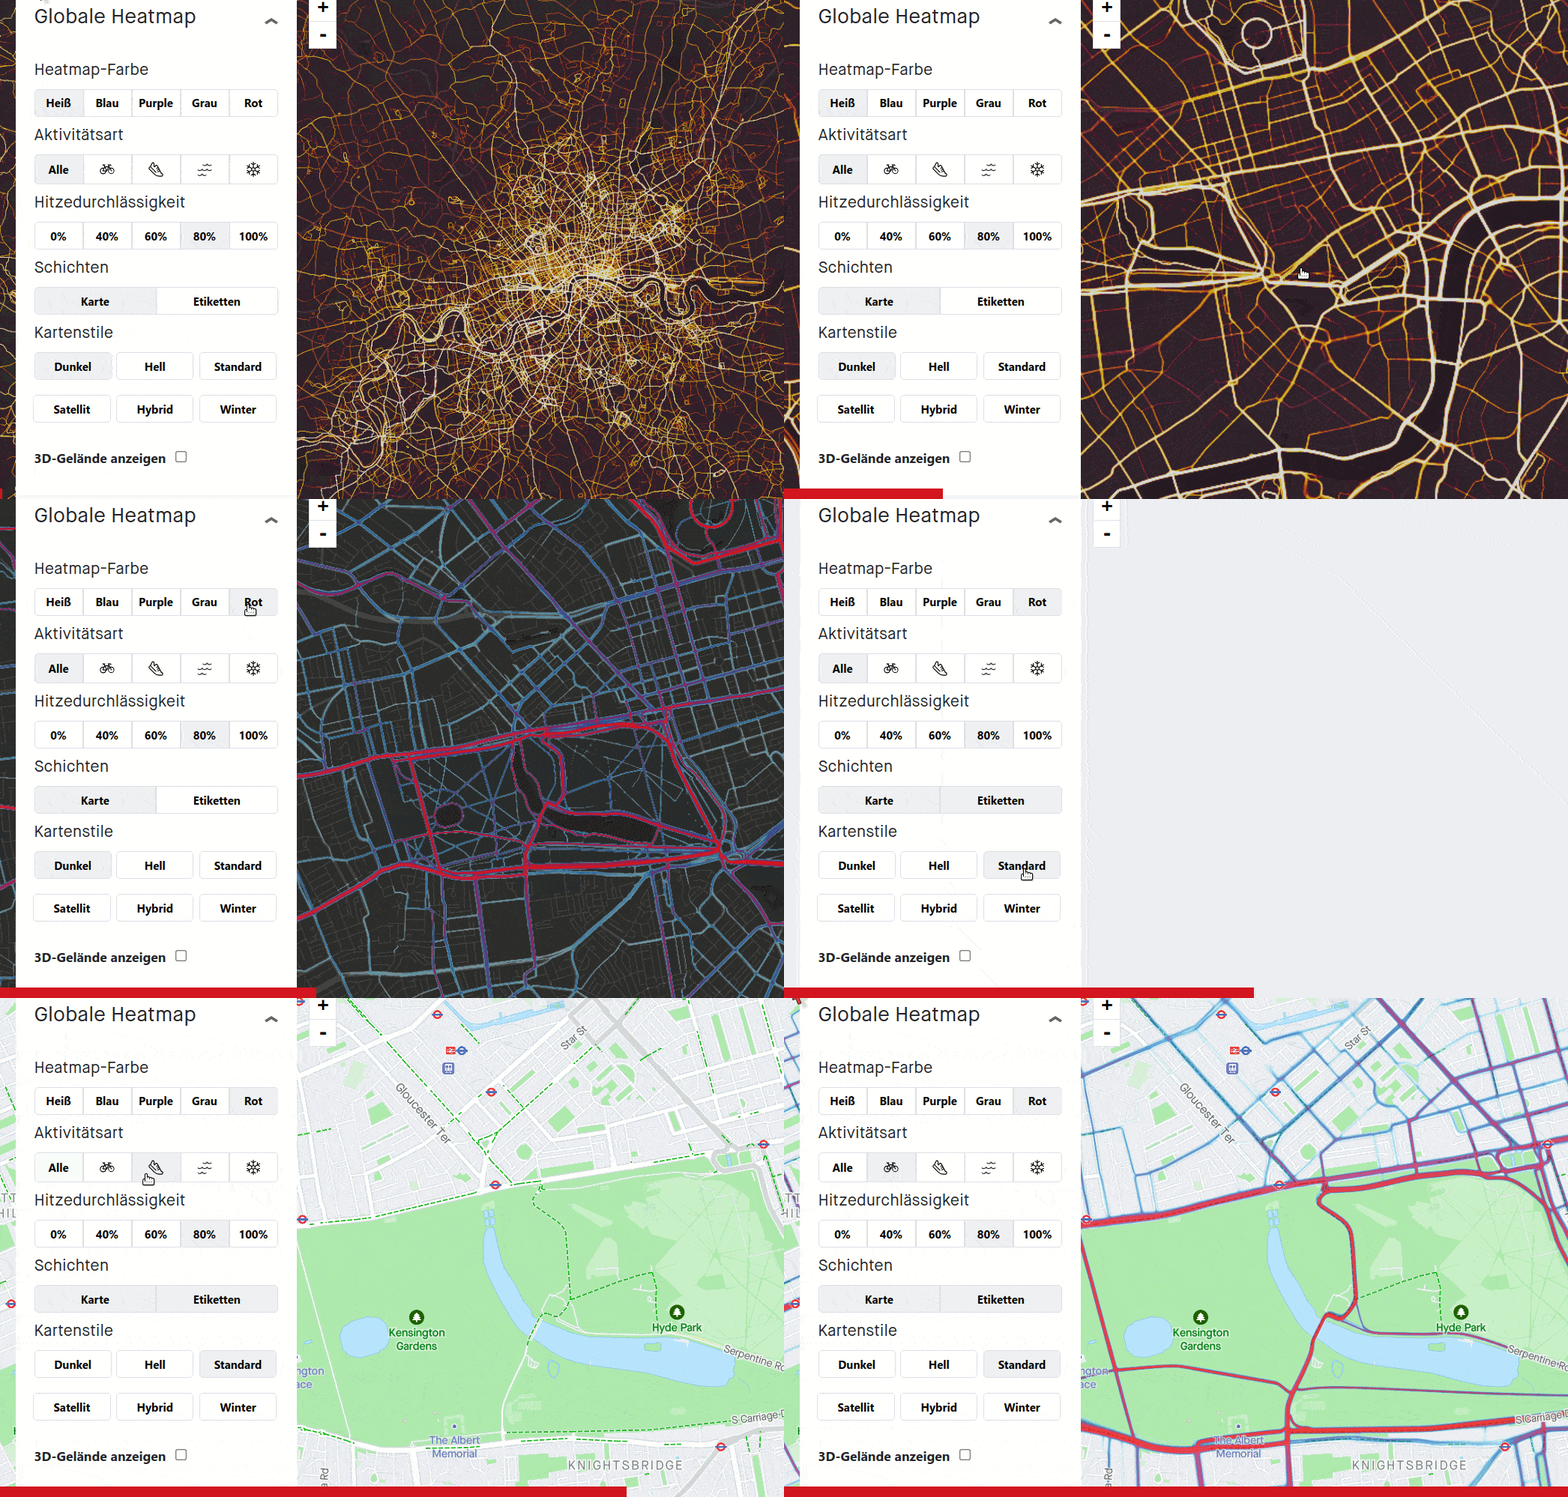
The strava global heatmap is a visual representation that displays the routes where individuals are running, hiking, and cycling worldwide.
It can be accessed in high-resolution with a free strava account (let's hope it stays that way!).
 |
|---|
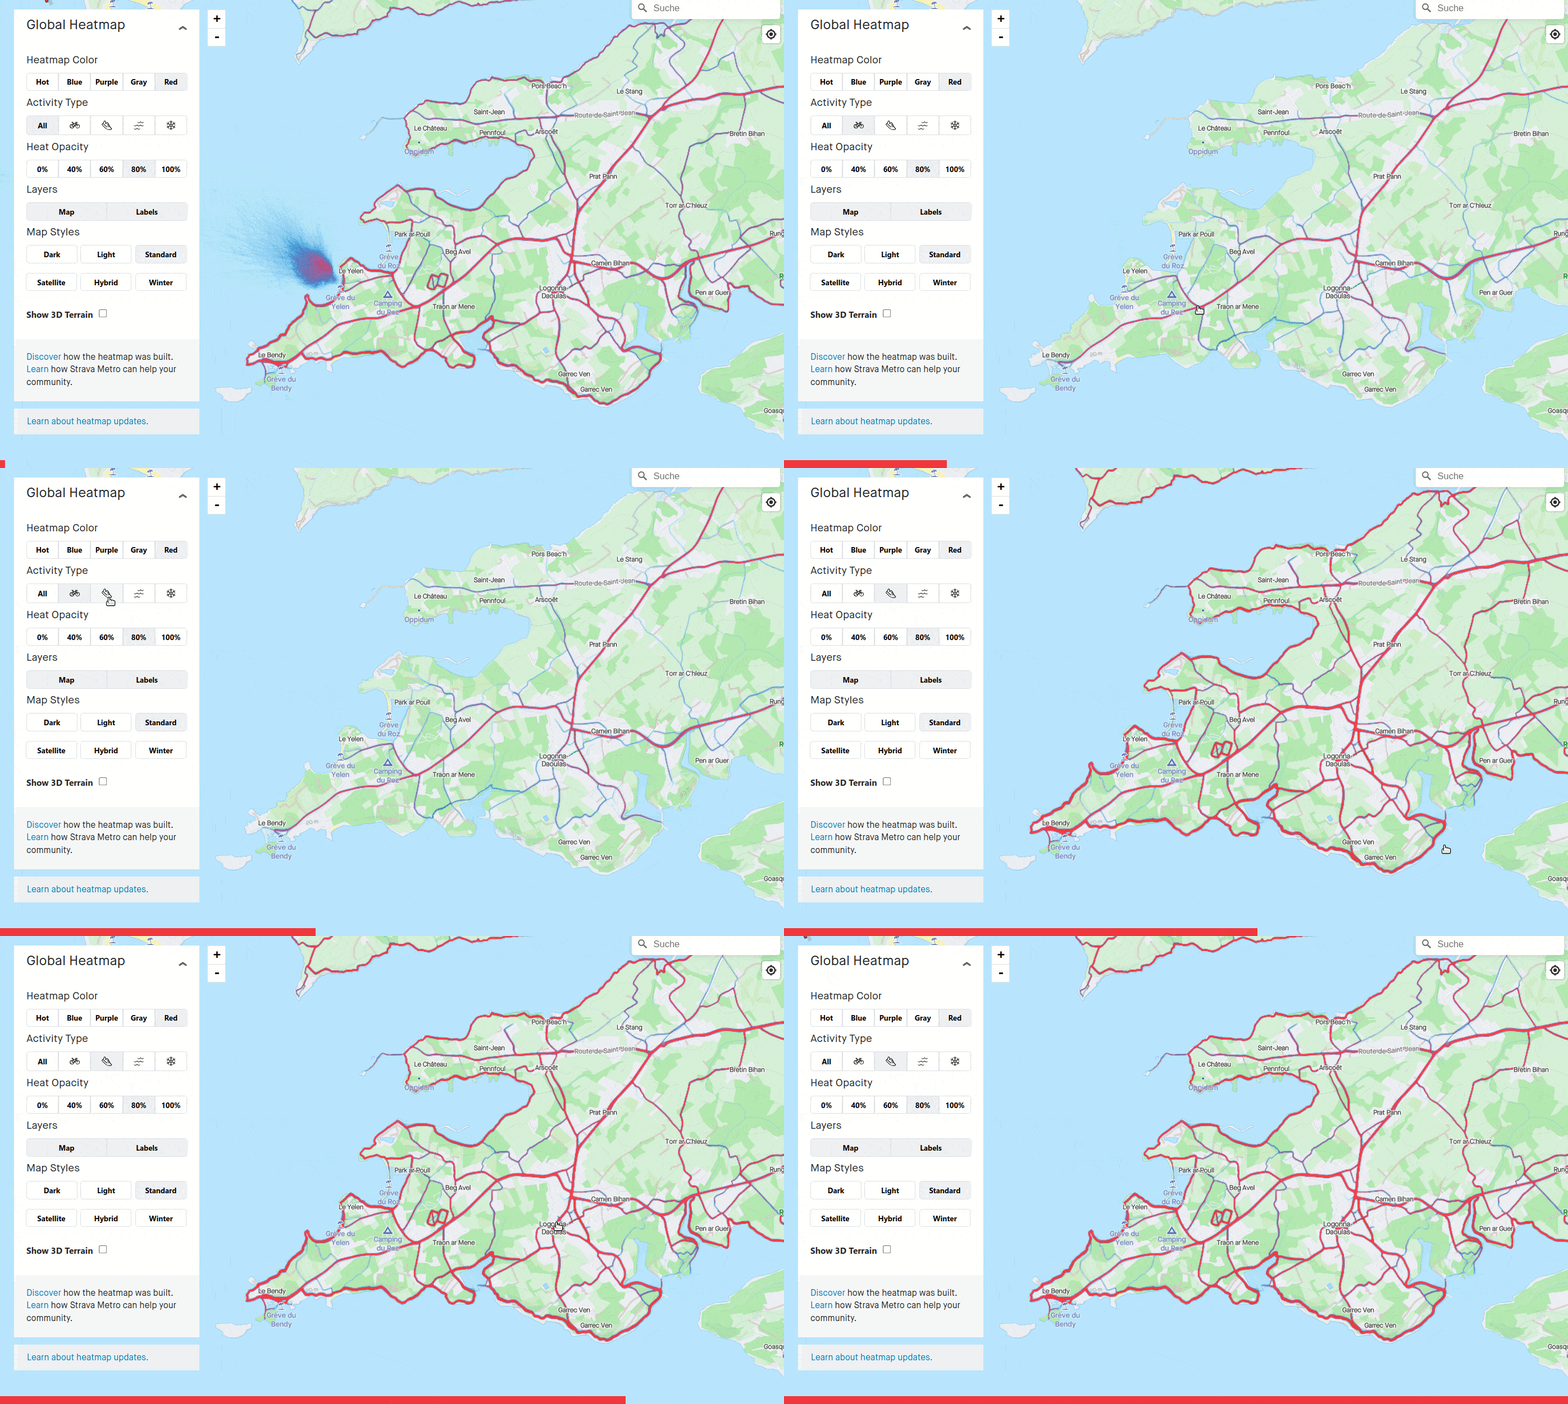
strava global heatmap: modifying the display settings to red, label, standard, and applying only by foot (:athletic_shoe:) / only by bike (:bike:) filters. |
As mentioned in the still missing section, it would be nice to have finer filters:
- For instance
only by mountain-bike(:mountain_bicyclist:) andonly by road-bike(:bicyclist:)
 |
|---|
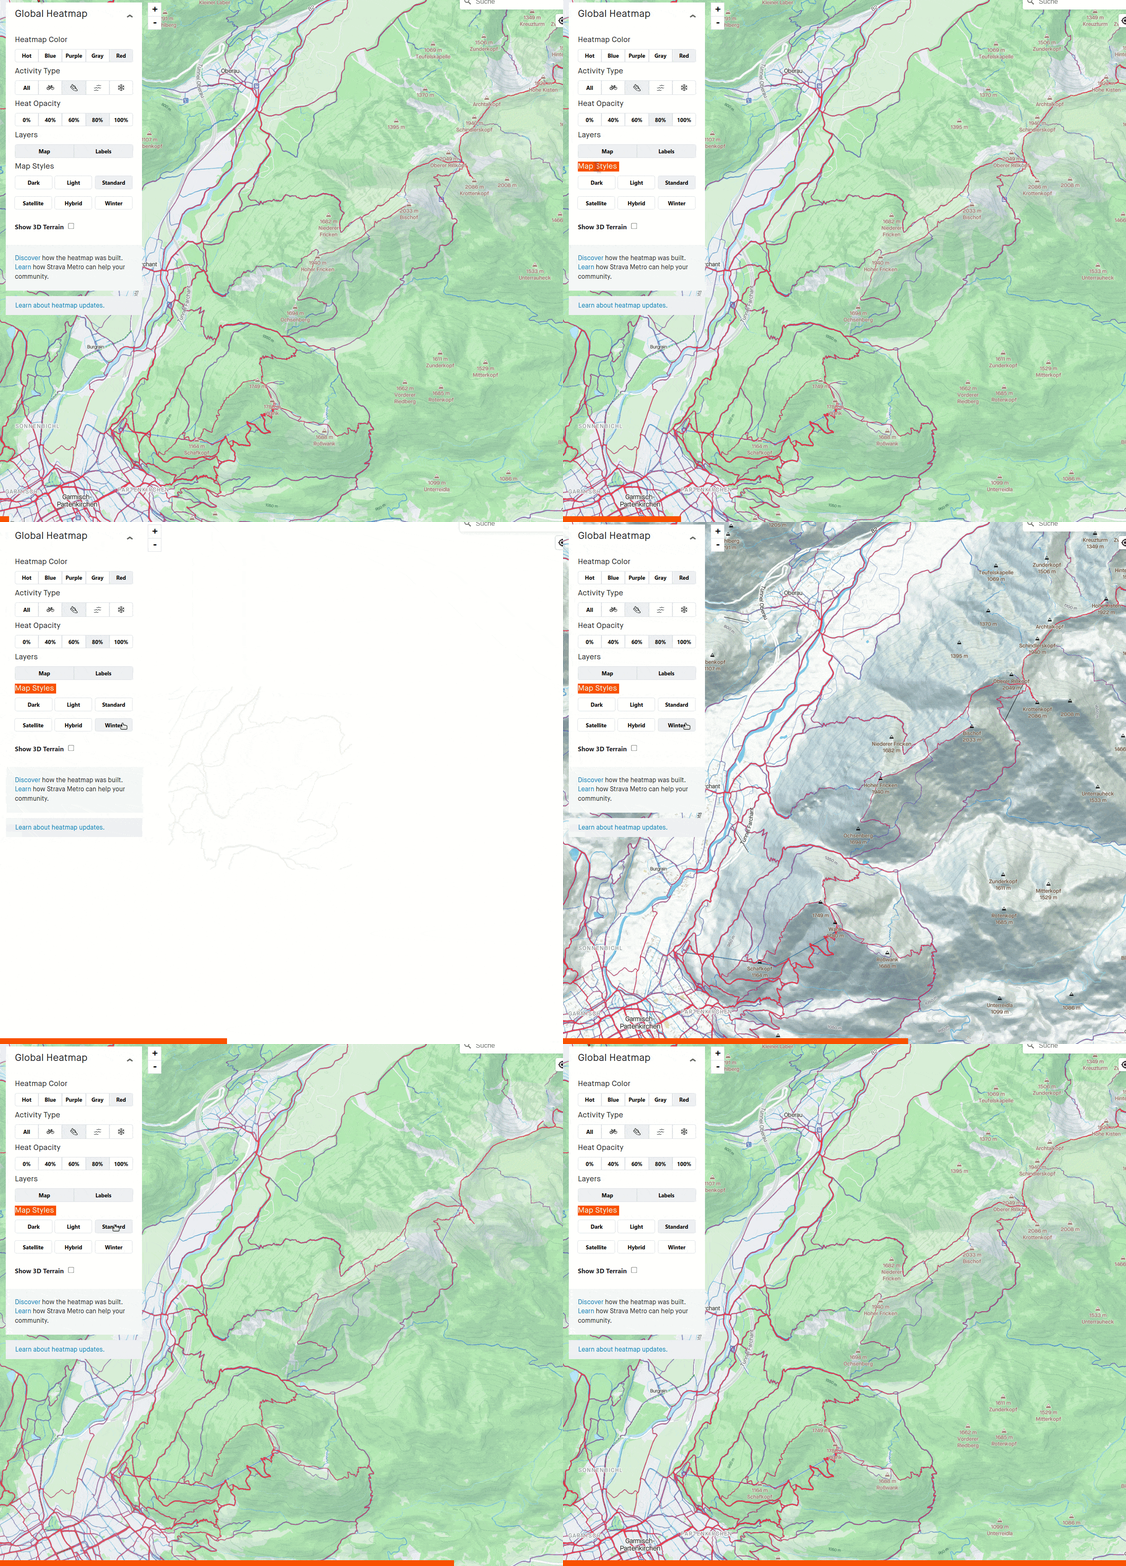
The winter map style 🏔️ often provides a clear depiction of the terrain, even for summer activities. |
To learn more, refer to:
📸 The goal of this first section is to discover interesting places in a given destination region.
- Drawing a route (done in section 2 - Draft).
- Checking little details (done in section 3 - Check and adjust).
💡 "Inspiration" can be divided into two categories:
- 📍 Points, e.g. a place such a lake, a viewpoint, a summit ...
- 🛤️ Routes, e.g. a tour recommended by a book or completed by someone else.
Note: if you already know the region well, you can jump directly to the next section about
draftingroutes 😉
Click to expand
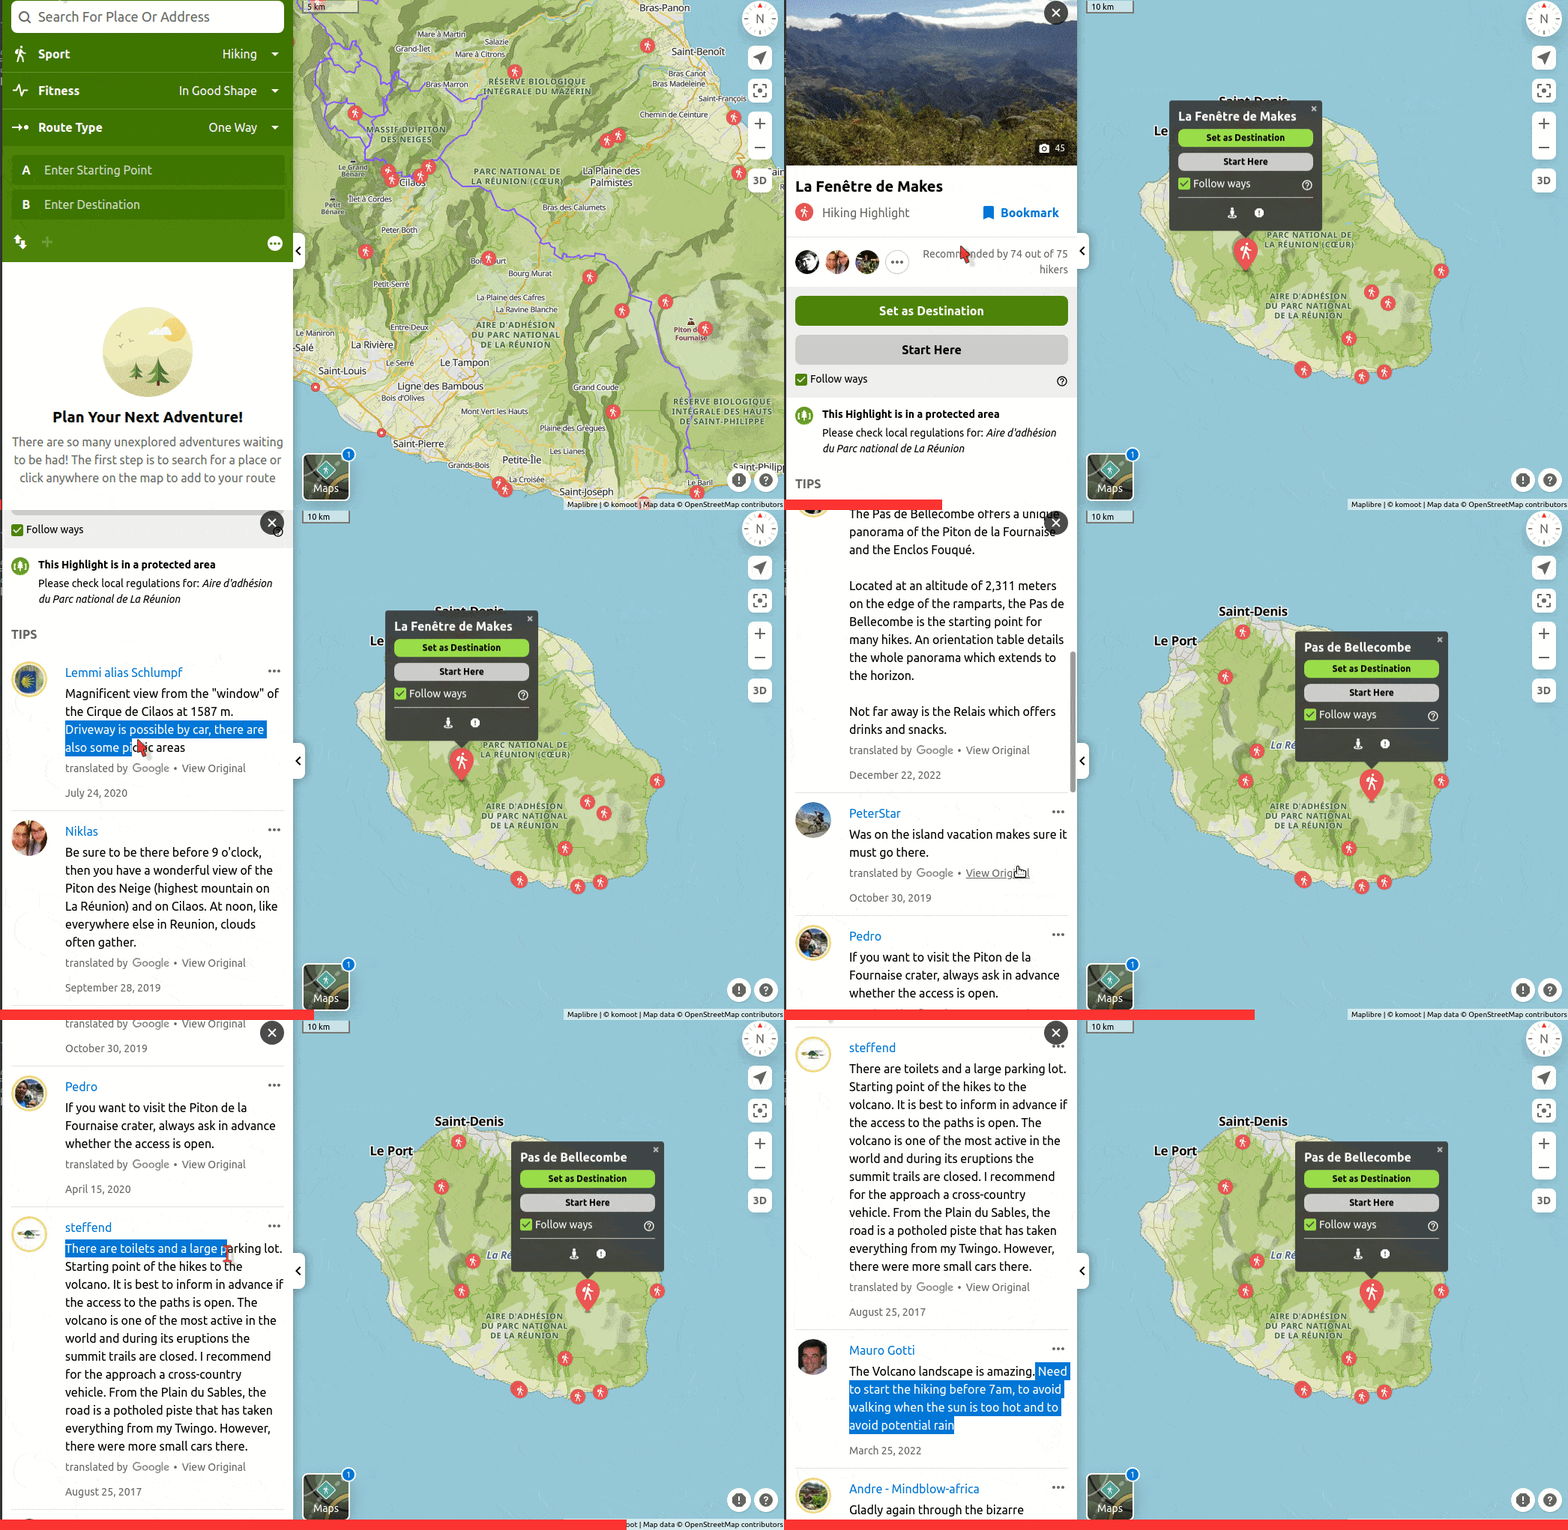
They are the red dots you see on the komoot planning map
"Every Highlight is a personal recommendation that you know you can trust. They are created by the community, for the community".
 |
|---|
komoot Highlights can give a first idea of what to do and what to see. Users comments can provide valuable information. |
💡 Tips:
- Zoom out to show only a few dots: these are the top Highlights.
- Check the number of recommendations and the level of popularity.
- Reading users comments can be valuable for:
- Learning more, such as the difficulty of a descent, if bicycles are allowed, or information on fares and times for a cable train.
- Getting the latest updates, for example if a trail has been recently affected by a fallen tree.
- Verify the date of the comments.
- While
komootHighlights are mostly points (i.e. places), they can also be segments like a nice single-track. komootHighlights can be found both inkomoot/places-to-seeand inkomoot/planmodes.
Click to expand
Google Things To Do is a search tool that allows travelers to research attractions, tours and activities.
- It is planned to be integrated to
google.comin November 2023.
 |
|---|
The things-to-do section of google travel can give a good overview of popular places in a given region. Bookmarking favourite places can be convenient. |
💡 Tips:
- Mark places you like with the
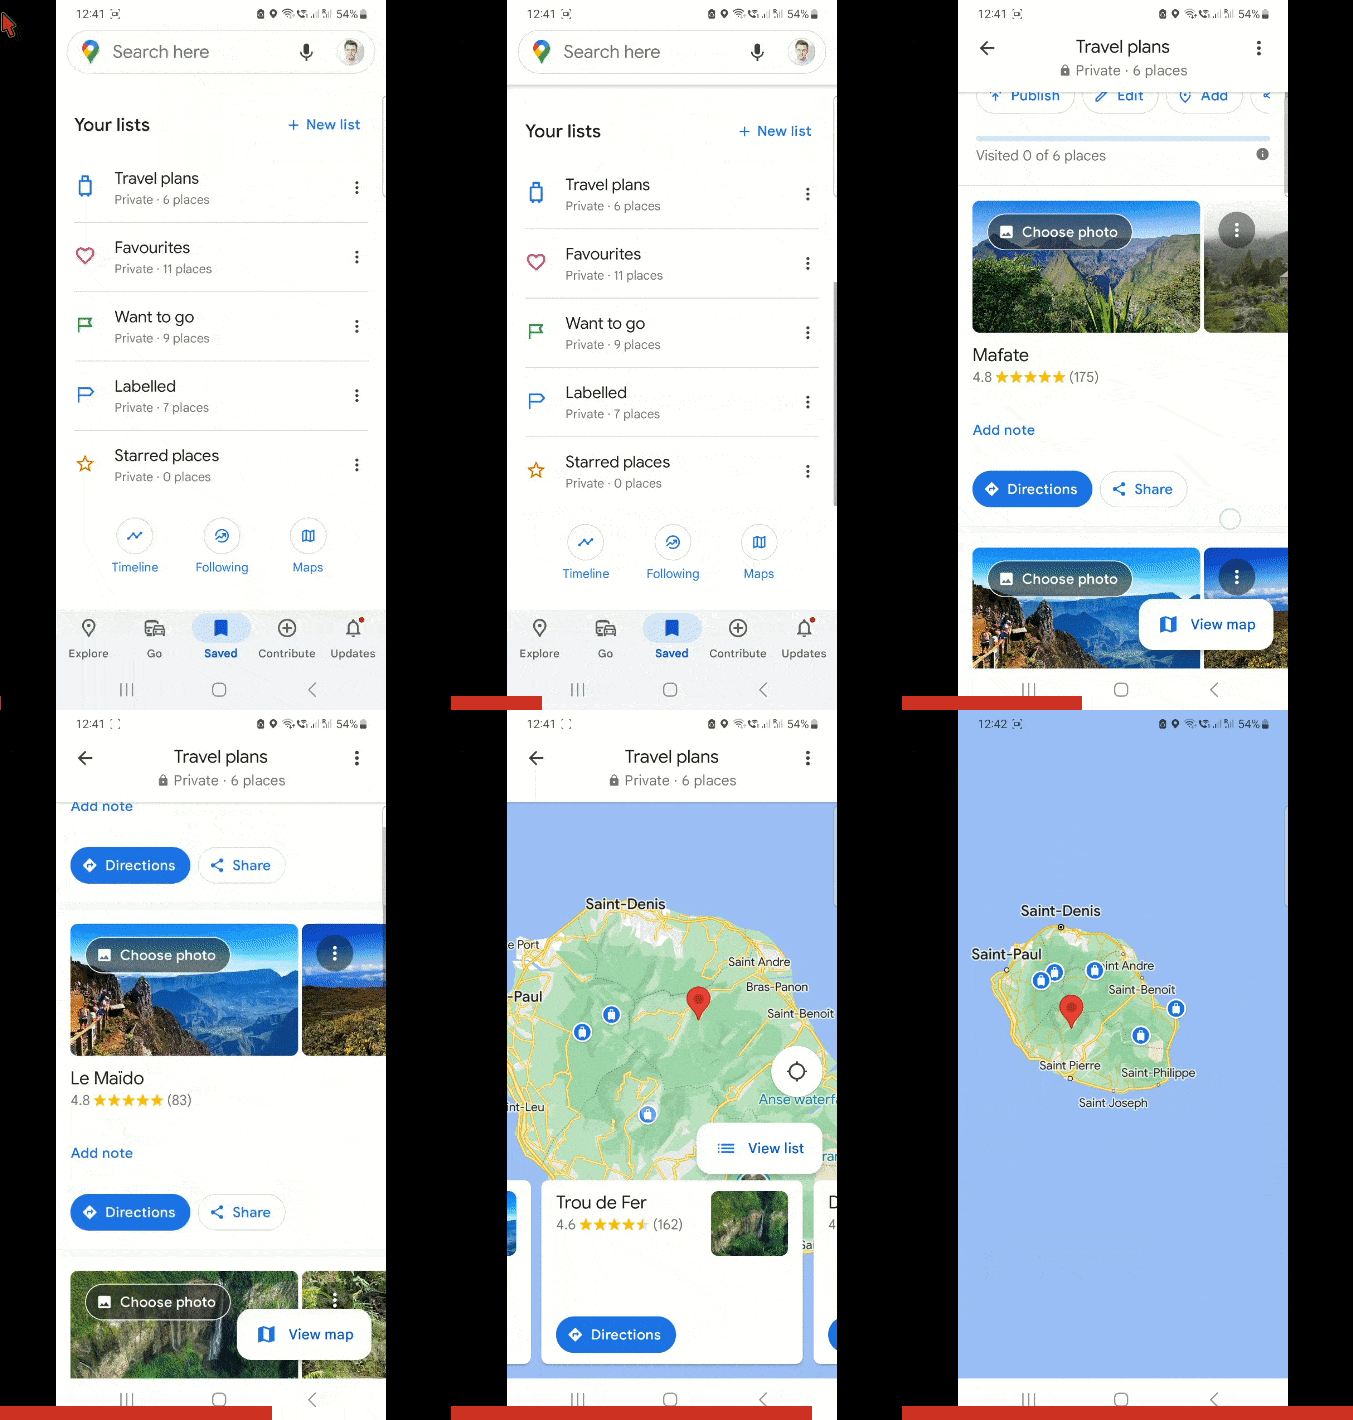
bookmarksymbol 🔖: they will be added to yourgoogle travel planslist and will be available in theSaved placessections ofGoogle Maps. - The bookmarked places can be visualized on a smartphone, as demonstrated below.
 |
|---|
The saved places can be seen in Google Maps, here on a android smartphone, which can give a convenient summary of what you would like to visit. |
Click to expand
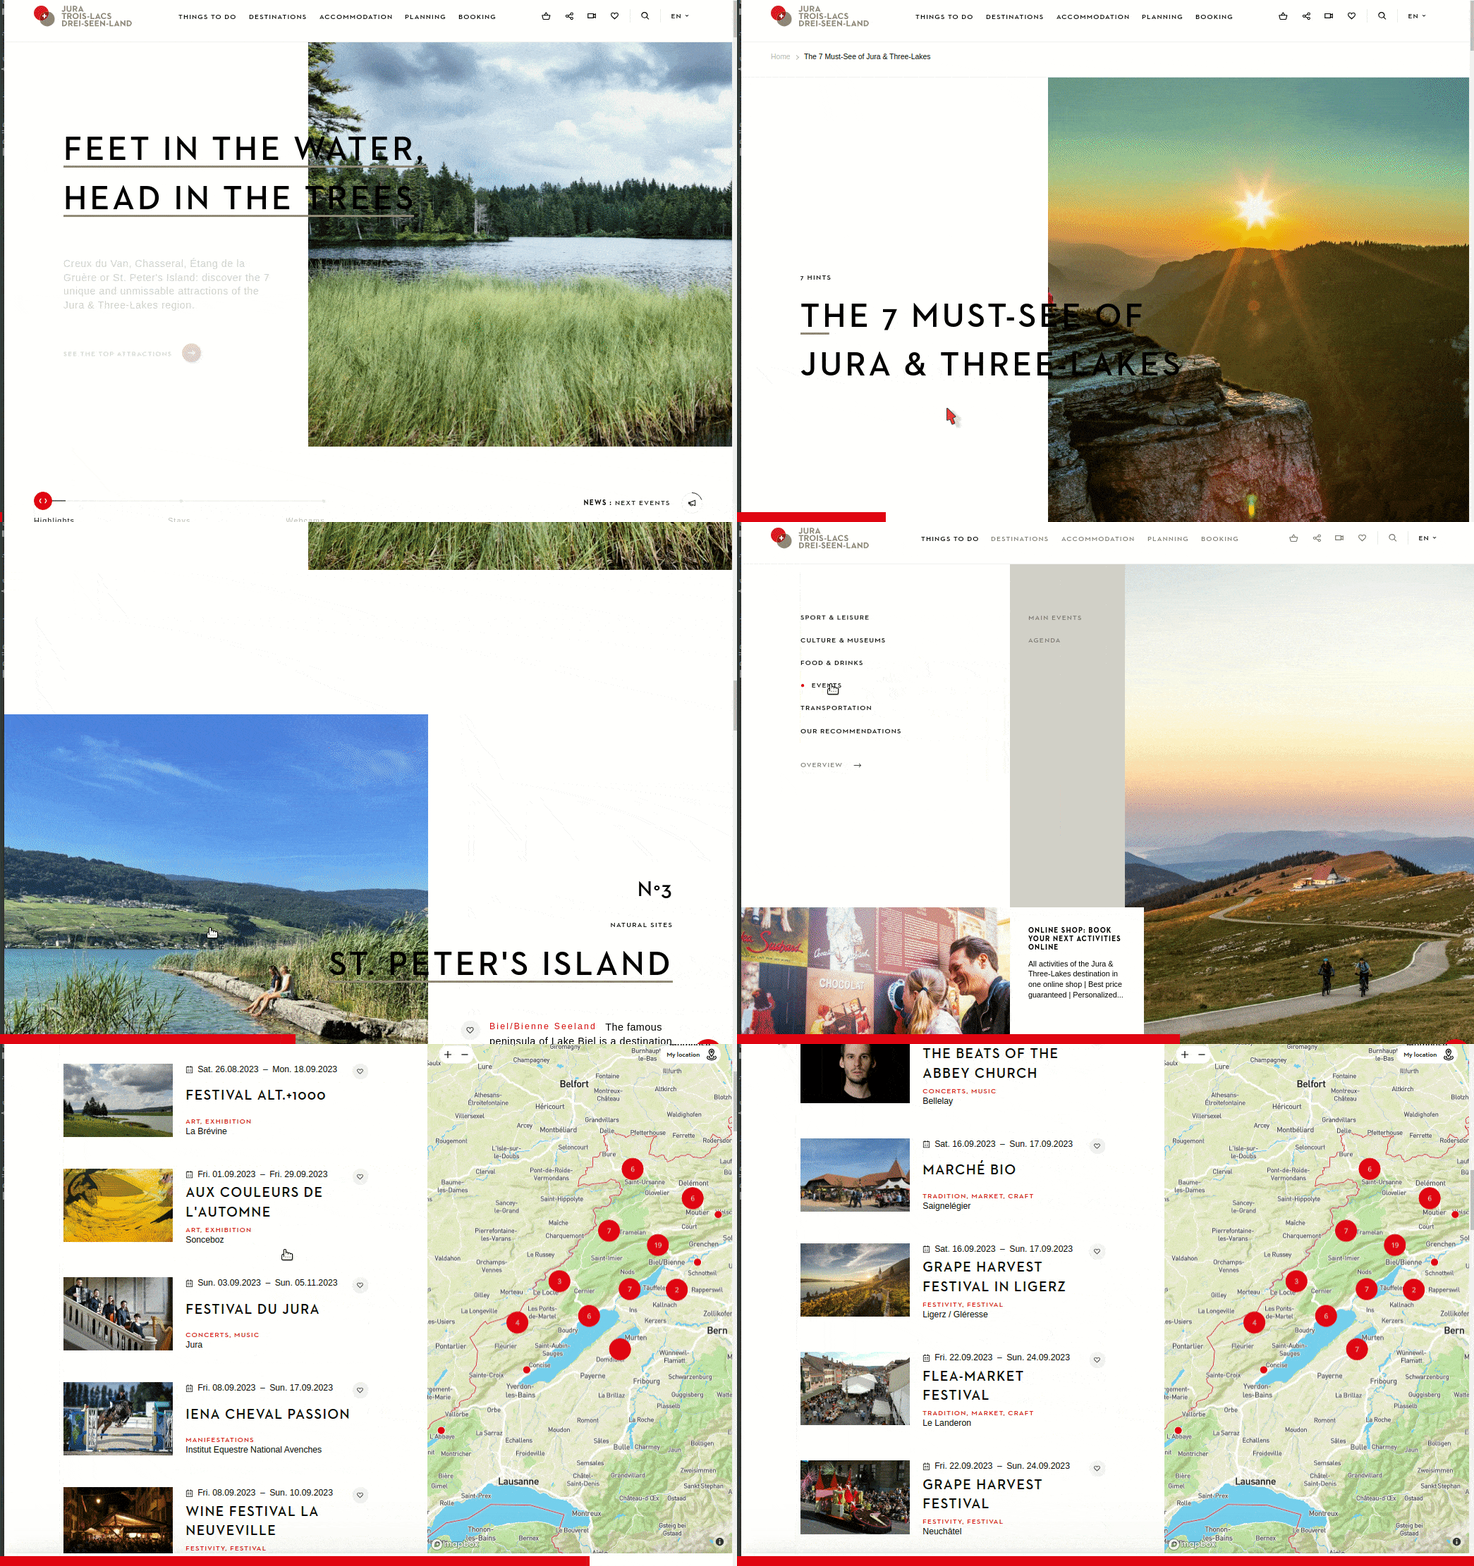
Touristic information resources can help discovering about the region, especially the events calendar. 📆
 |
|---|
| Discovering highlights of a region as well as the main events happening there. |
💡 Tips:
- Check the advantages offered by the guest card of the region: 🎫
- For instance a free ride with the local cable car might inspire you to start your tour from a top station of the cable car. 🚠
Click to expand
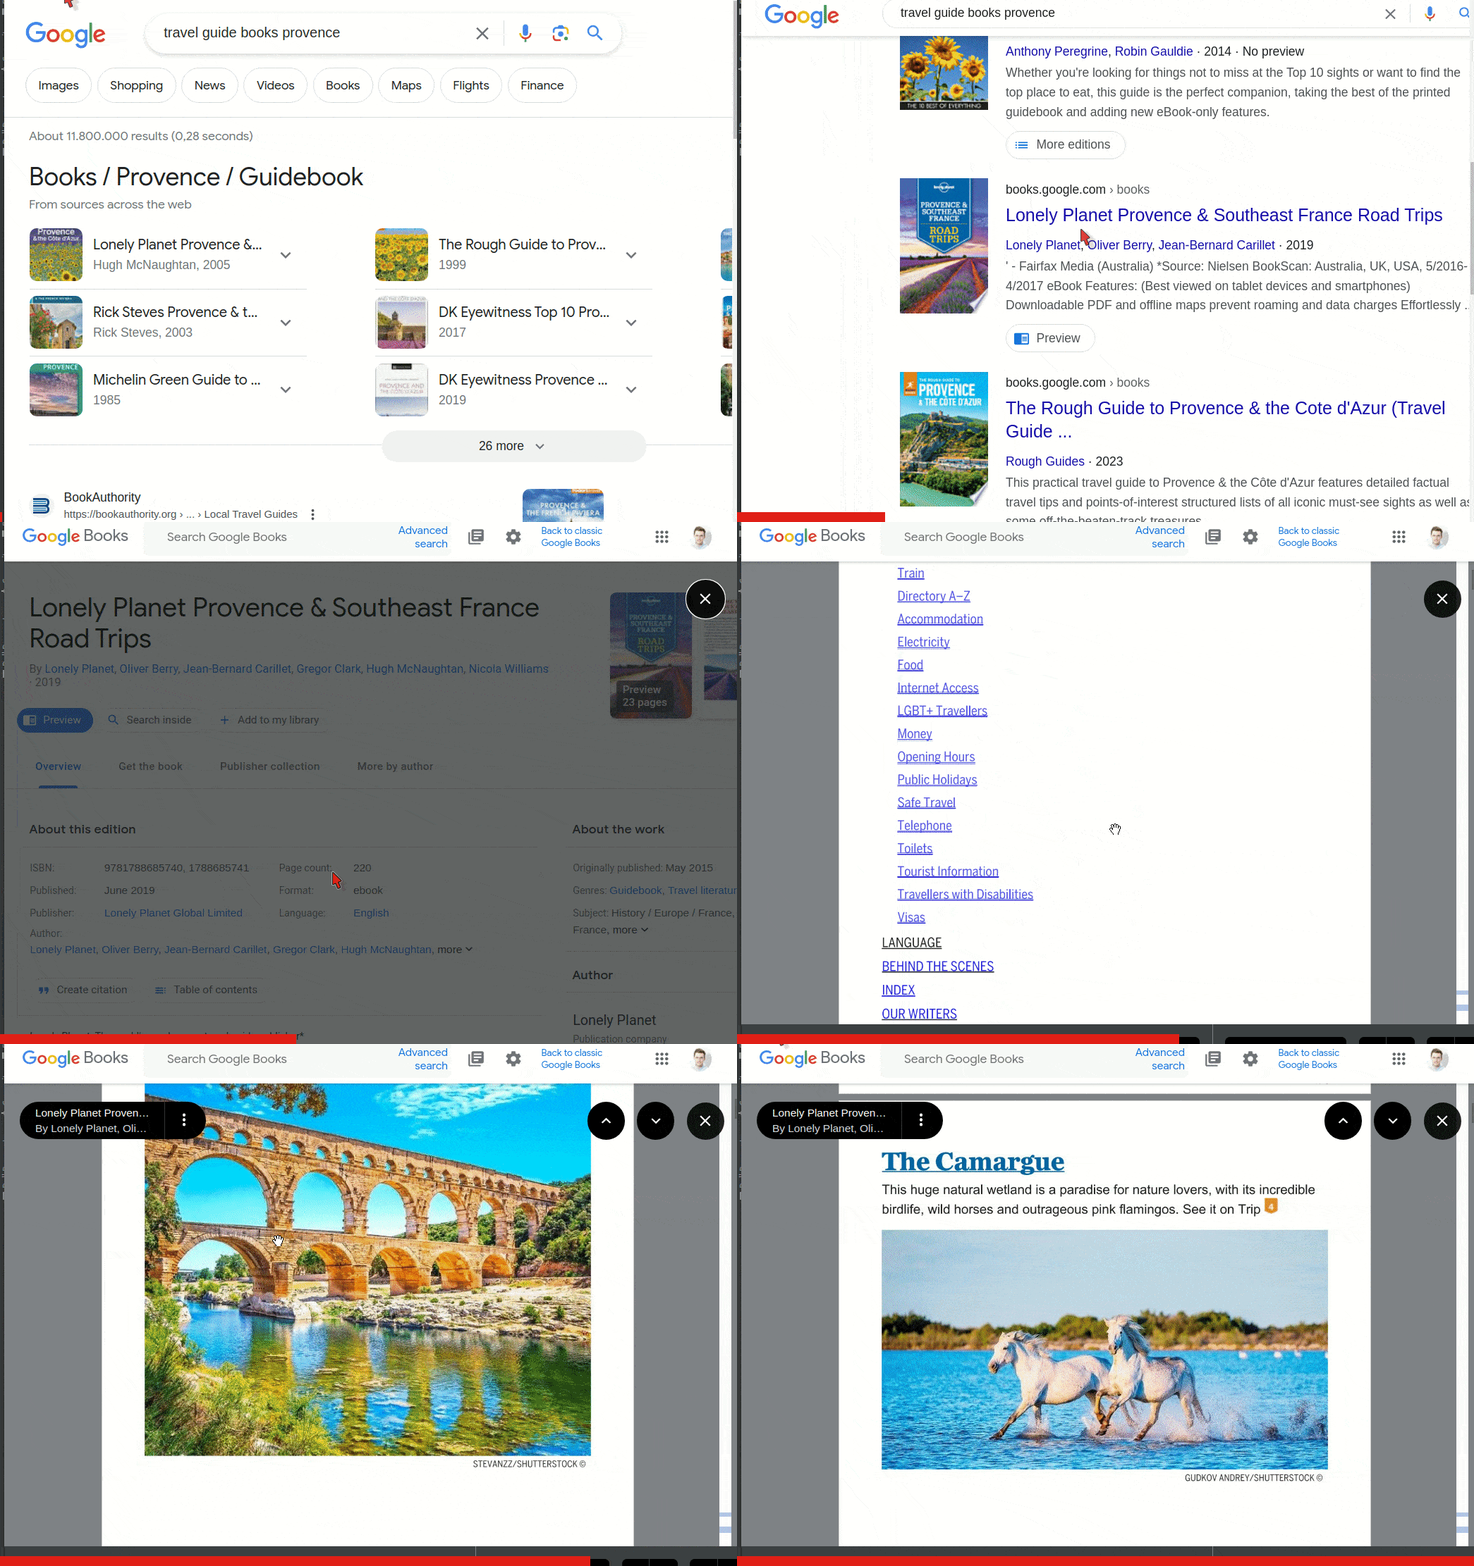
Travel guide books are huge sources of information and inspiration. They sometimes suggest itineraries or "visiting ... in 1/2/3 days" plans.
 |
|---|
google books can provide previews of some (not all) travel guide books. Here looking for inspiration in Provence. |
💡 Tips:
- Check the year of edition.
- Buying or lending used travel guide books can be a good option.
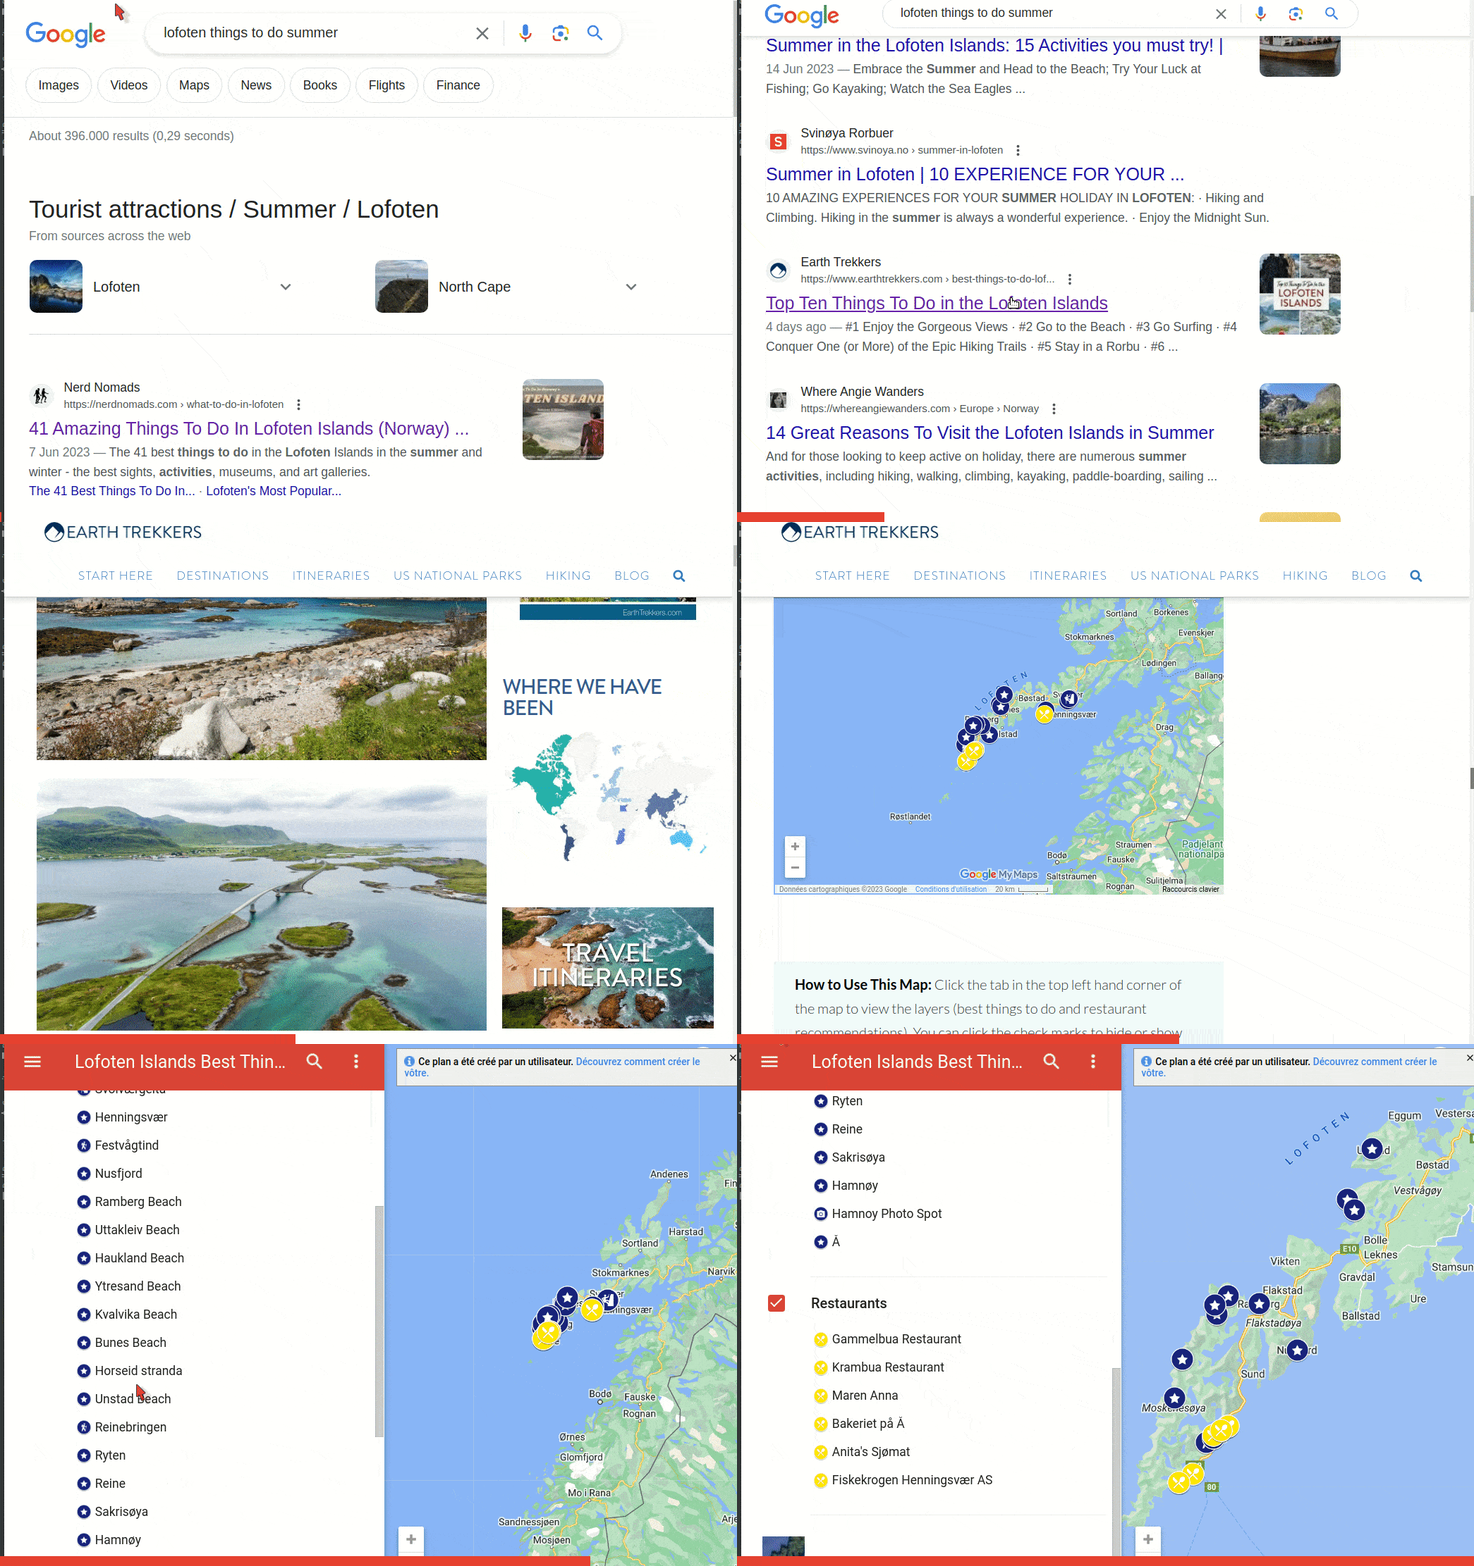
Travel and adventure blogs can also be very inspiring. ✍️
 |
|---|
Example of a traveller blog, full of tips and even a My Maps (My Maps is covered in a next section). |
💡 Tips:
- Search for
"things to see/do [your destination]"ingoogle search. - Want to take nice pictures to share with your friends and family?
- Then search for
"instagram-able spots [your destination]". 🤳
- Then search for
Click to expand
"
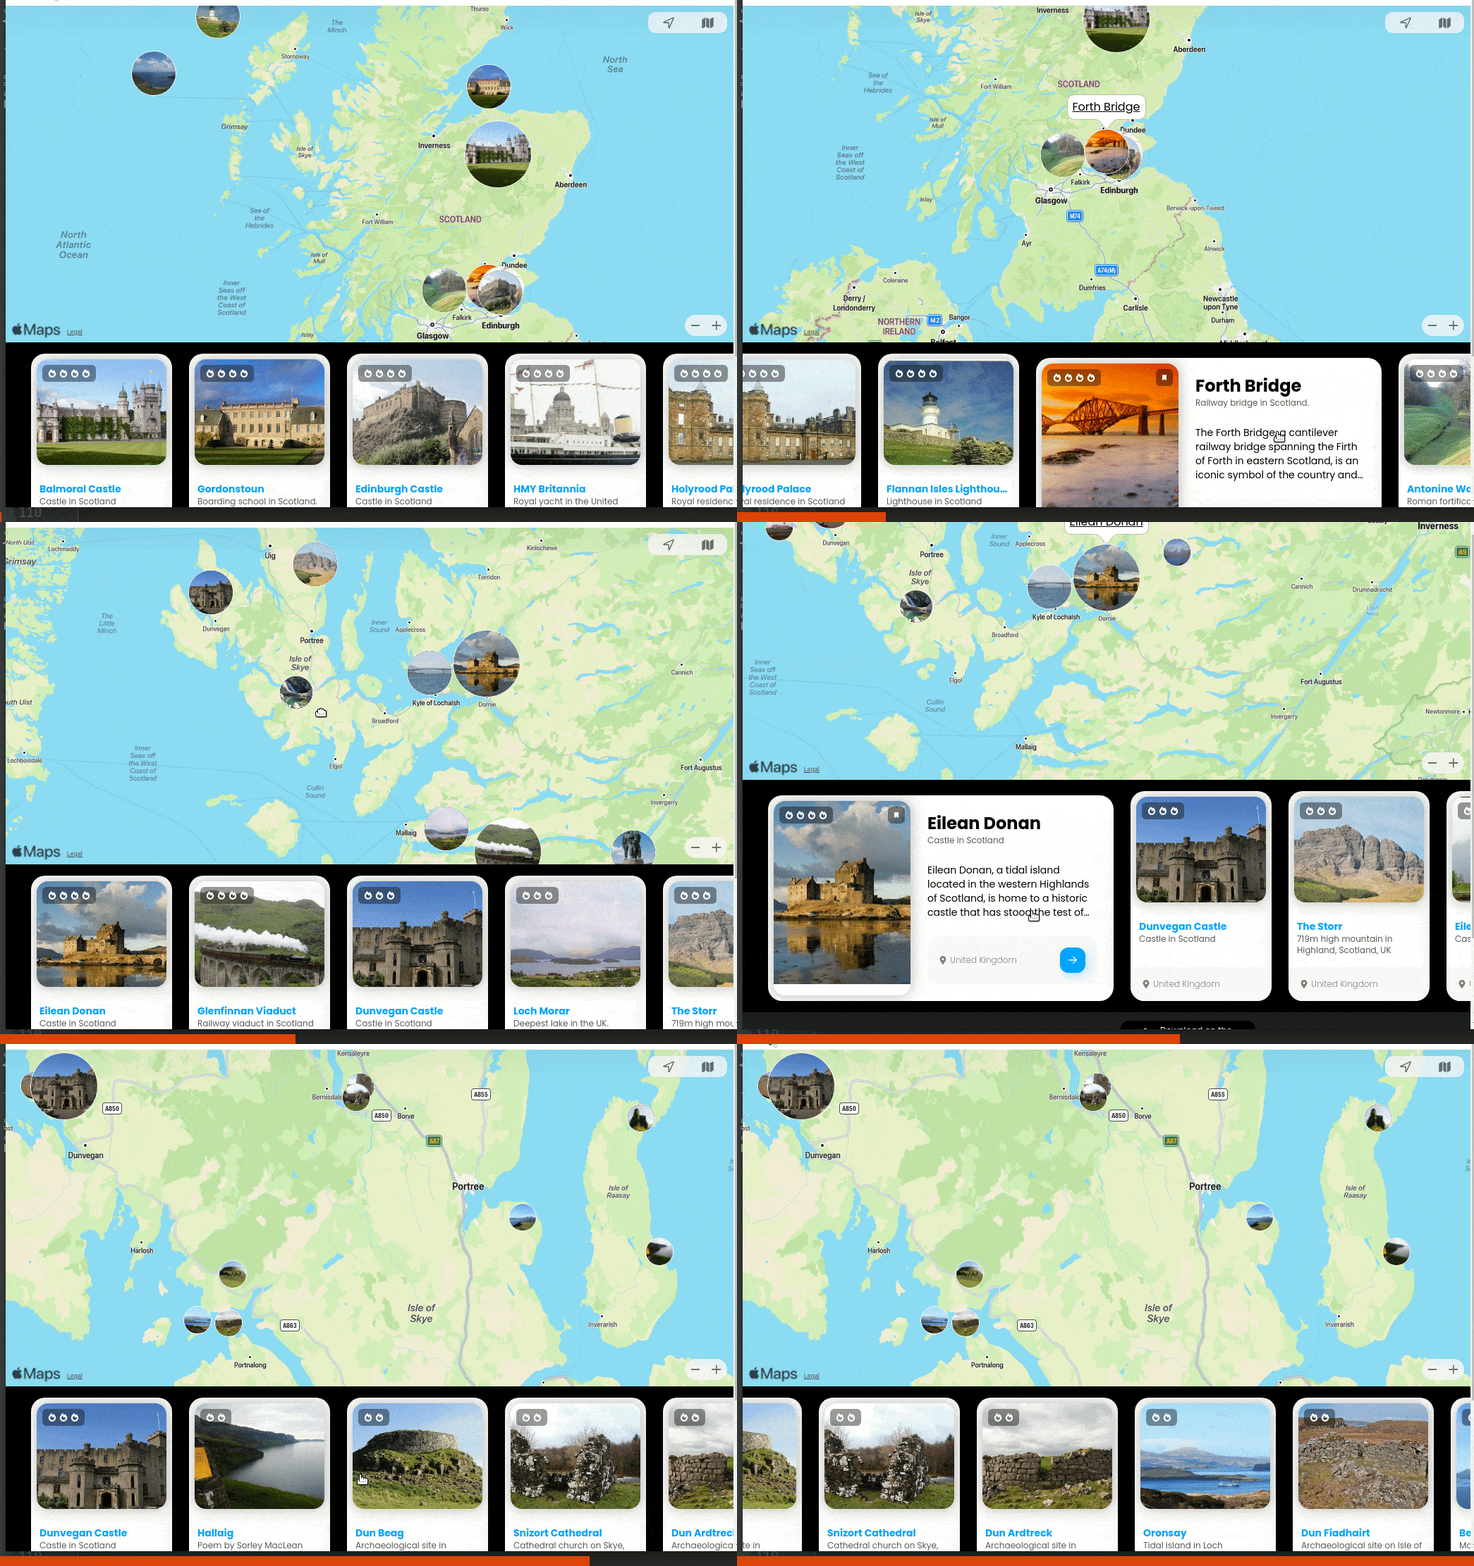
around.usis a free, interactive, and easy-to-use global tourist guide designed to help you discover monuments and natural sites around you."
I discovered this tool in a French podcast, where the author explains how he used ChatGPT to develop around.us. 🤖
 |
|---|
around.us offers in one glance an overview of things to see in a given region. It comes with pictures and a short description. |
Click to expand
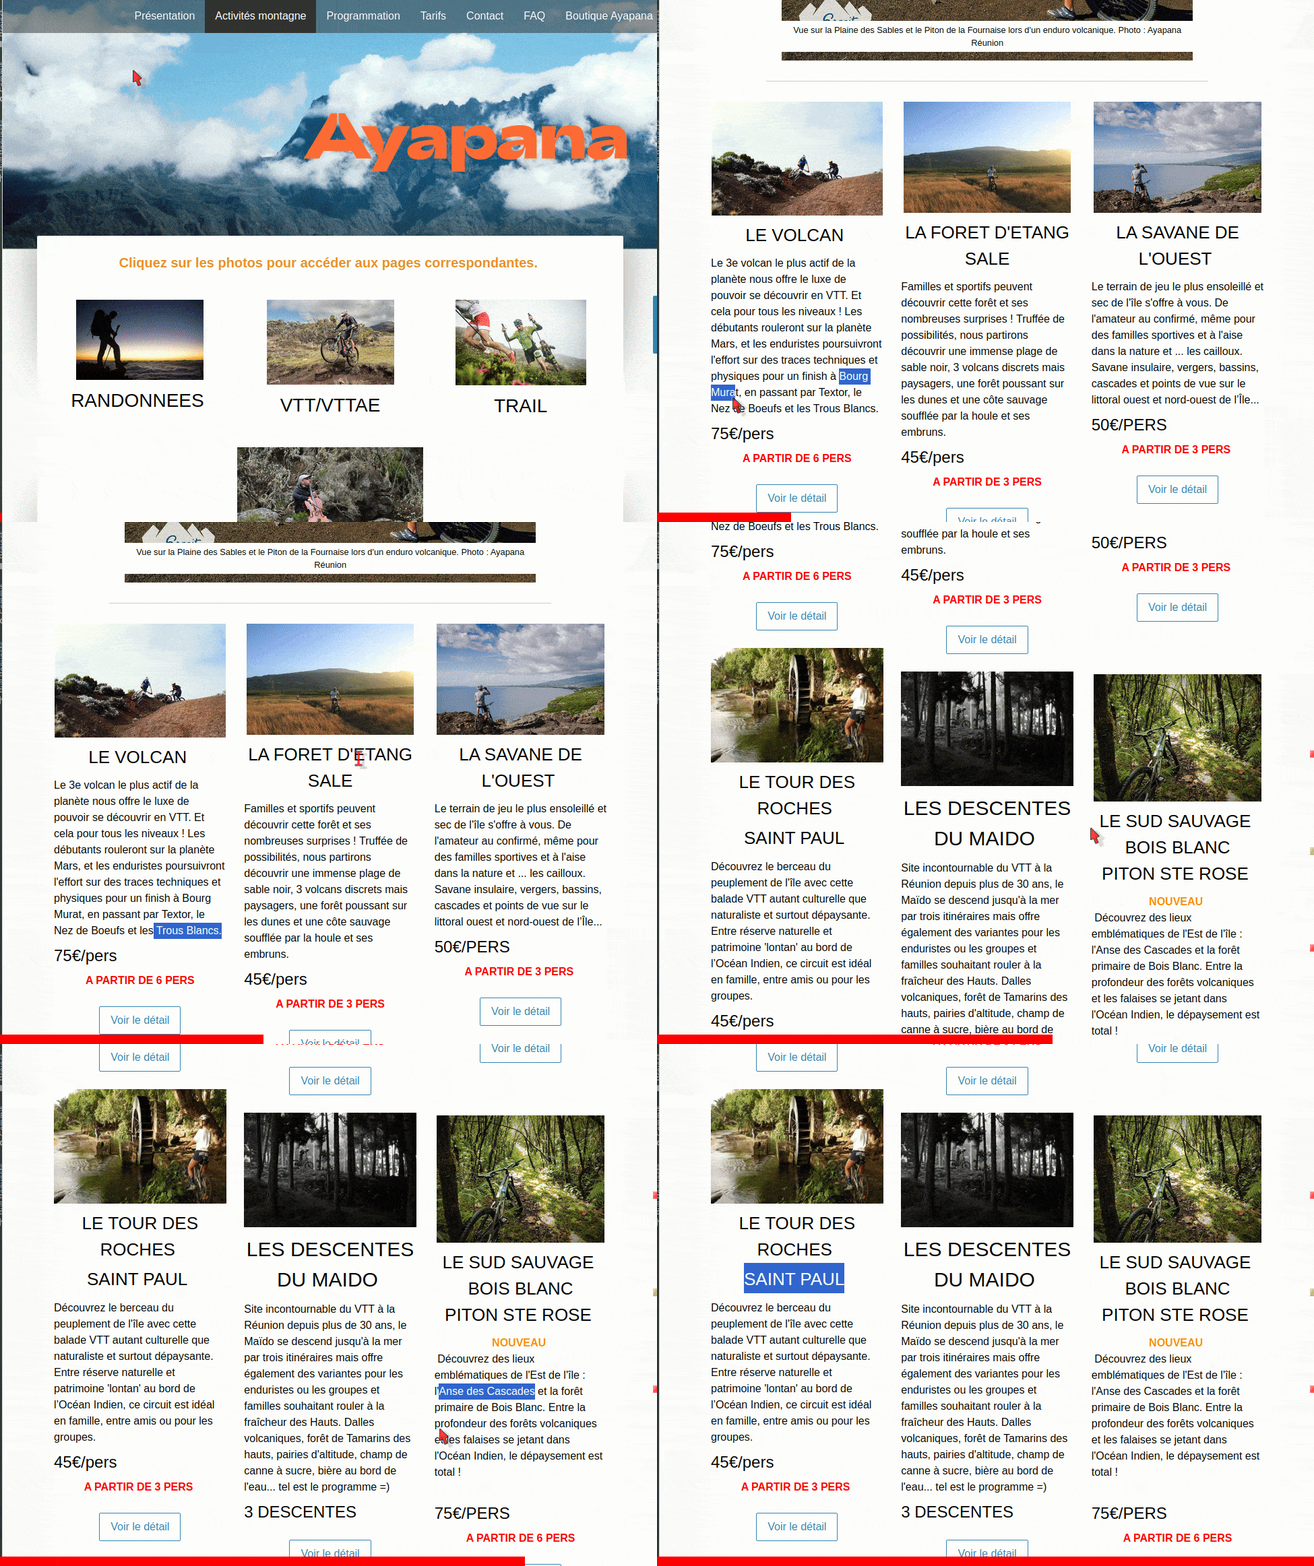
This method may be less straightforward. It involves reading the descriptions of guided tours to understand where the guides usually take their guests to show them the best places in the region.
- Keep in mind some possible limitations:
- Tours derived from such descriptions may not be feasible on your own: sometimes a bus-shuttle is arranged by the guiding company.
- Descriptions are often sparse to keep the exact track undisclosed. 😉
- Not very quick: retrieving names and locating them on a map could be tedious.
- Nevertheless, the mentioned names can be enough to get a good idea of the places to visit.
Click to expand
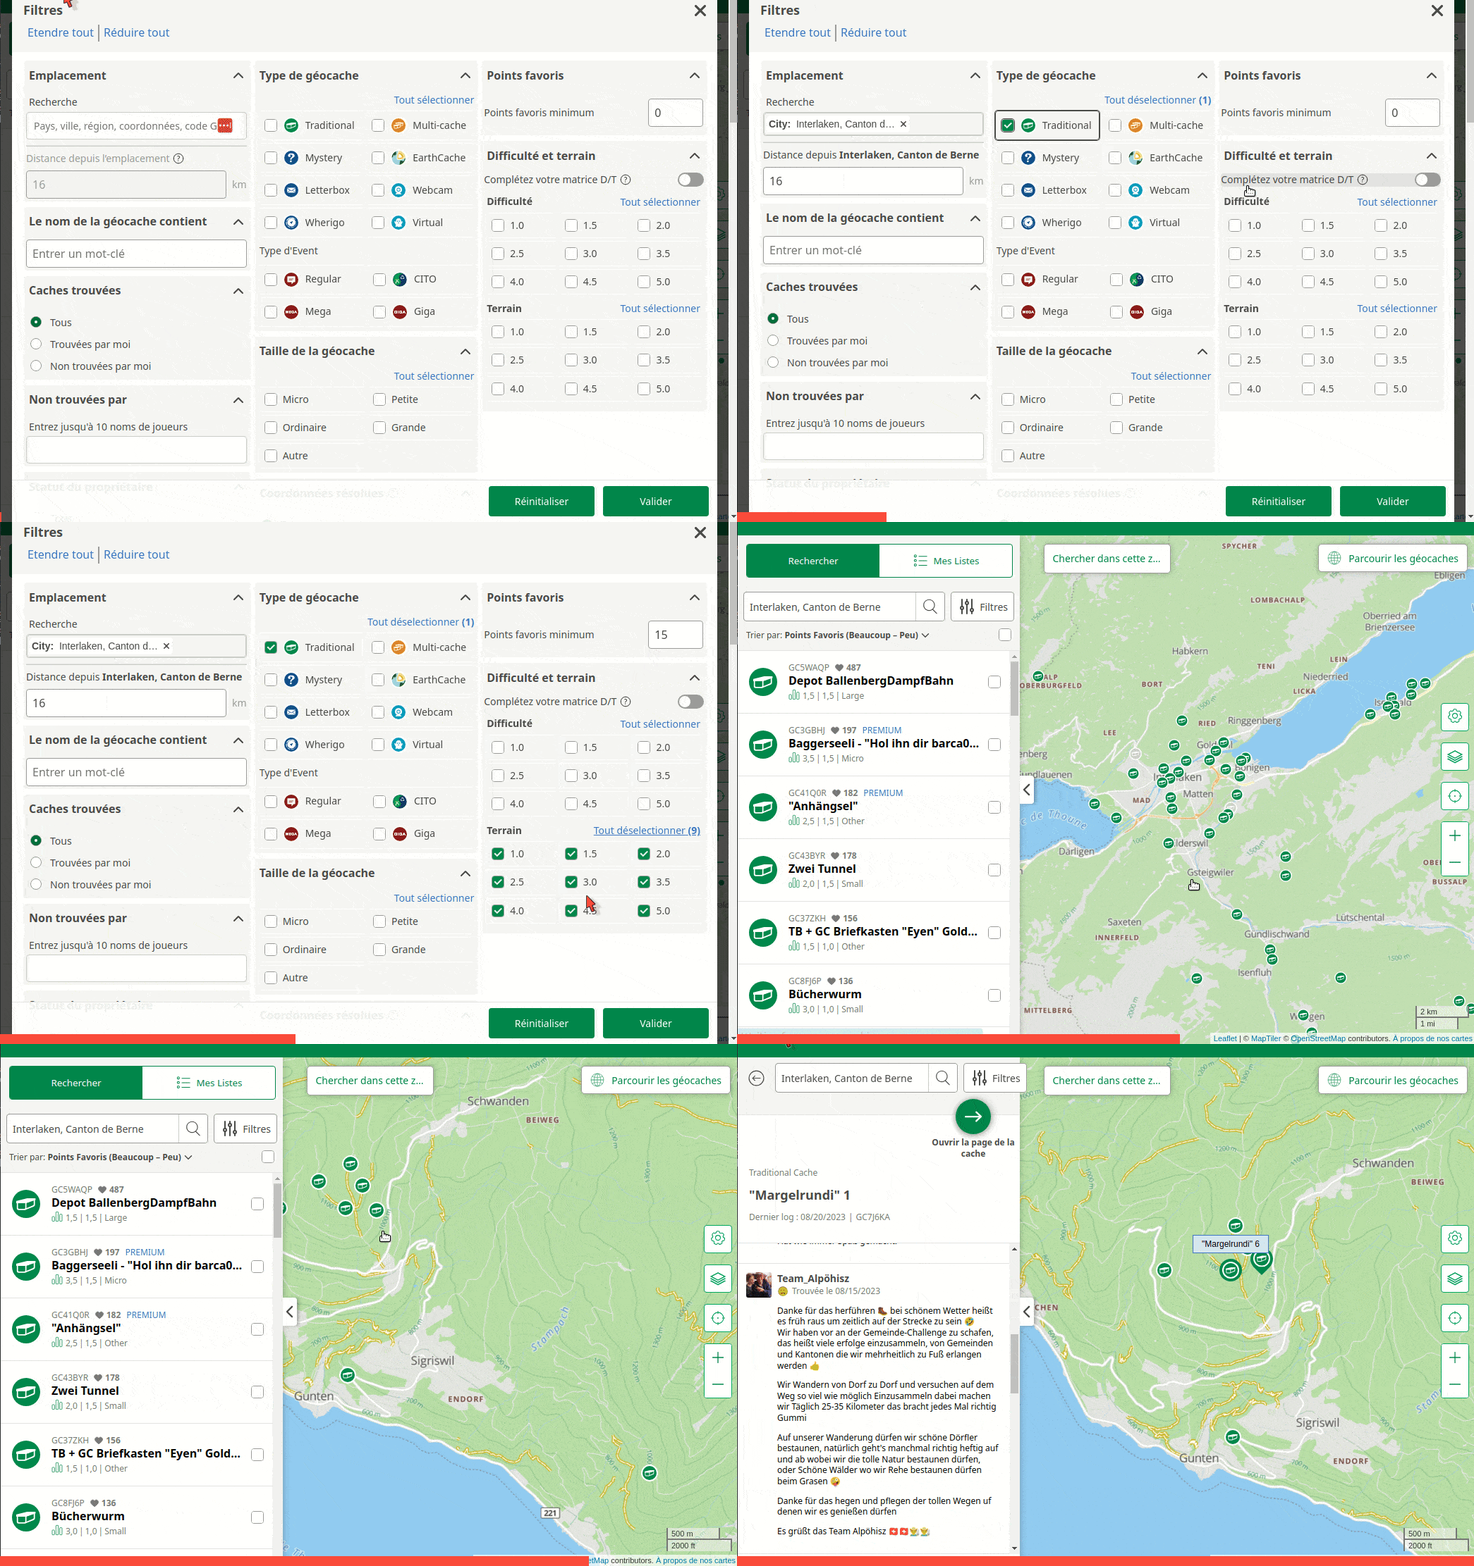
This game, similar to treasure hunting, can provide location ideas for outdoor activities.
- Learn more about this free game at
geocaching.com.
💡 Tips:
- If there are too many caches available, filter by favourite points (
FP) to focus on the most popular ones. - Idea for improvement: the favorite points (
FP) should be scaled by the number of visits:- For example a cache found
20times with20FPshould stand out more than one found10,000time with only25FP.
- For example a cache found
- A geocaching tour can sometimes be more motivating for children than a simple hike. 🤸
Click to expand
A car park may be necessary to determine the starting point of the activity.
💡 Tips:
komoothighlights, and their users comments, can also provide valuable information about parking options.
Click to expand
Above sections were mainly about finding attractive places with nice views. 📸
But you may also want to look for training spots. 💪 For instance for an uphill/downhill workout.
Several options are available to find a spot for uphill/downhill training:
- ⛰️ You can inspect a map with a
terrainor3dlayer, and identify non-flat areas.- For instance
google mapswithterrainlayer, orstrava-global-heatmapwith thewintermap style (which renders the terrain very well, as illustrated in thestrava global heatmapsection).
- For instance
- 🏆 You can also use
strava-segments:- They are portions of roads or trails created by
stravamembers where athletes can compare times. - Use a
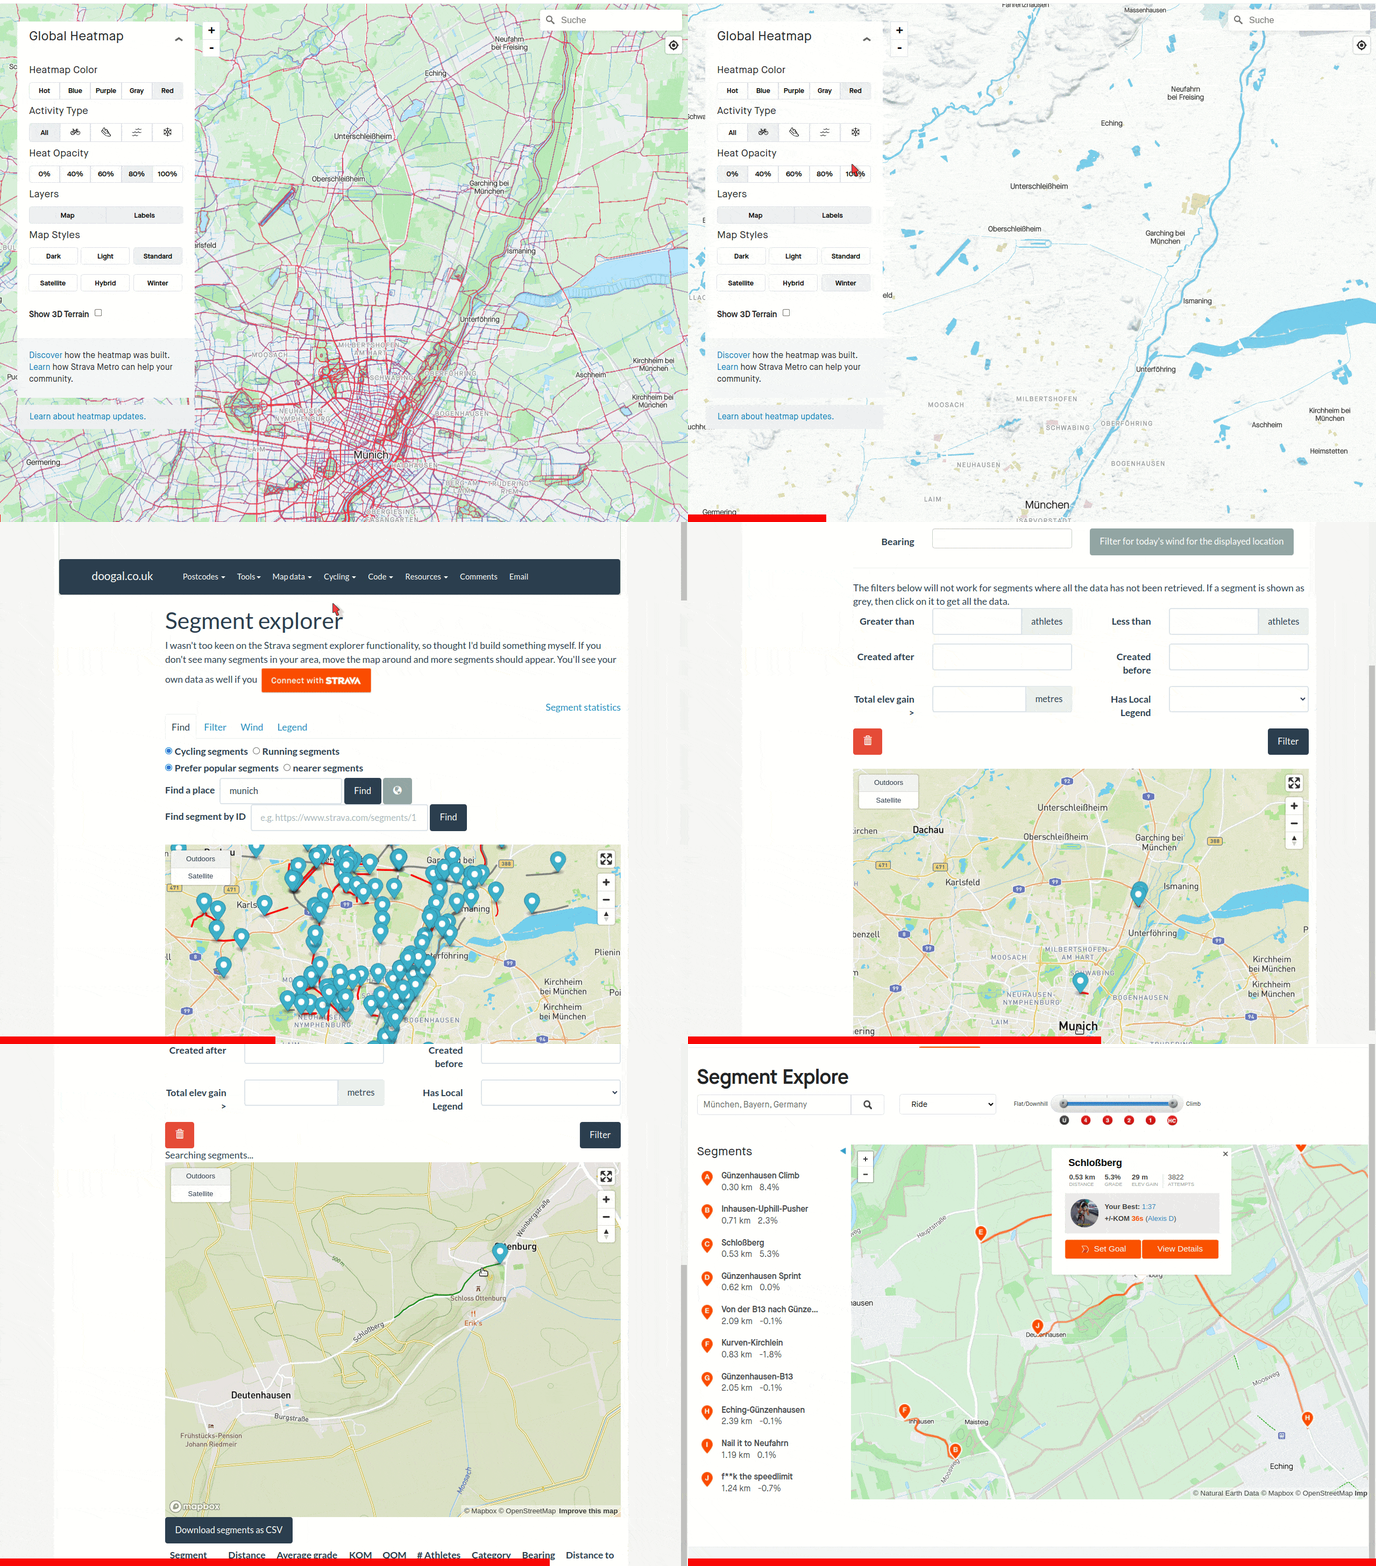
strava segment explorer(either fromdoogal.co.uk, which offers more filters, or from strava) and apply filters such asaverage grade,elevation difforclimb categoryto retrieve uphill/downhill segments.
- They are portions of roads or trails created by
 |
|---|
This example shows how to look for a place in the north of Munich with cycling climbs. The strava-global-heatmap, with the winter map style, gives a good overview of the terrain: an area with slope is identified (Schloss Ottenburg). Zooming in, a small yet hilly round tour is discovered. This place could be very good for an uphill workout 🏋️. Then the example switches website and uses the strava segment explorer of doogal.co.uk. The Schloßberg segment (530m at 5.3%) is discovered (same hill as the one previously found using the strava-global-heatmap). Finally, the official strava segment explorer is used, but its filter features are really limited: only the climb category criteria, which does not even retrieve the Schloßberg segment (probably it is not steep/long enough). |
💡 Tip:
Quäldich(literally "torture yourself" in German) references road-cycling climbs (more than 8000 entries, mainly in Europe). ⛰️- Climbs are evaluated by users, who also post comments and pictures.
- A tour-planning software can be downloaded.
- Similarly to the
strava-global-heatmap, activities ofQuäldichusers are collected, aggregated and displayed on the map and help planning routes.
- Similarly to the
Click to expand
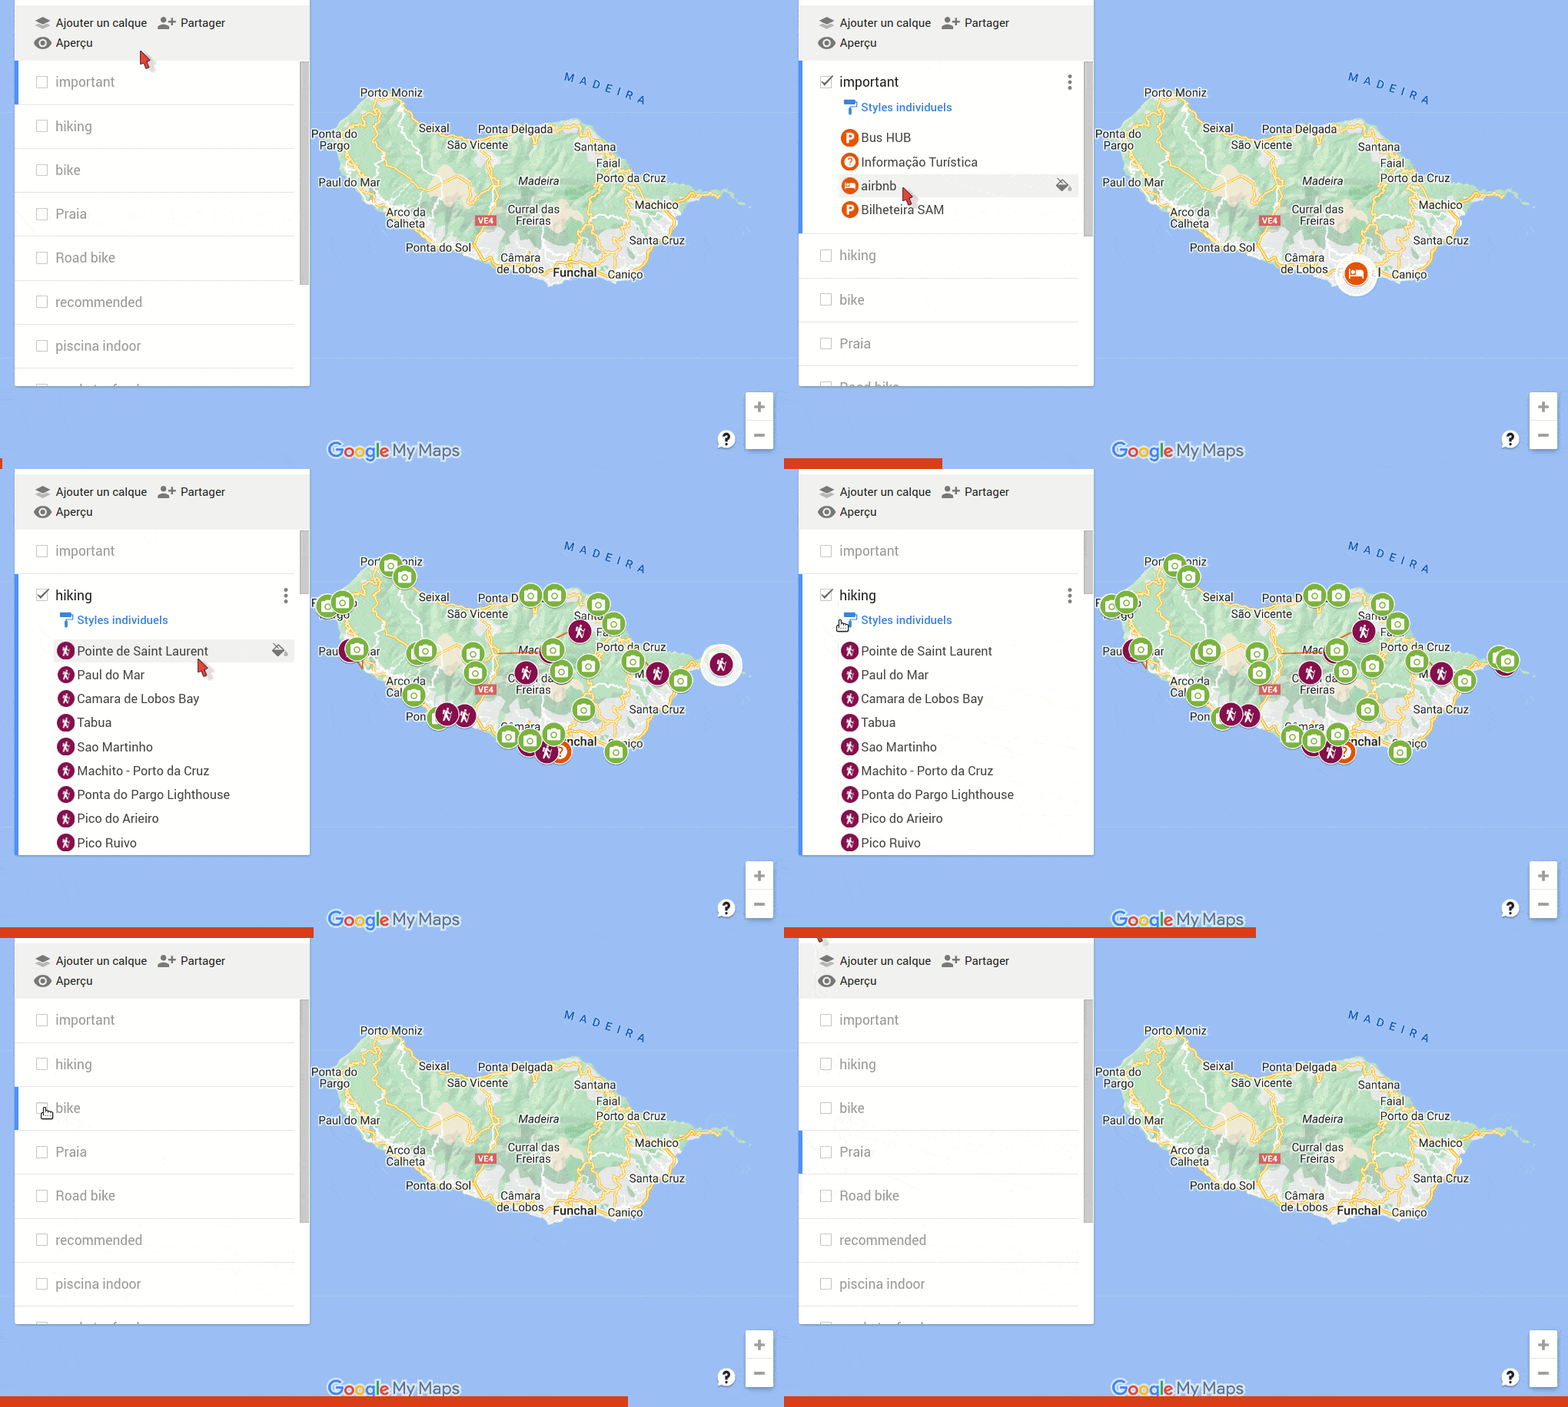
How to visualize all the ideas you have collected from diverse sources?
One solution is My Maps from Google.
"
My Mapsmakes it easy for you to create beautiful maps and share them with others."
💡 Tips:
- It can be a good strategy to choose the location for your accommodation based on your
My Mapsthat shows an overview of what you want to do in a given region.
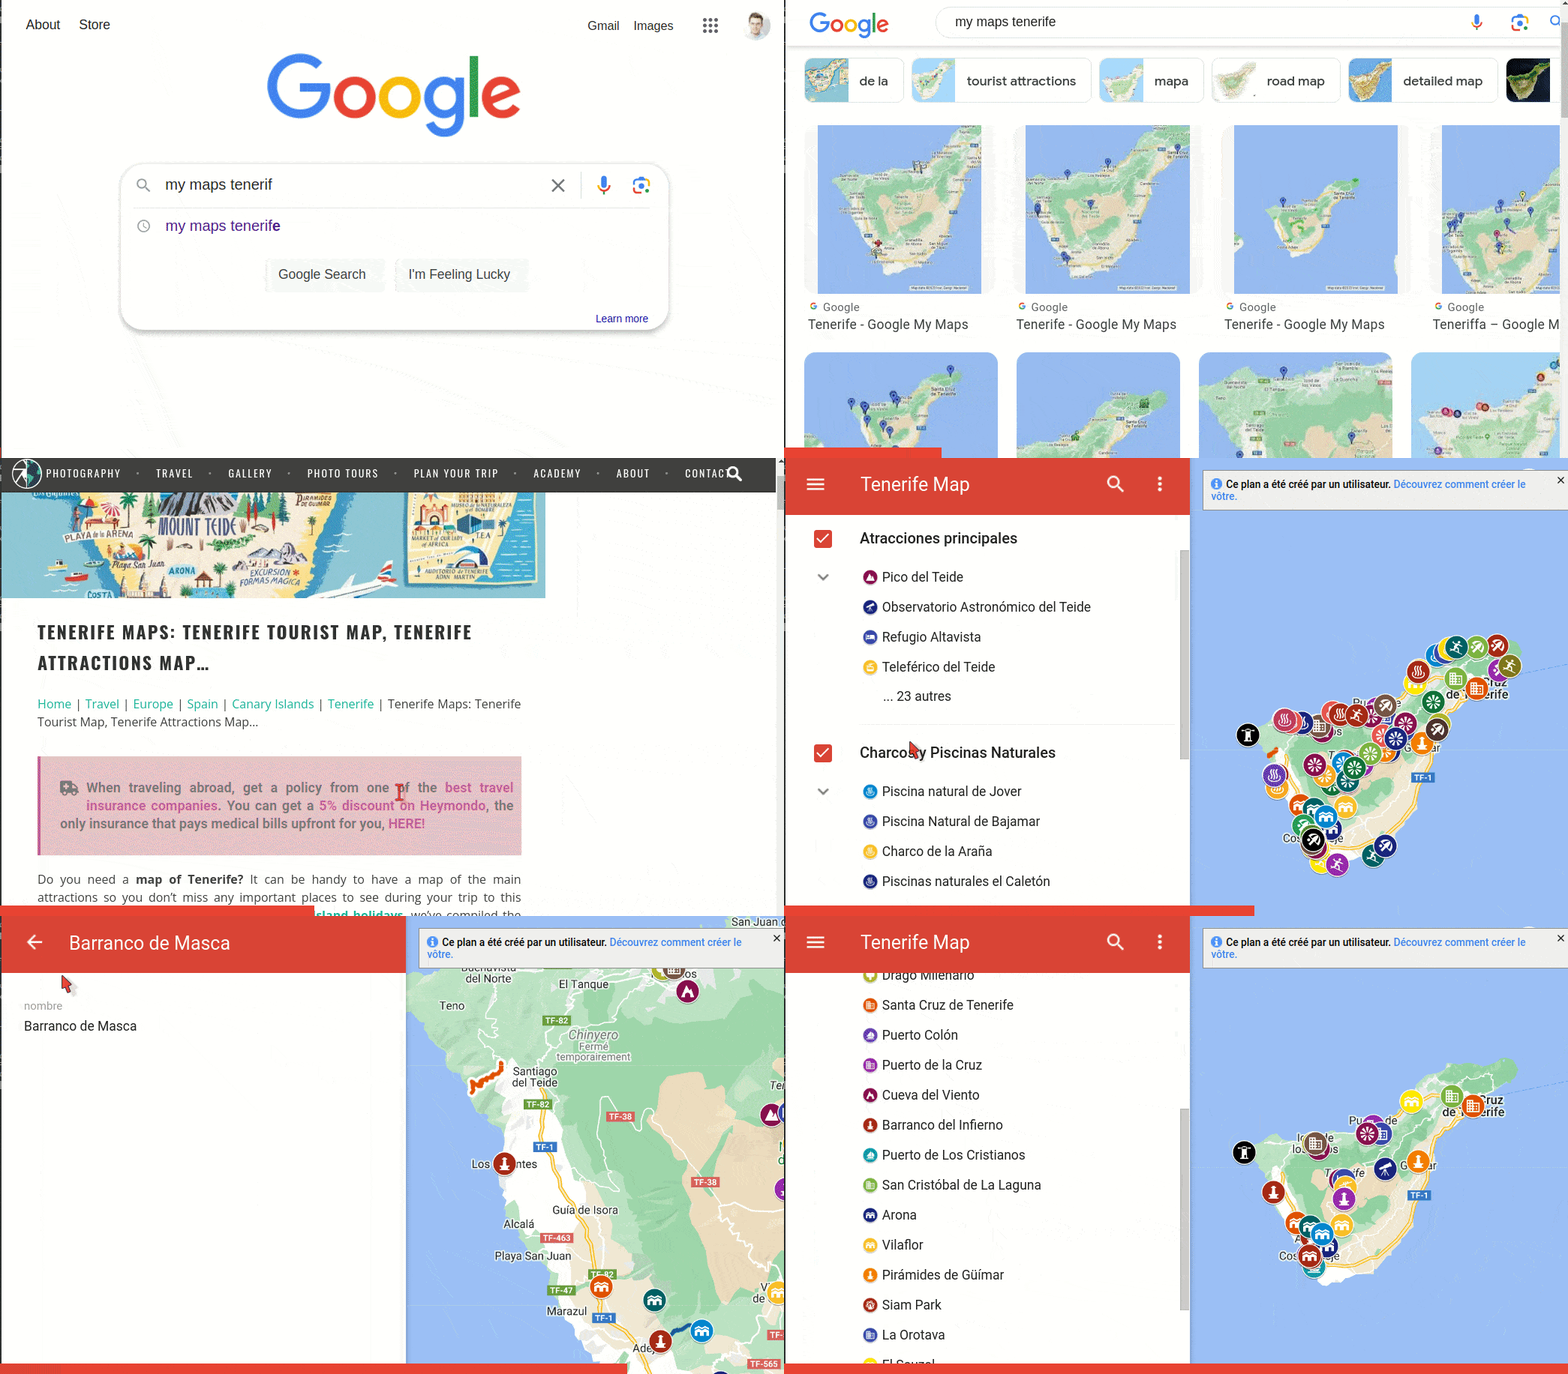
My Maps can also be used to get inspired; some people share their maps. 🤗
 |
|---|
Finding some My Maps online and get inspired by it. |
💡 Tips:
- To find
My Mapsof other people, search for"[your destination] My Maps"inGoogle Search Imageand select the images that look like aMy Maps. - You can export a
My Mapsfound online, and import it into yours. .gpxfiles can also be uploaded to aMy Maps.
☝️ We continue here section 1 - get inspired, which is about finding ideas before creating a route (section 2) and verifying it section 3.
- Ideas in the form of "waypoints" have been collected in the previous subsection (1.1 points).
- This subsection focuses on finding inspiration from already existing routes.
🖥️ Nowadays .gpx files of routes can easily be found online but there are a few problems:
- Tons of routes are available - it is too much!
- Many are redundant.
- Some are outdated / infeasible / dangerous.
❓ This raises the question:
- How to find nice tours in a given region that help you prepare yours?
Three methods using komoot are introduced:
Click to expand
"The
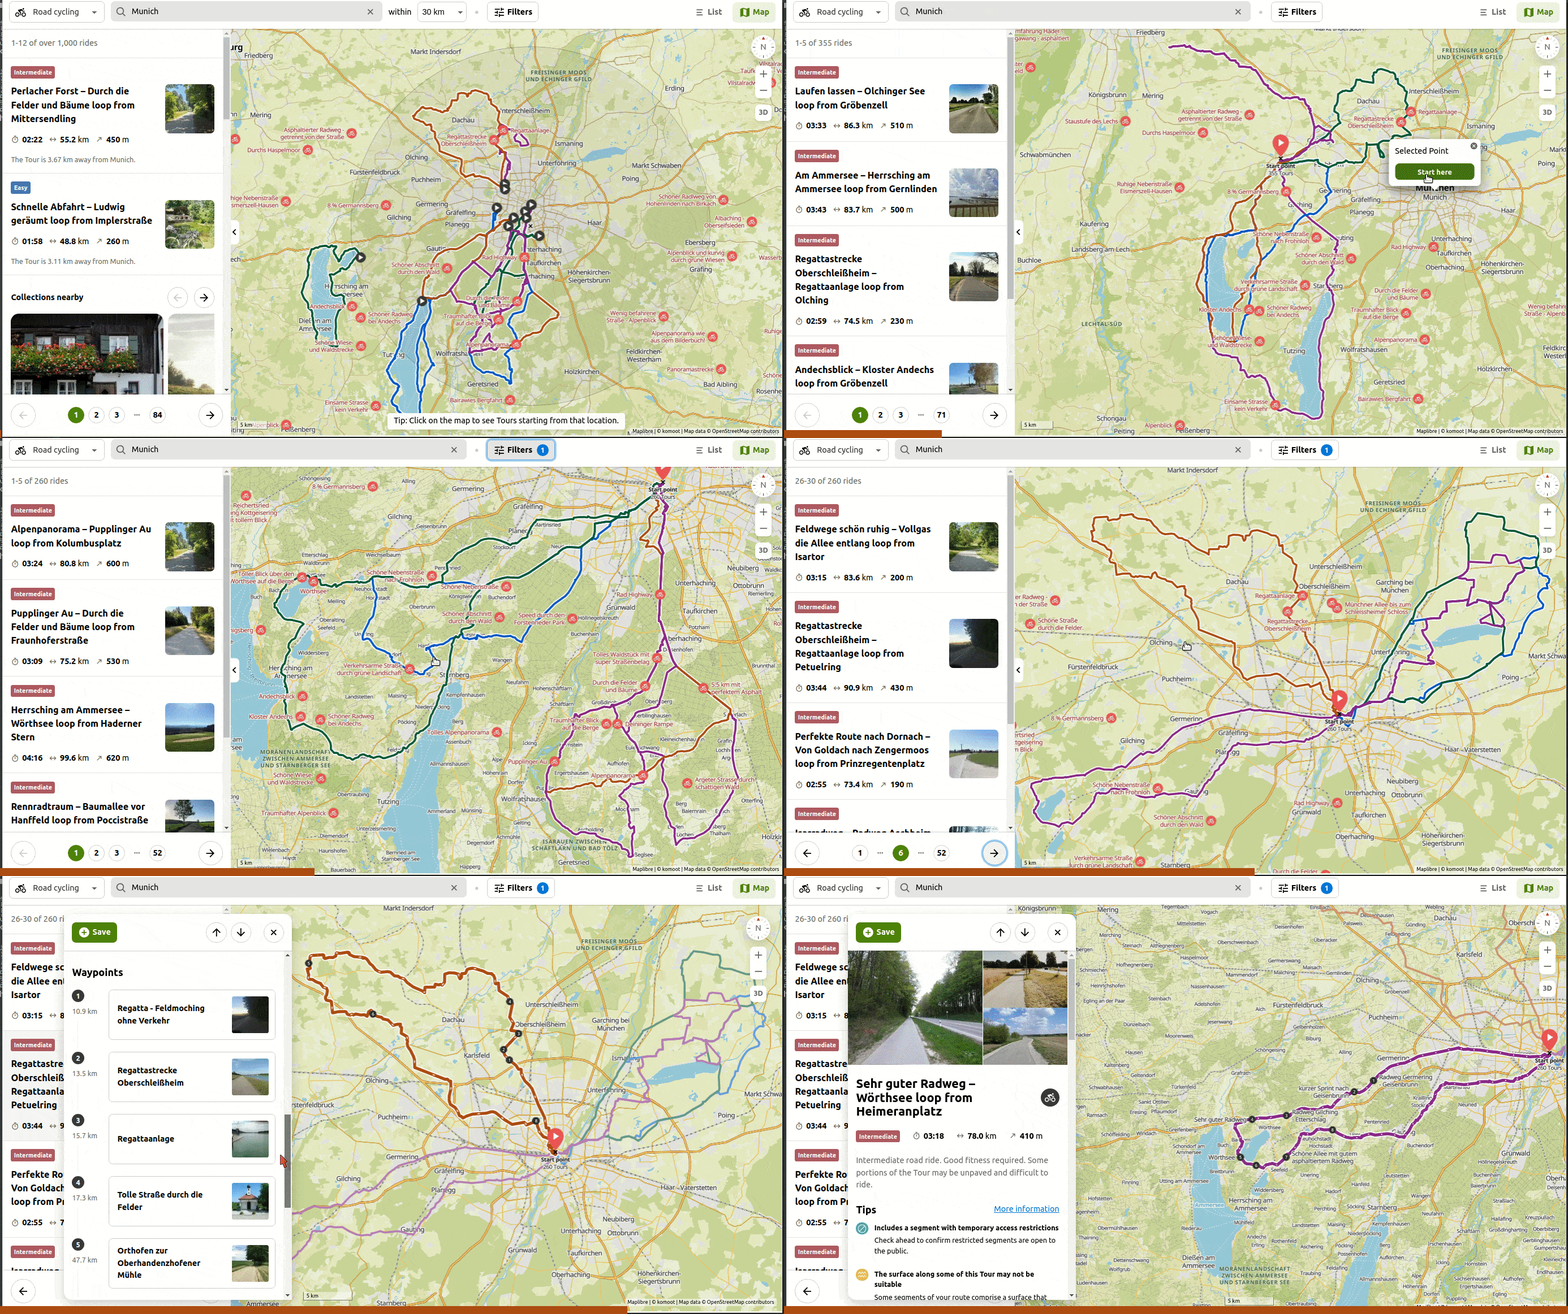
komoottour suggestions you receive through the search function consist exclusively of automatically generated Tour recommendations, known asSmart tours." 🧞
 |
|---|
Based on the activity type and filters, tours are suggested by the komoot-search-engine. |
Learn out more in this article.
Click to expand
komoot Collections are compilations of multiple tours in a specific region. For instance:
- Some private users share their multiple-day trips.
- Some tourism agencies promote their region by showcasing examples of tours.
komoot Collections can be browsed in this page.
 |
|---|
Looking for a komoot Collection about "crossing the Alps with the mountain bike" - example of a collection created by user. |
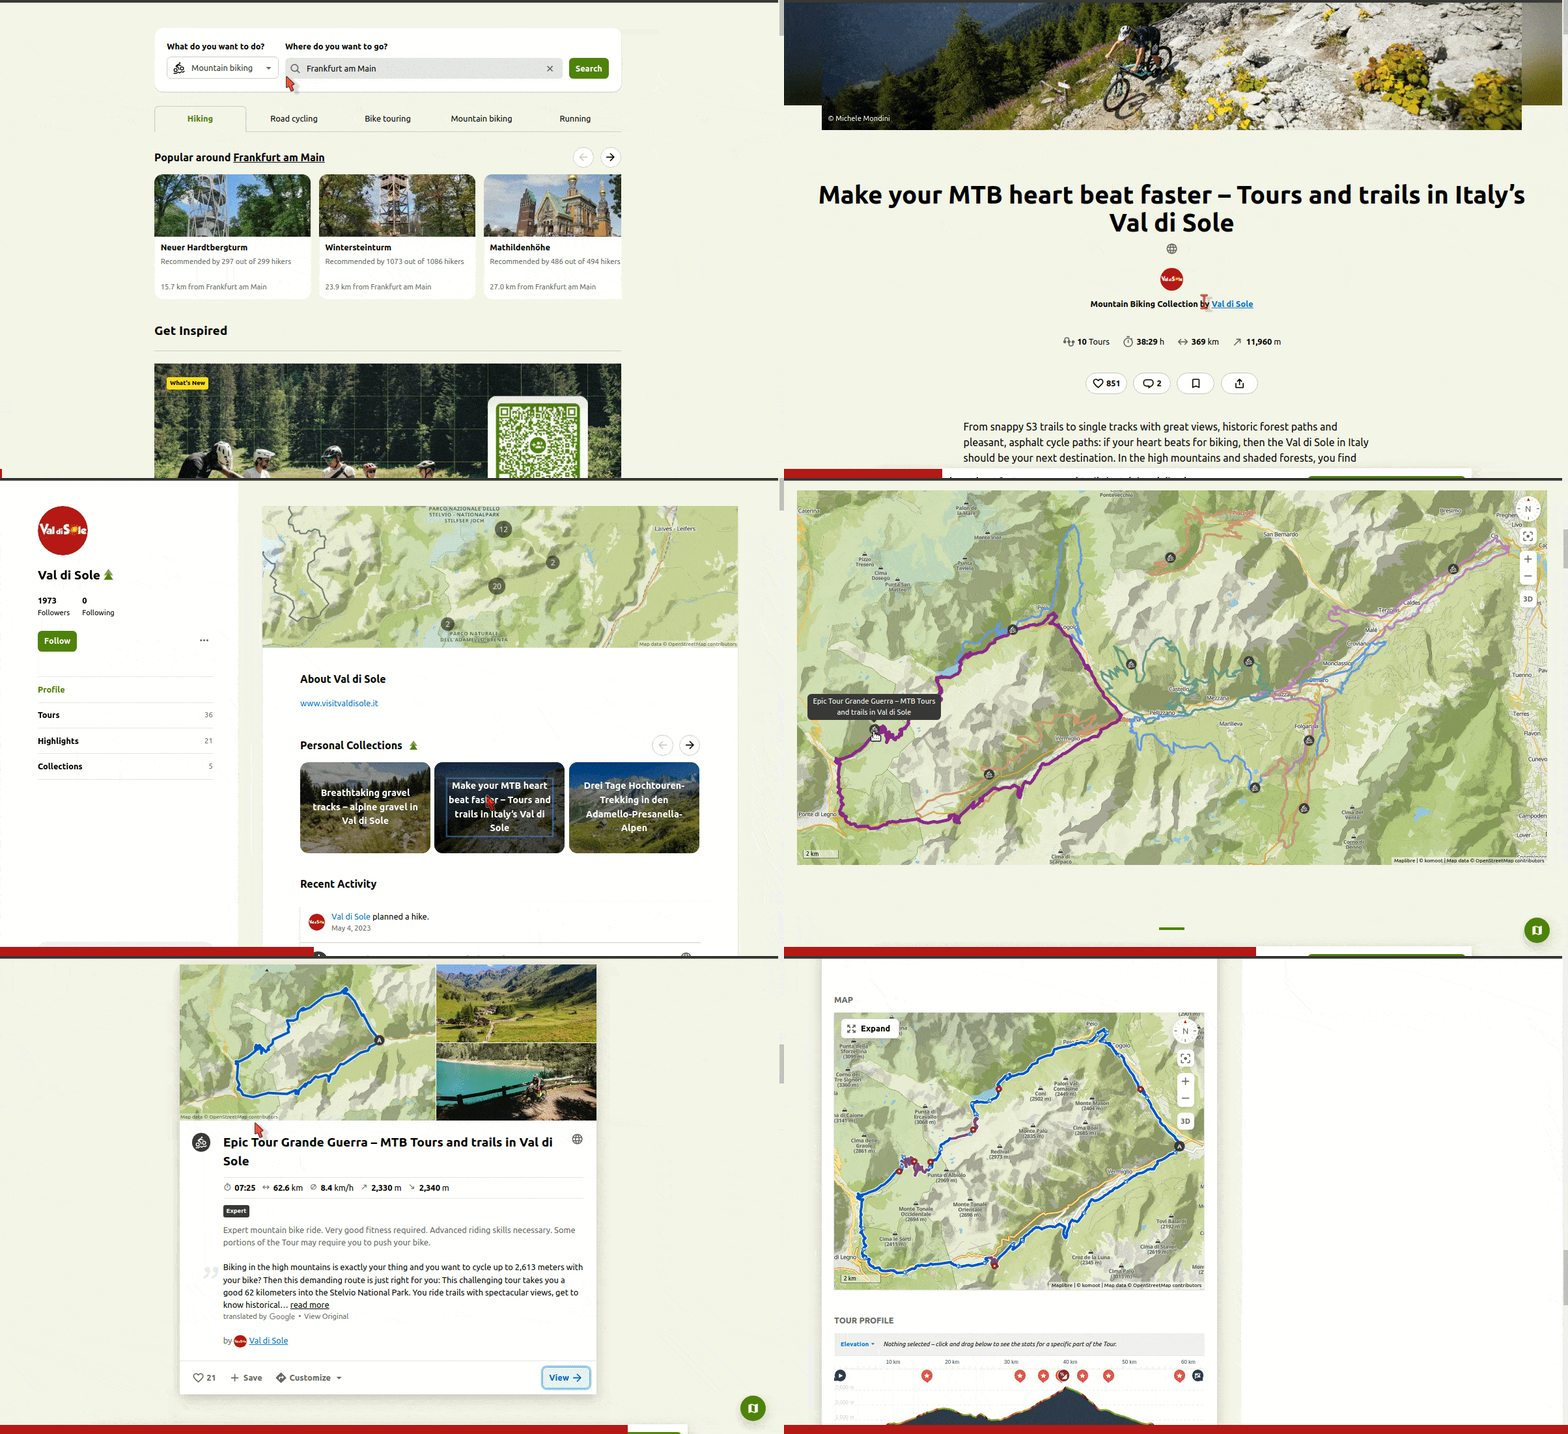 |
|---|
| Example of a Collection created by a tourism agency to promote its region. |
Click to expand
It is possible to receive suggestions for tours that include a place you have found (see the related section as komoot Highlight.
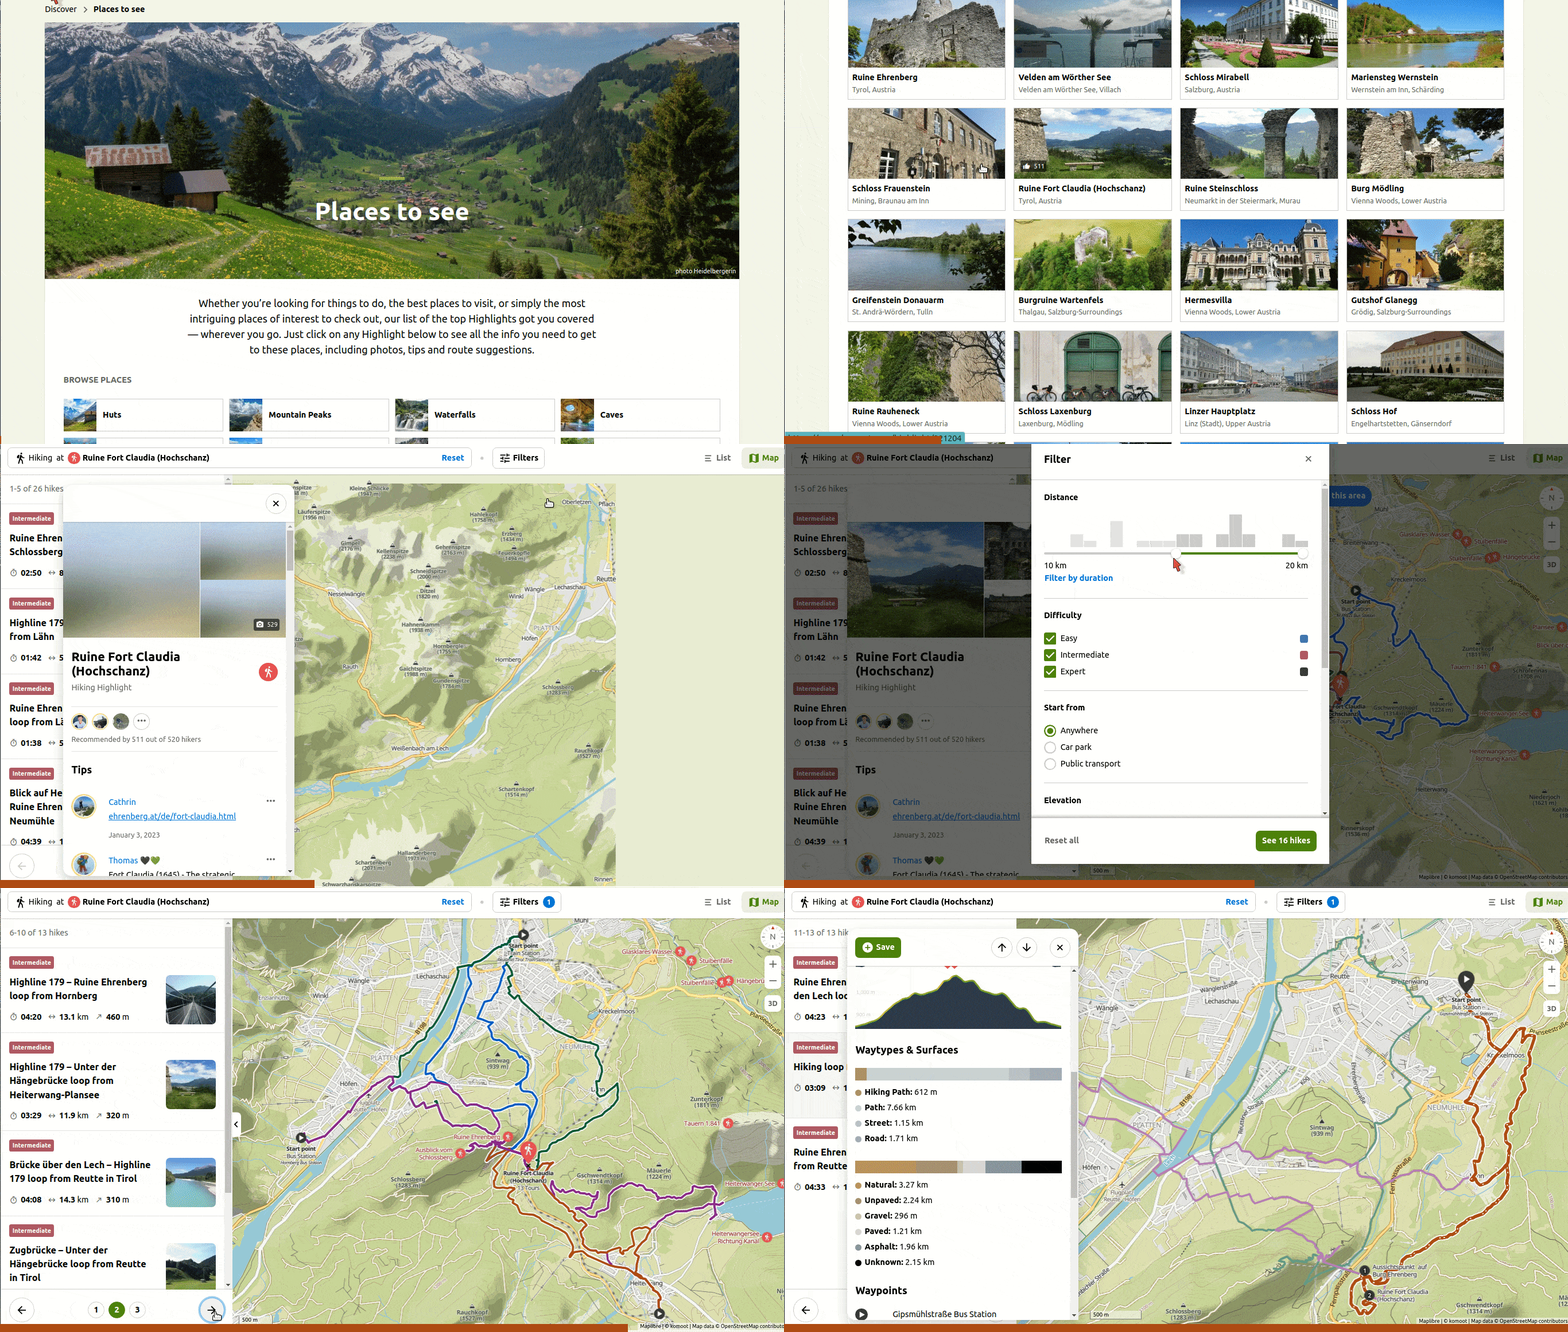 |
|---|
Searching for hike around a komoot highlight: the suggestion system is the same as above, i.e. tours are automatically generated. |
Click to expand
The route finder tool of outdoor-active is similar to that of komoot.
- However, recommended tours are not generated by an engine; instead, they have been created by users.
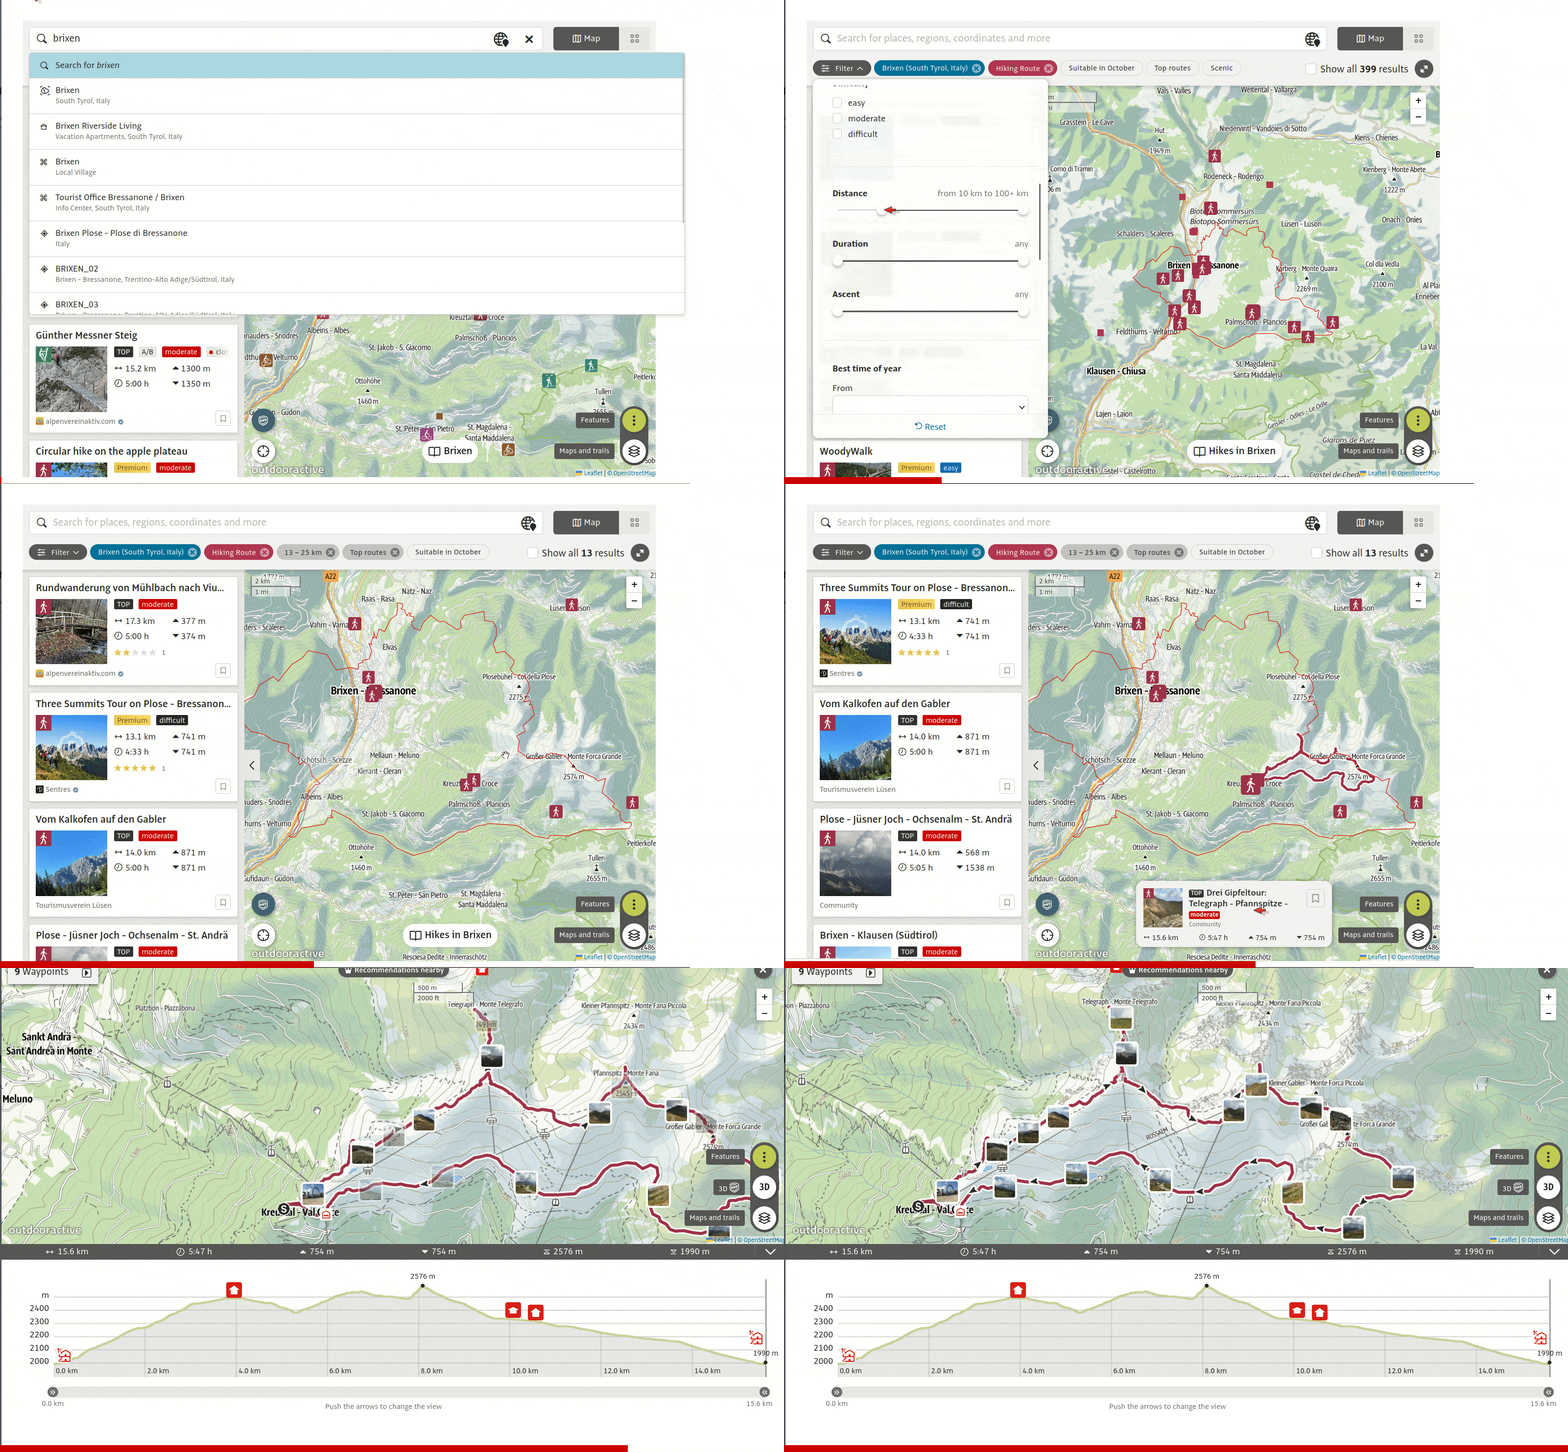 |
|---|
Routes can easily be found with the "Route Finder" of outdoor-active. |
💡 Tips:
- If too many results are shown, apply the
Top routesfilter to only keep the best ones. - Routes marked as "premium" cannot be fully visualized, however:
- The small preview is often enough to understand the track or re-create it on your own.
- The name of the tour can be searched for in a search-engine to find the
.gpxon other websites.
Three methods using strava are introduced:
Click to expand
☝️ In my opinion, the very first step when searching for activities in a region should be to consult the strava global heatmap
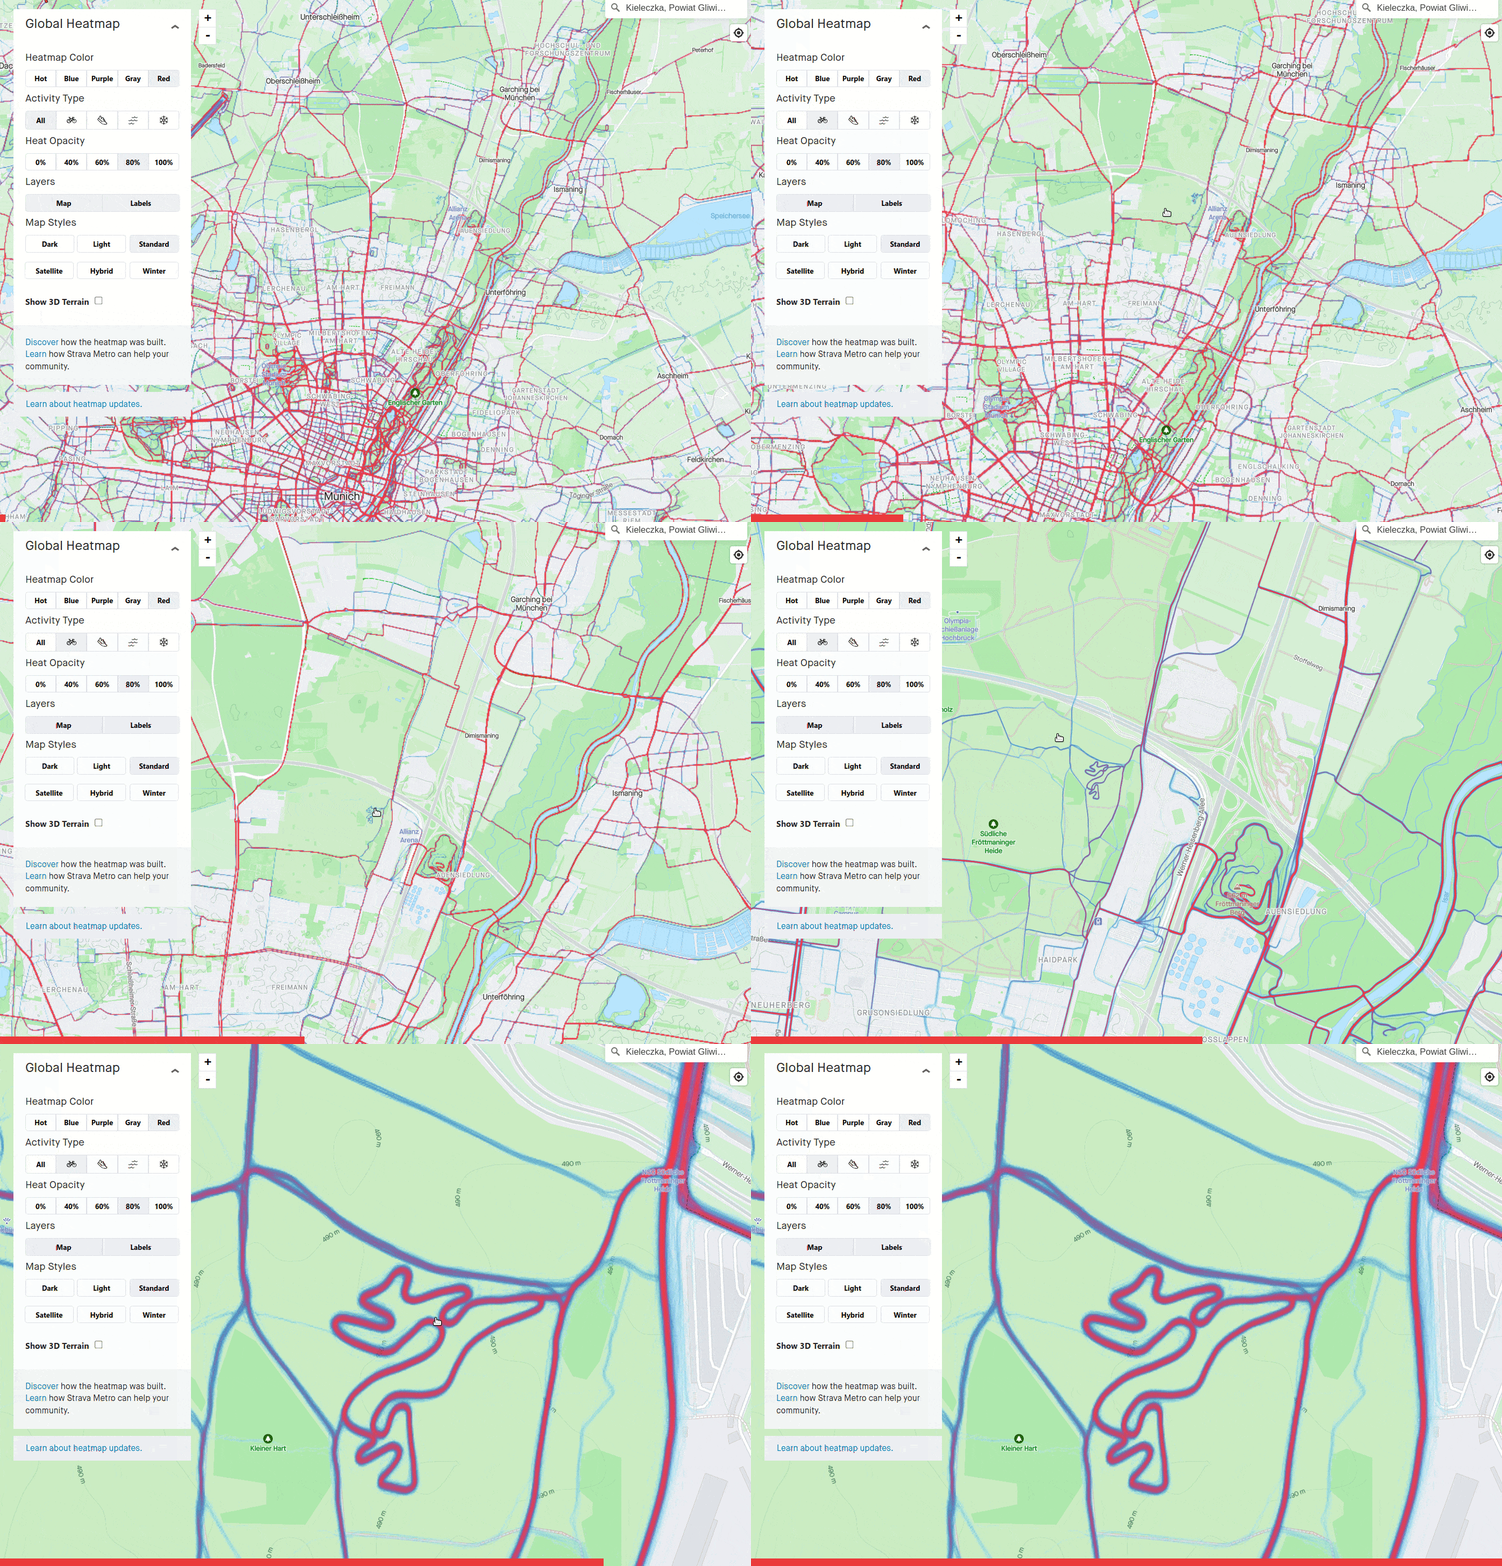 |
|---|
The strava global heatmap can be used to discover popular trails. In this example a pump track for mountain bike is discovered by zooming in. |
Click to expand
Similar to the komoot suggestion system, i.e. with automatically generated tour recommendations, but exclusive to premium account holders.
- More details here.
Click to expand
This is a more advanced method.
Currently, there is no direct "search for others' activities" feature in strava.
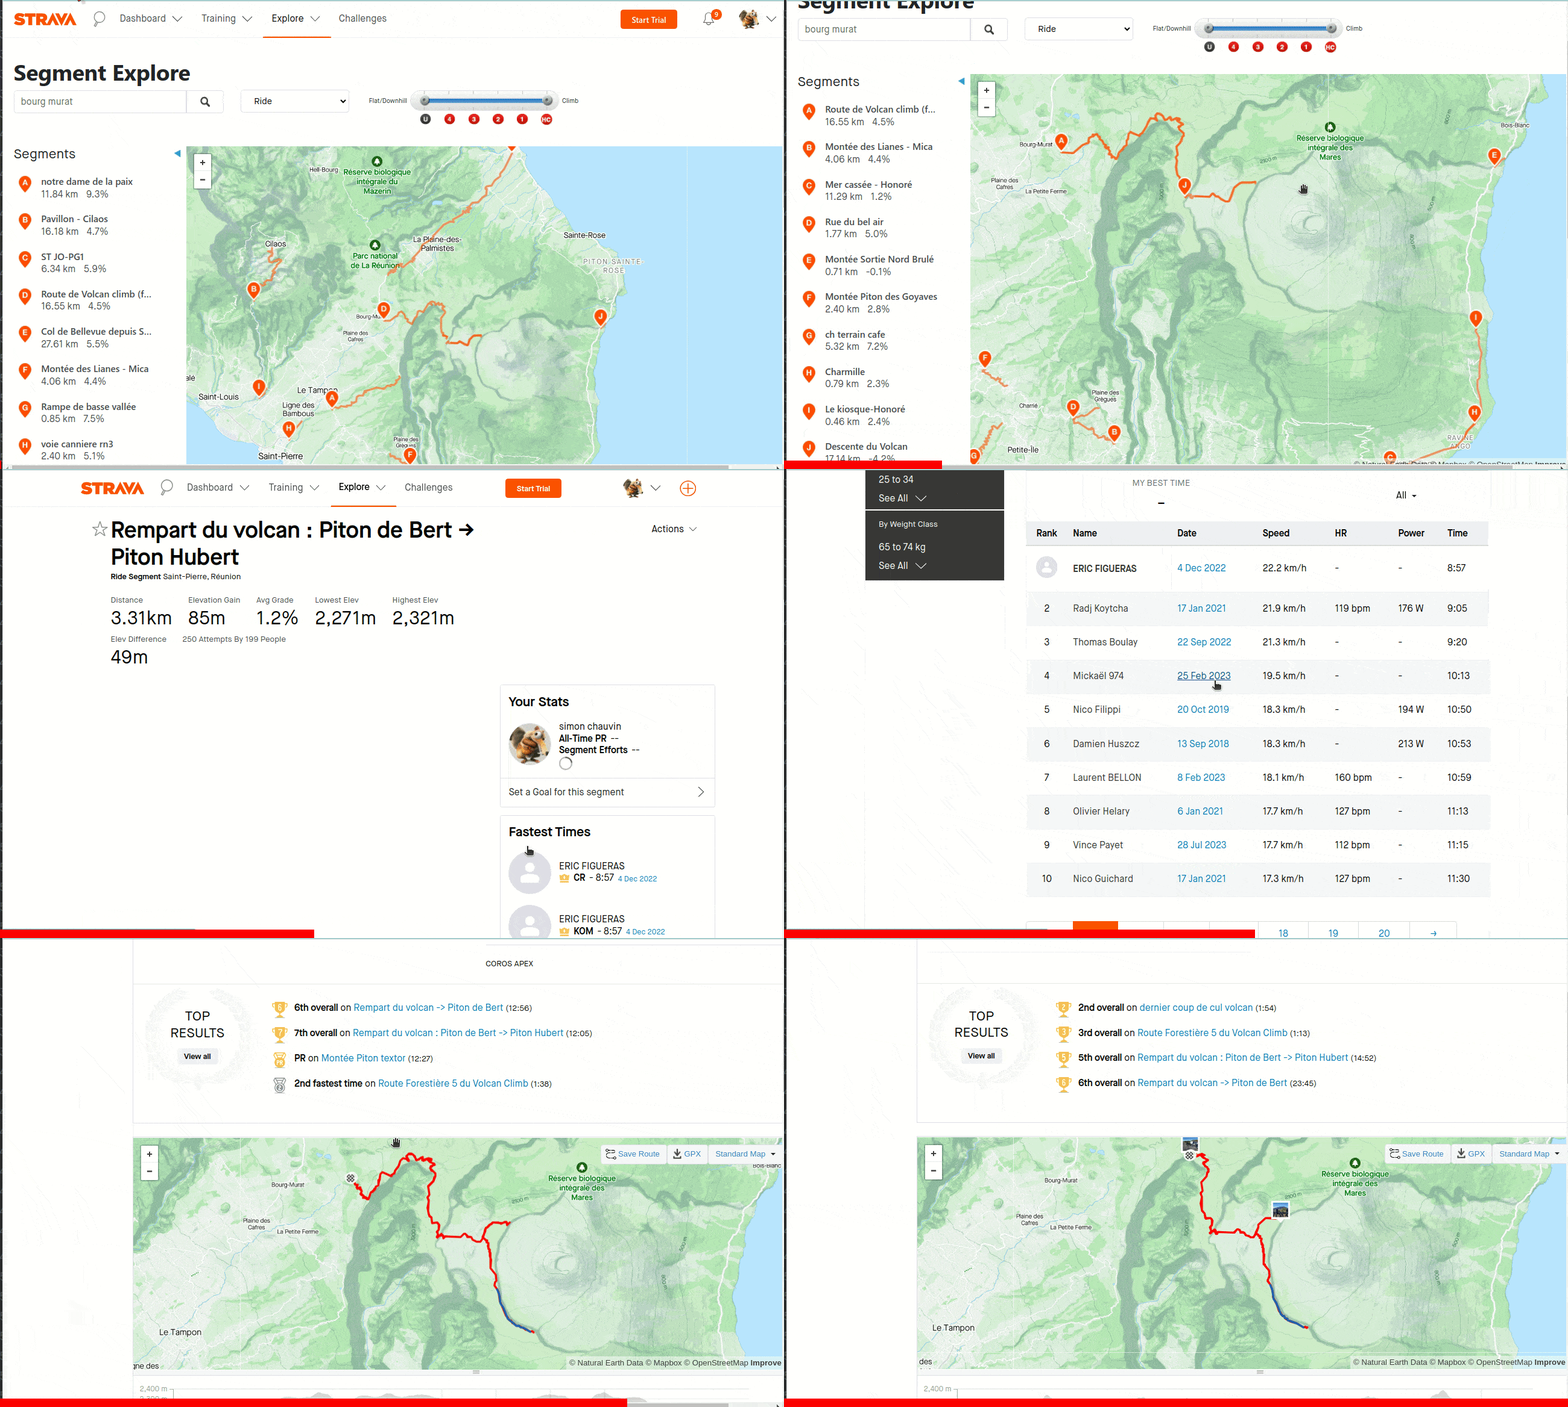
🧑🍳 Here is my method to find activities, using the segment explorer:
- 1- Open the
strava segment explorer(strava.com->Explore->Segment Explore). - 2- Choose one segment near your target destination.
- ☝️ Ensure that the "number of attempts" of this segment is not too small.
- 3- In the page of the segment, the leaderboard section (ranking of strava users) gives you access to each activity that includes this segment.
- ☝️ Verify that they are recent.
Click to expand
Rother is a German publisher known for producing popular guides for outdoor activities, primarily focused on hiking. 🥾
- This resource can be very valuable to quickly get detailed overviews of great tours in a given region.
🧑🍳 My recipe:
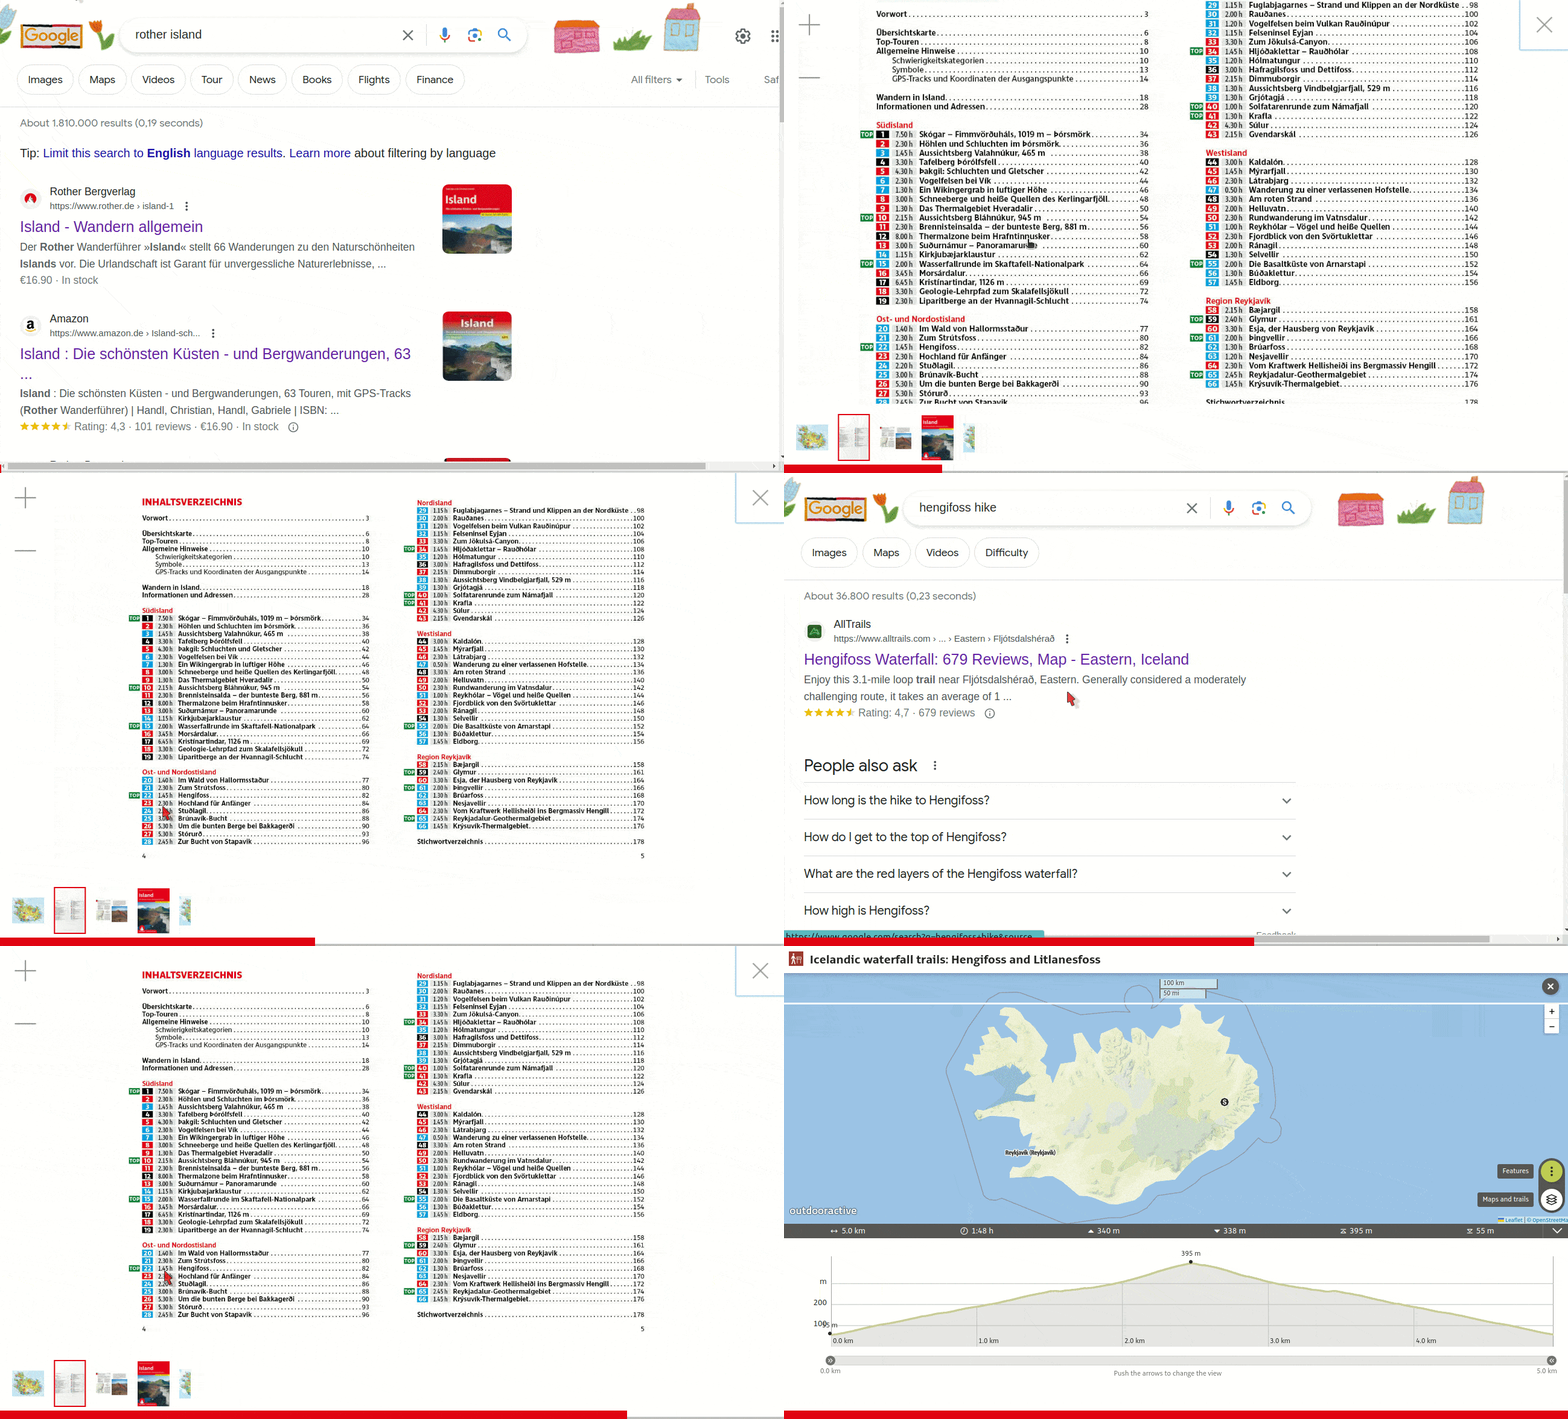
- 1- Search for "
Rother [YOUR DESTINATION]" in a search engine. - 2- Open the corresponding
Rotherpage. - 3- Among the preview images, you can find tour ideas using:
- The "overview map".
- The "table of contents".
💡 Tips:
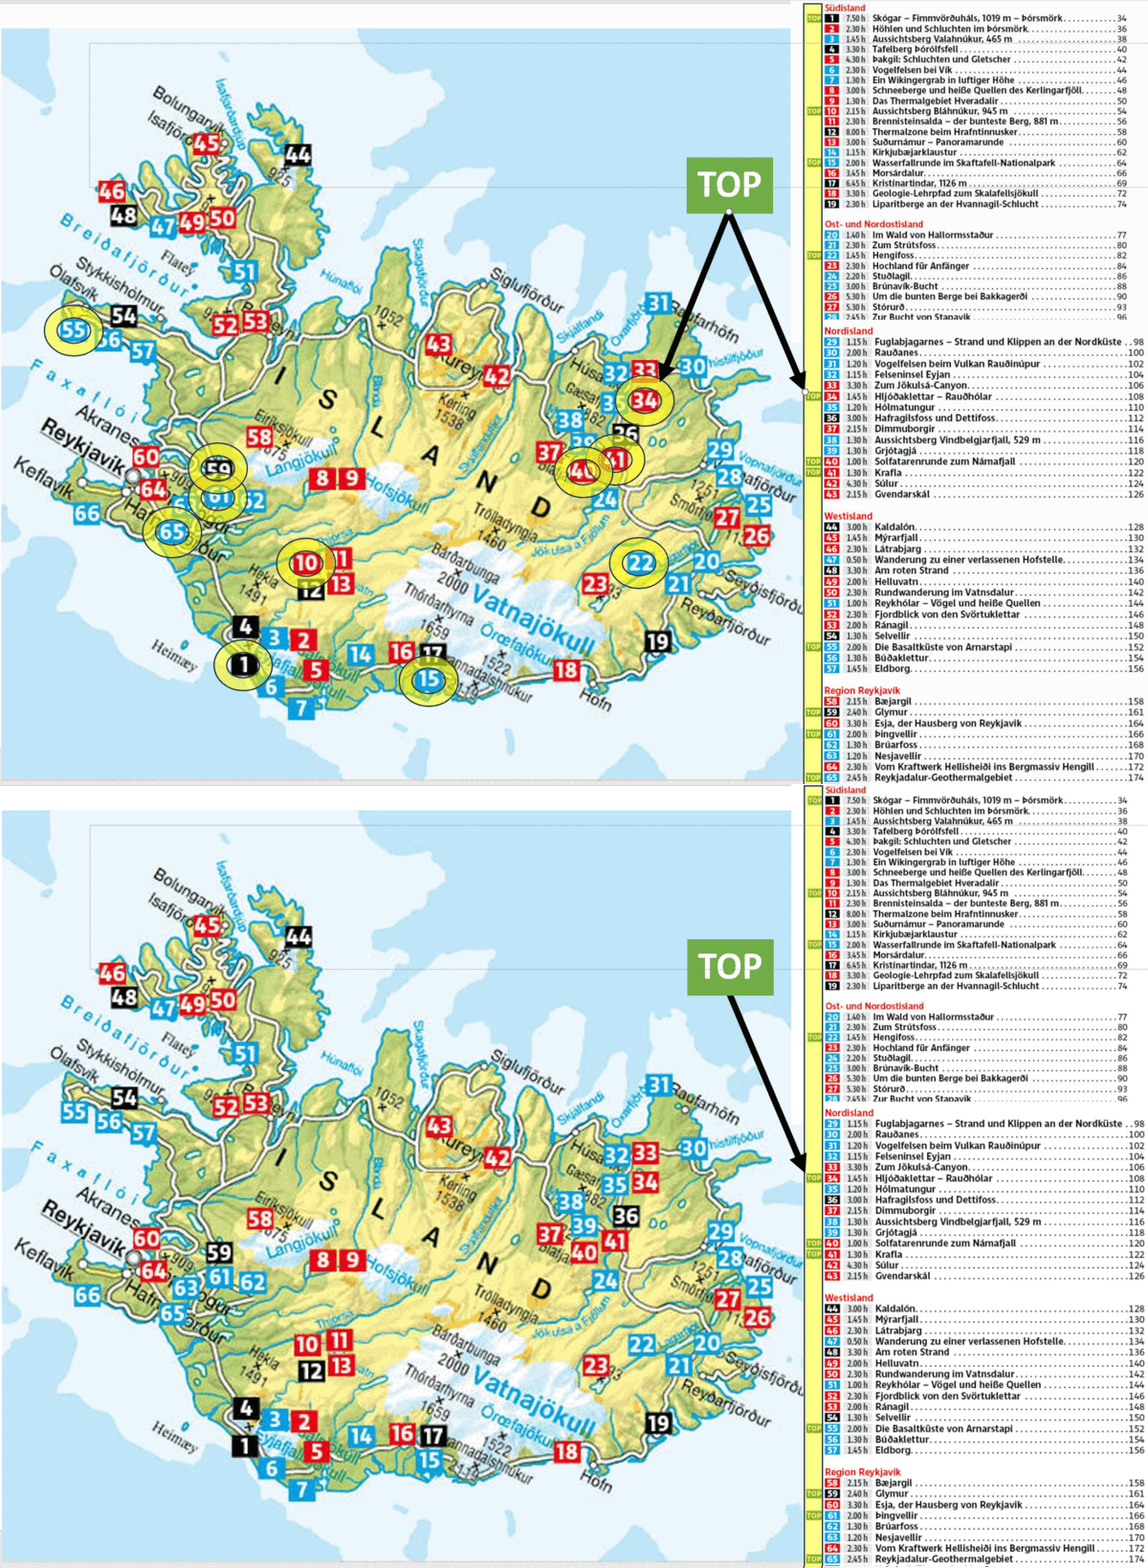
- The
Rothertable of contents lists the tours and marks some of them asTOP, whereas theRothermap does not show by default which tours are theTOPones.- Manually highlighting them can enrich the map overview.
Rothereditions are often updated. Therefore, ensure you are using the newest version.- Details of recommended tours can usually be found online, very easily, based on their name.
- Cross-check information from multiple websites.
 |
|---|
Highlighting the tours marked as TOP, based on the Rother table of contents, can enrich the map overview. |
💡 Tips:
- This map overview can help choosing a location for an accomodation place from which multiple top tours can be easily accessed.
- In the example above, two clusters of
TOPtours appear at first sight:34+40+41and59+61+65. - Other info such as accessibility (e.g. bus lines or road from an airport) should be considered as well.
- In the example above, two clusters of
- If you like, you can buy the (second-hand)
Rotherbook, e-book or app and get direct access to the.gpxfiles.
Click to expand
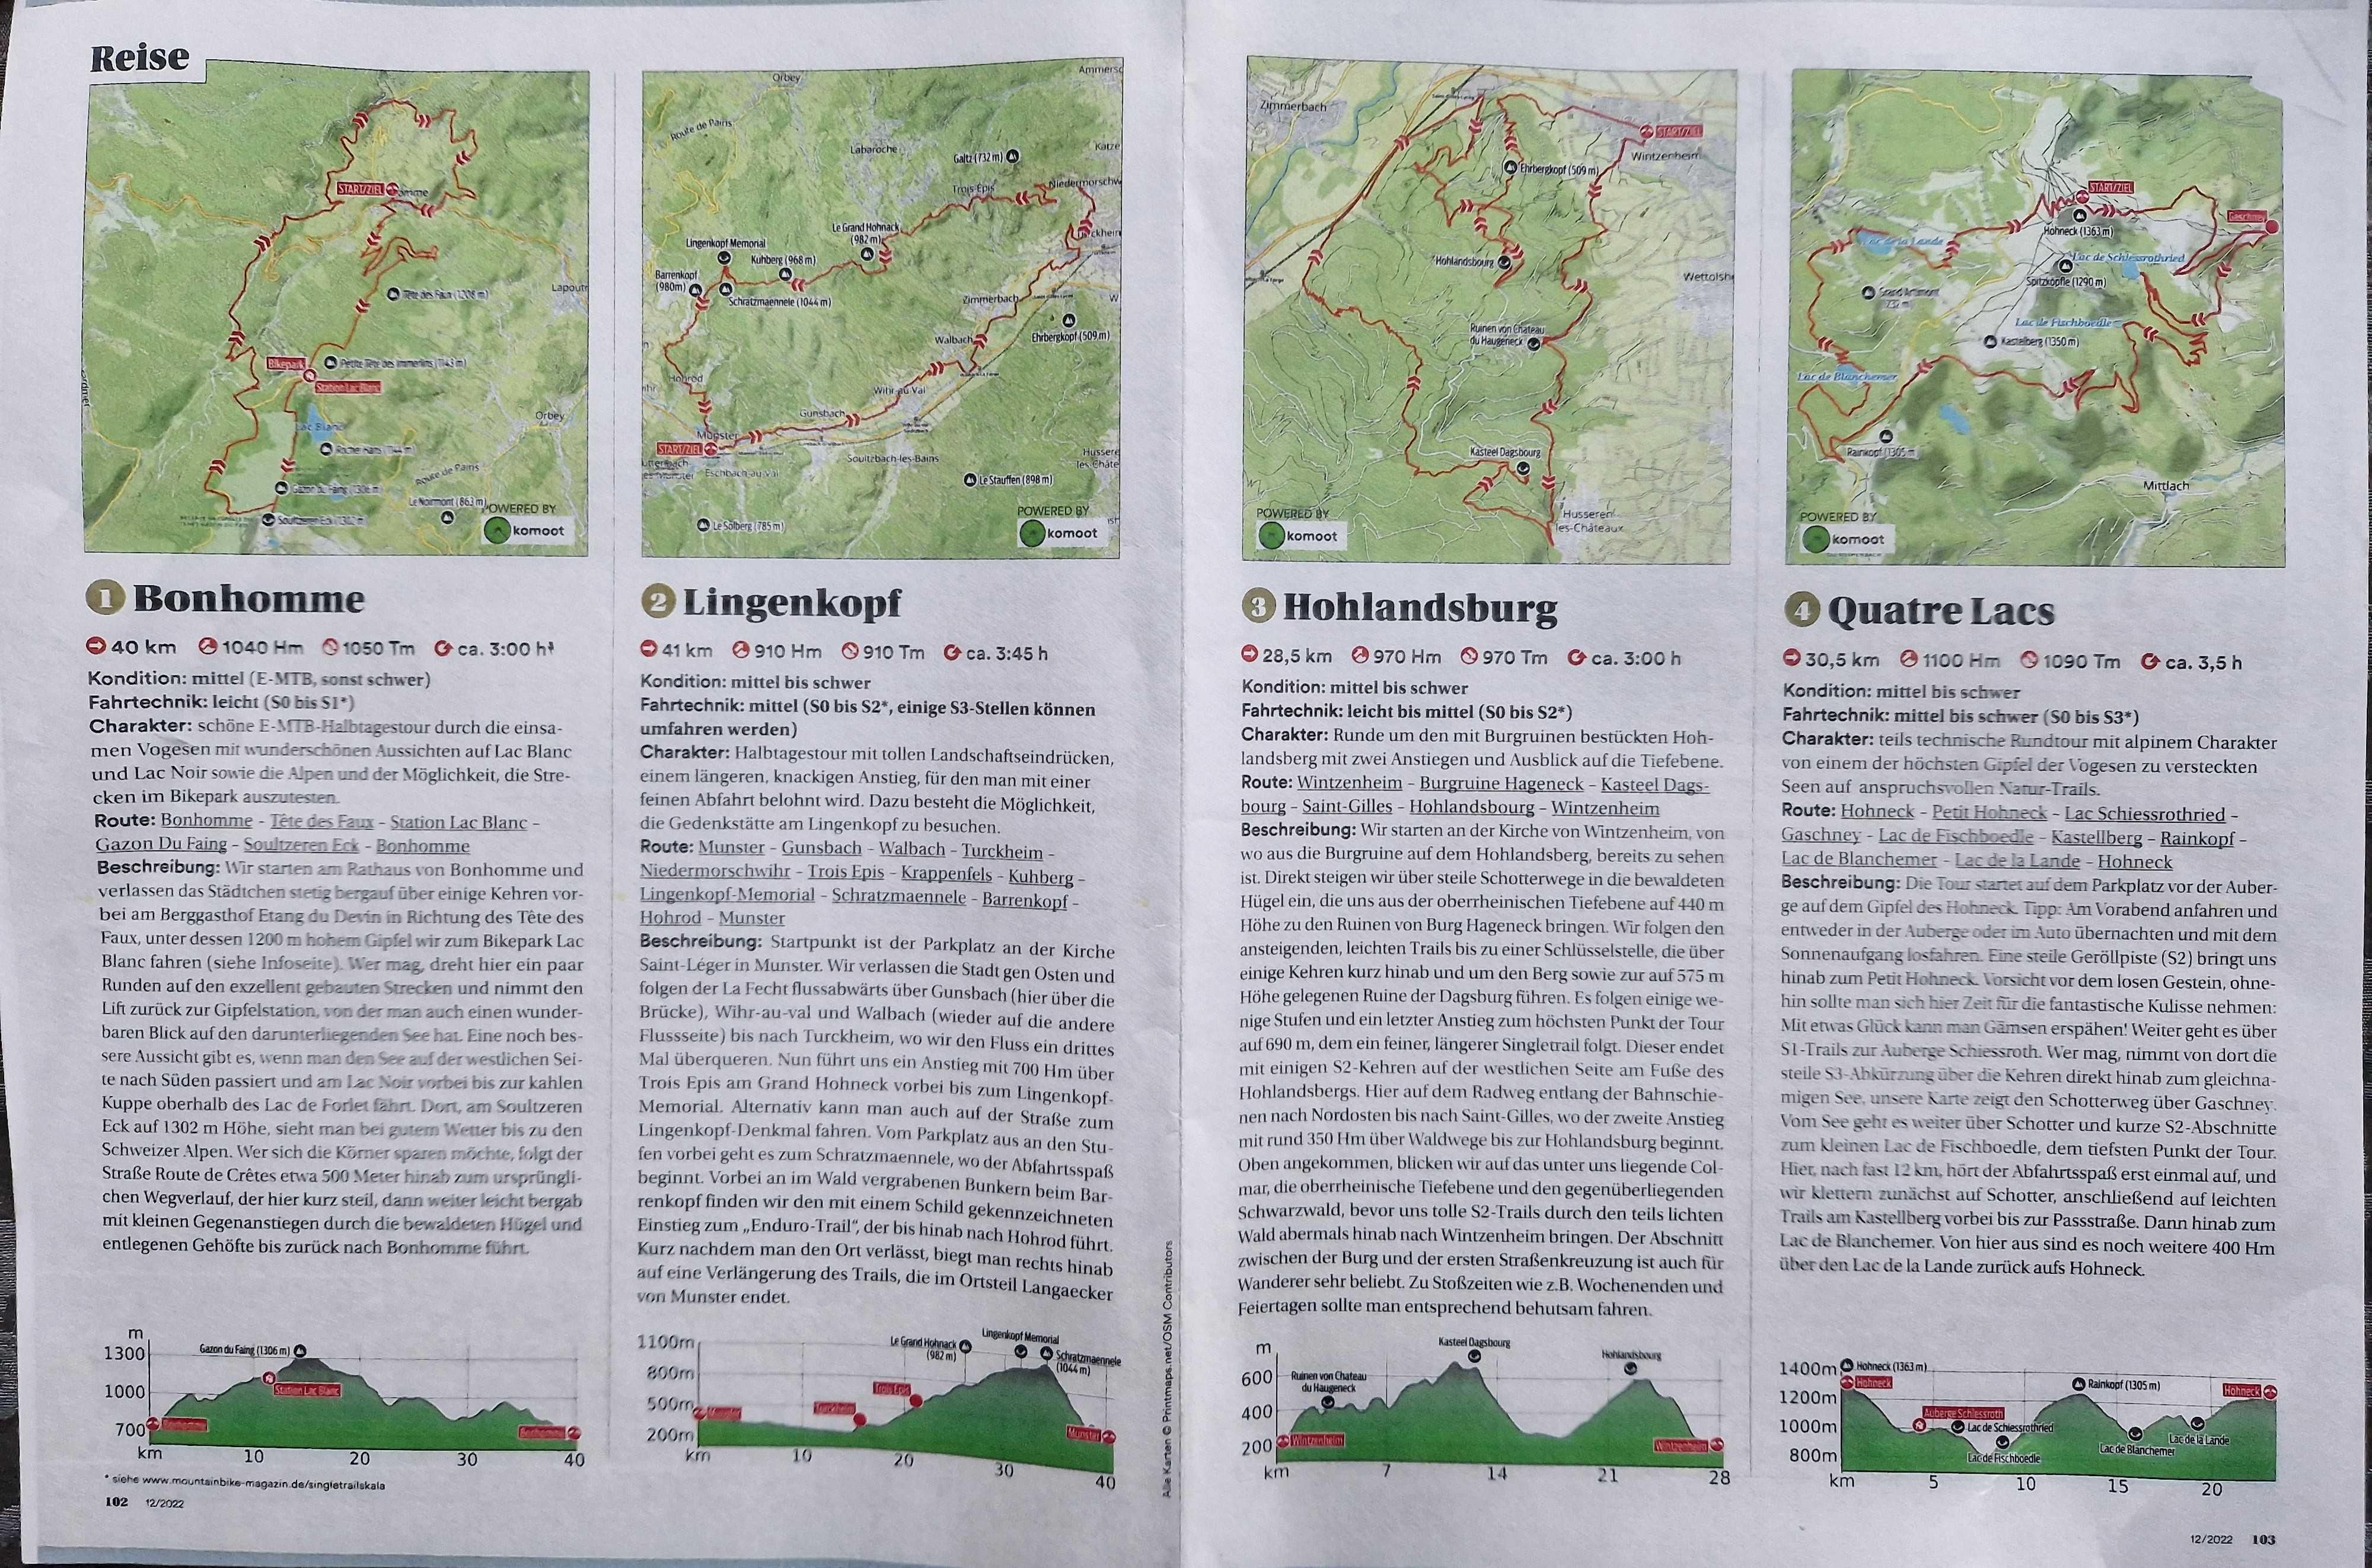
Some outdoor magazines publish inspiring travel reports about specific regions, typically accompanied by beautiful pictures and documented tours.
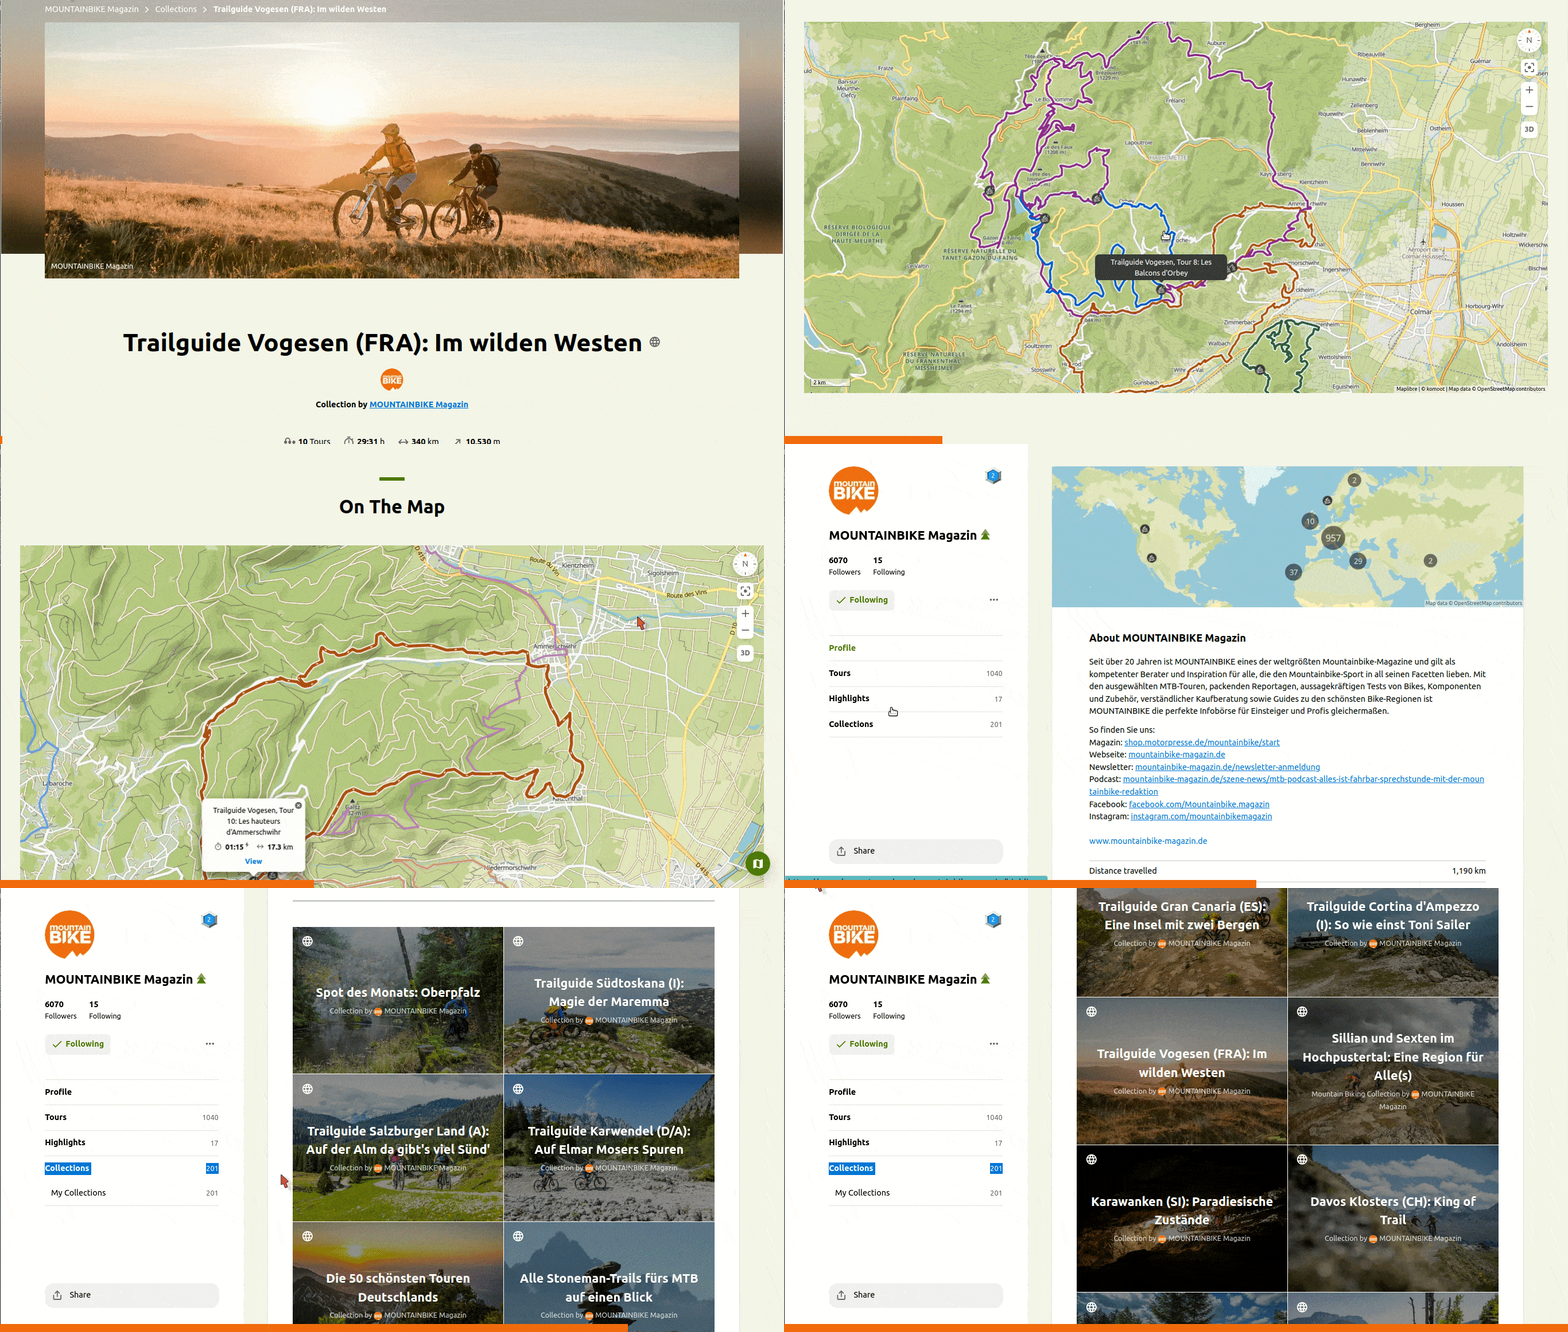
Such articles often come with a link to the tours, for instance this one.
 |
|---|
Tours included in a reportage about Vosges by mountainbike-magazin in 12/2022. |
 |
|---|
The corresponding komoot collection, and an overview of the numerous other collections published by mountainbike-magazin. |
Click to expand
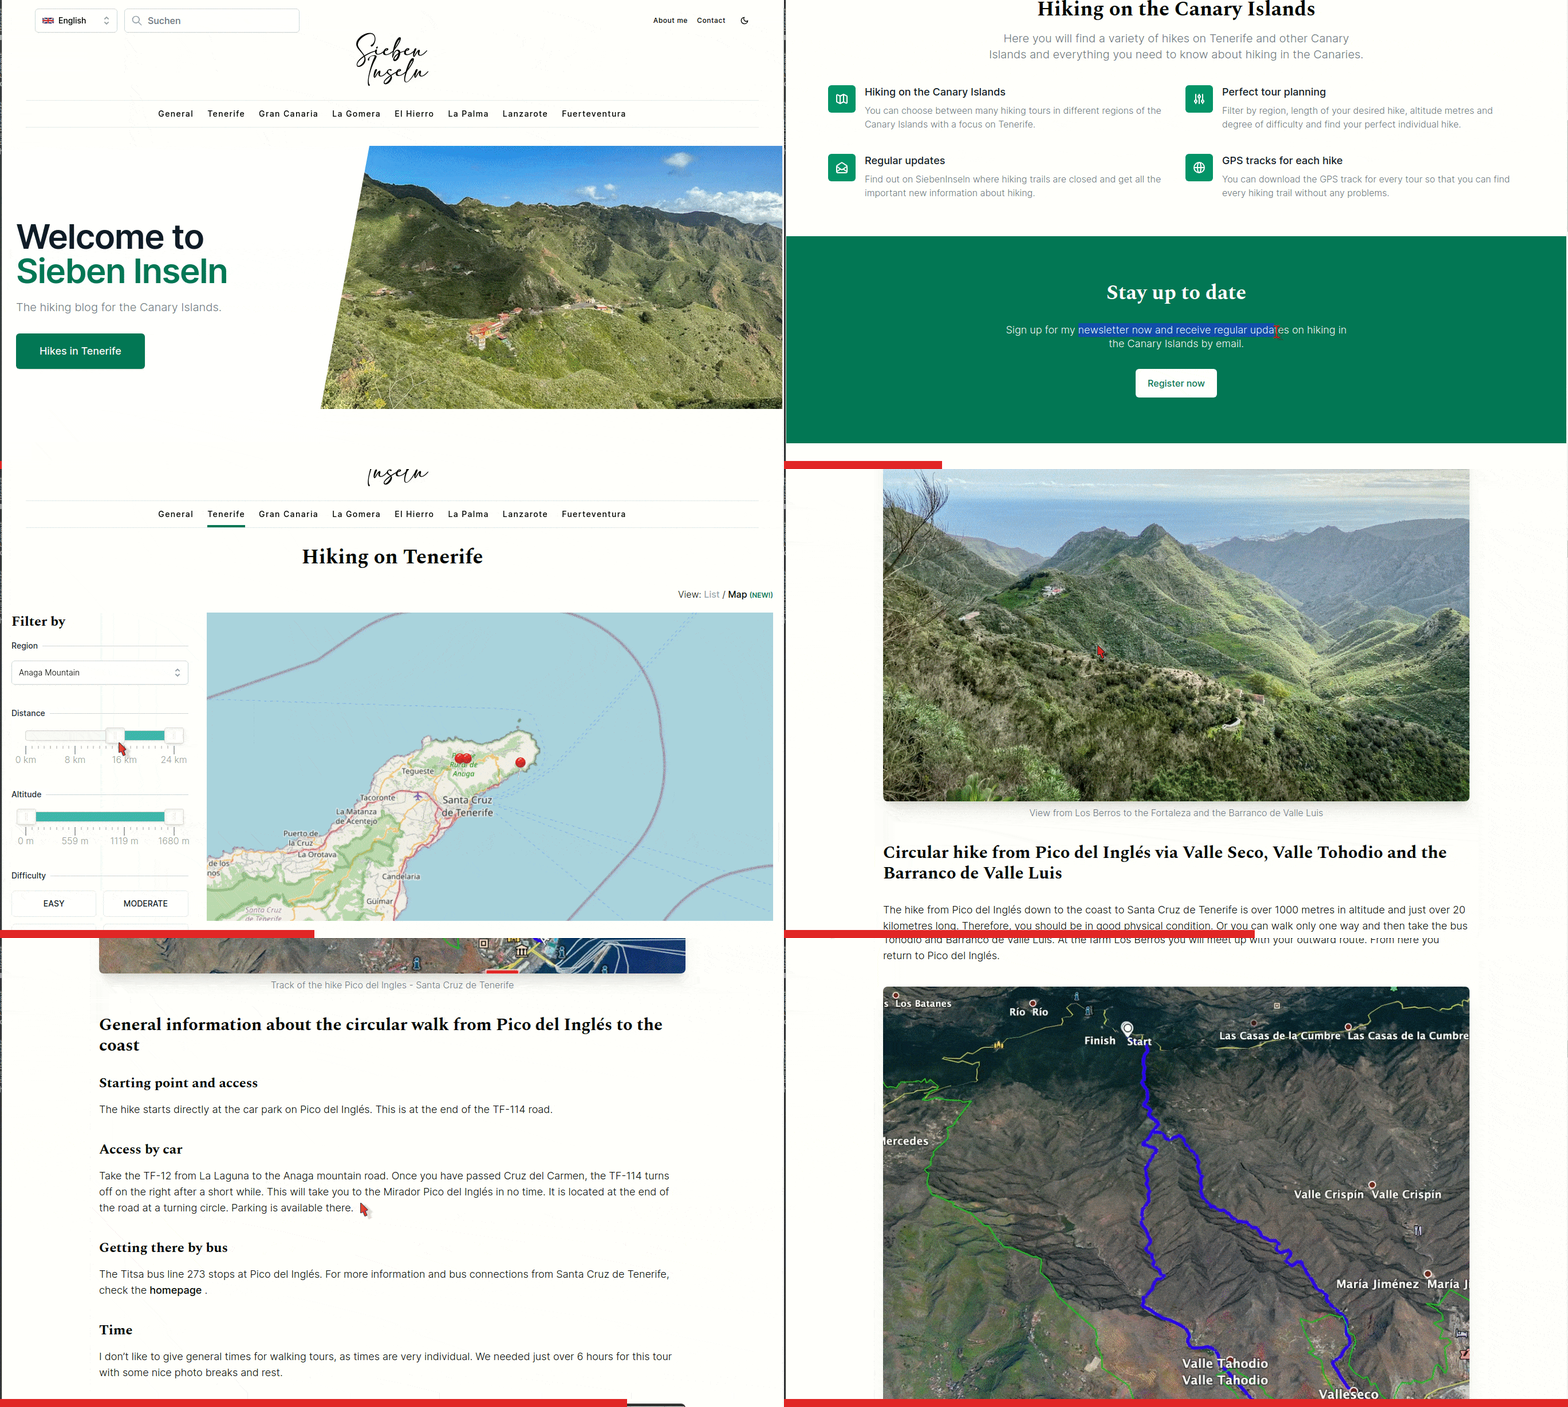
Some enthusiastic local hikers enjoy sharing their best tours and offering insider tips, for instance Sieben Inseln
 |
|---|
| 👍 Kudos to Dagmar from Sieben Inseln who documents for free many hikes in her region. |
Click to expand
Are you interested in walking, running, or riding a route of a past event, such as a race?"
In some cases the .gpx of the route can easily be retrieved ...
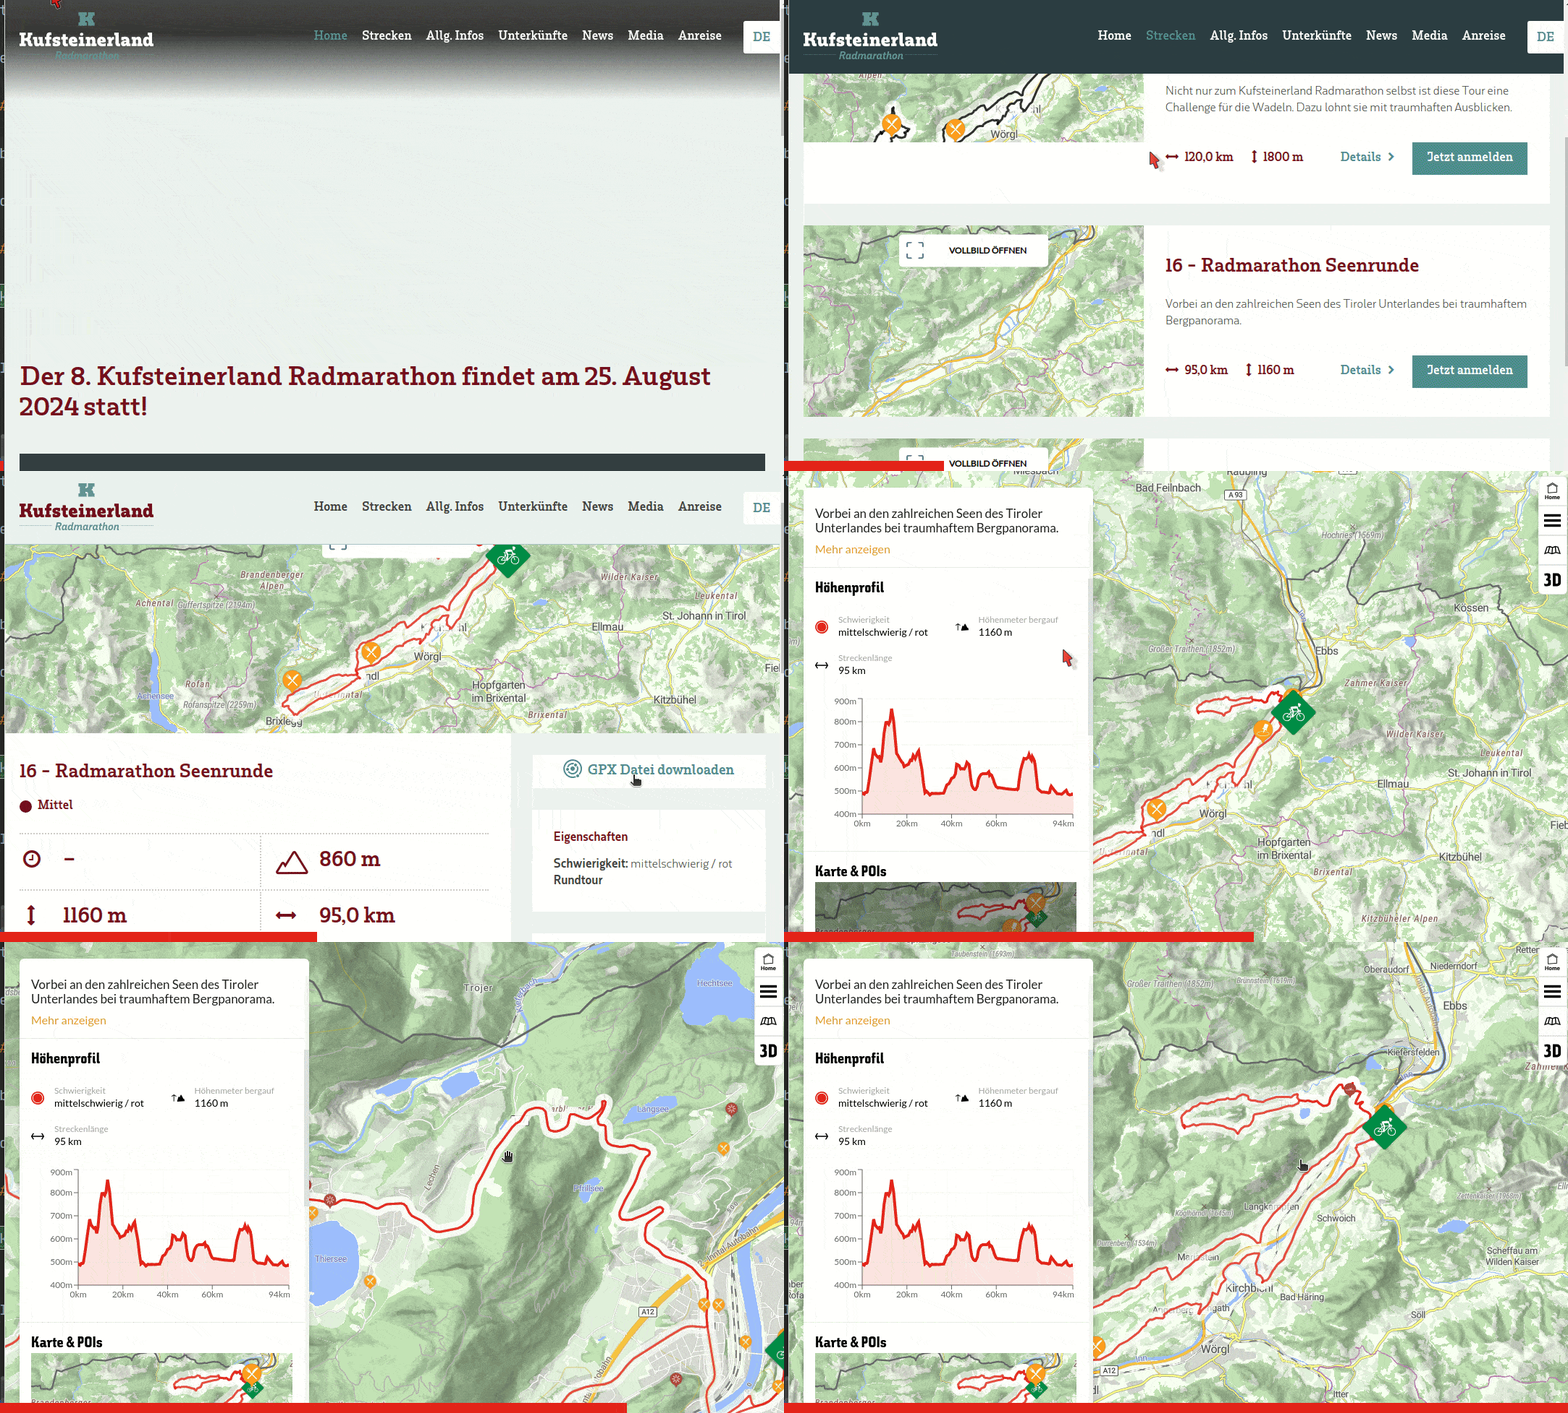 |
|---|
Some events let you check the details of the course, with a nice map, and sometimes even offer the .gpx file. |
... but this is not always the case, consider this example:
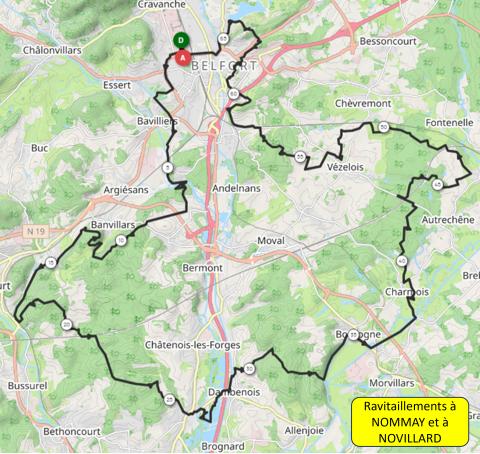 |
|---|
| How to retrieve an accurate route from this image? |
🖍️ One option is to try to manually draw the route, e.g. with komoot, trying to match the line on the image with paths known by komoot / strava heatmap.
- Issue: apart from being tedious, this approach may not be possible given the low resolution of the image.
👀 Another option is to look for the strava account of a participant who recorded this activity and made it publicly available?
- But what if you do not know anyone who took part to the event?
🔍 A third option would be to look for strava activities having the name of the event (e.g. "transterritoire 2023").
- But
stravadoes not offer such"find an activity by name"feature.
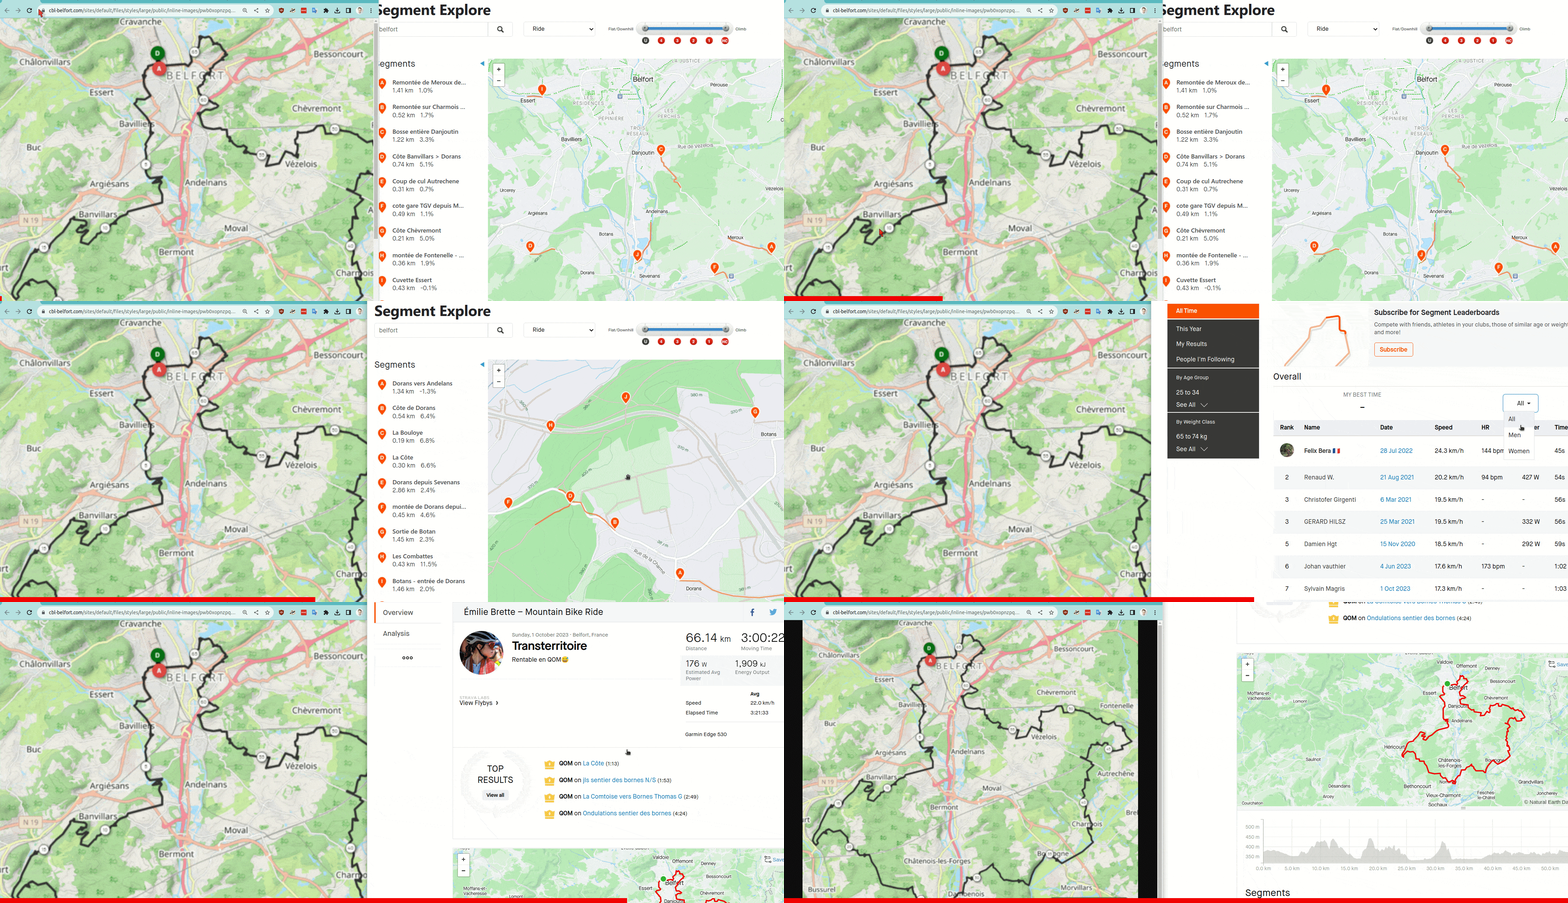
🧑🍳 Here is my (a bit advanced) recipe:
- 1- Find a
stravasegment on the course (see Tips below). - 2- Check the leaderboard of this
stravasegment, which listsstravamembers' performances on this segment. - 3- Find one performance on the date of the event. 📆
- 4- Access to the corresponding
stravaactivity. 🎉
💡 Tips:
- The
strava-segment-exploreris a nice map that can be find atstrava.com->discover->discover segments. stravasegments can be searched bynameorkeyword, e.g. the name of the event, using thestrava-segment-searchstravasegments can also be searched using the excellentSegmentExplorerbydoogal.co.uk/.
Two issues may occur when trying to find segments on the route:
- The segment is not laying on the route.
- Solution: try other segments.
- The segment is on the route, but no performance is listed in the top-10 leaderboard, with the date of the event.
- Solution-0: with
strava premium, one can see all performances in the leaderboard, not just the top-10. - Solution-1: with
strava premium, filters can be applied, for instance a "date" filter. - Solution-2: usually, the
"women: all-time"classification is less busy than the"men: all-time", therefore it is more likely to contain activities the date of the event.
- Solution-0: with
🎁 Bonus: how to export a .gpx from a strava activity?
It is time to connect the waypoints you have identified and/or adjust the route you have found.
The goals of this section are to:
- ✍️ Draft a route using your result(s) of the previous section.
- ✅ Make sure the length and elevation of the drafted route are ok for you.
- If not, adjust the drafted route.
Click to expand
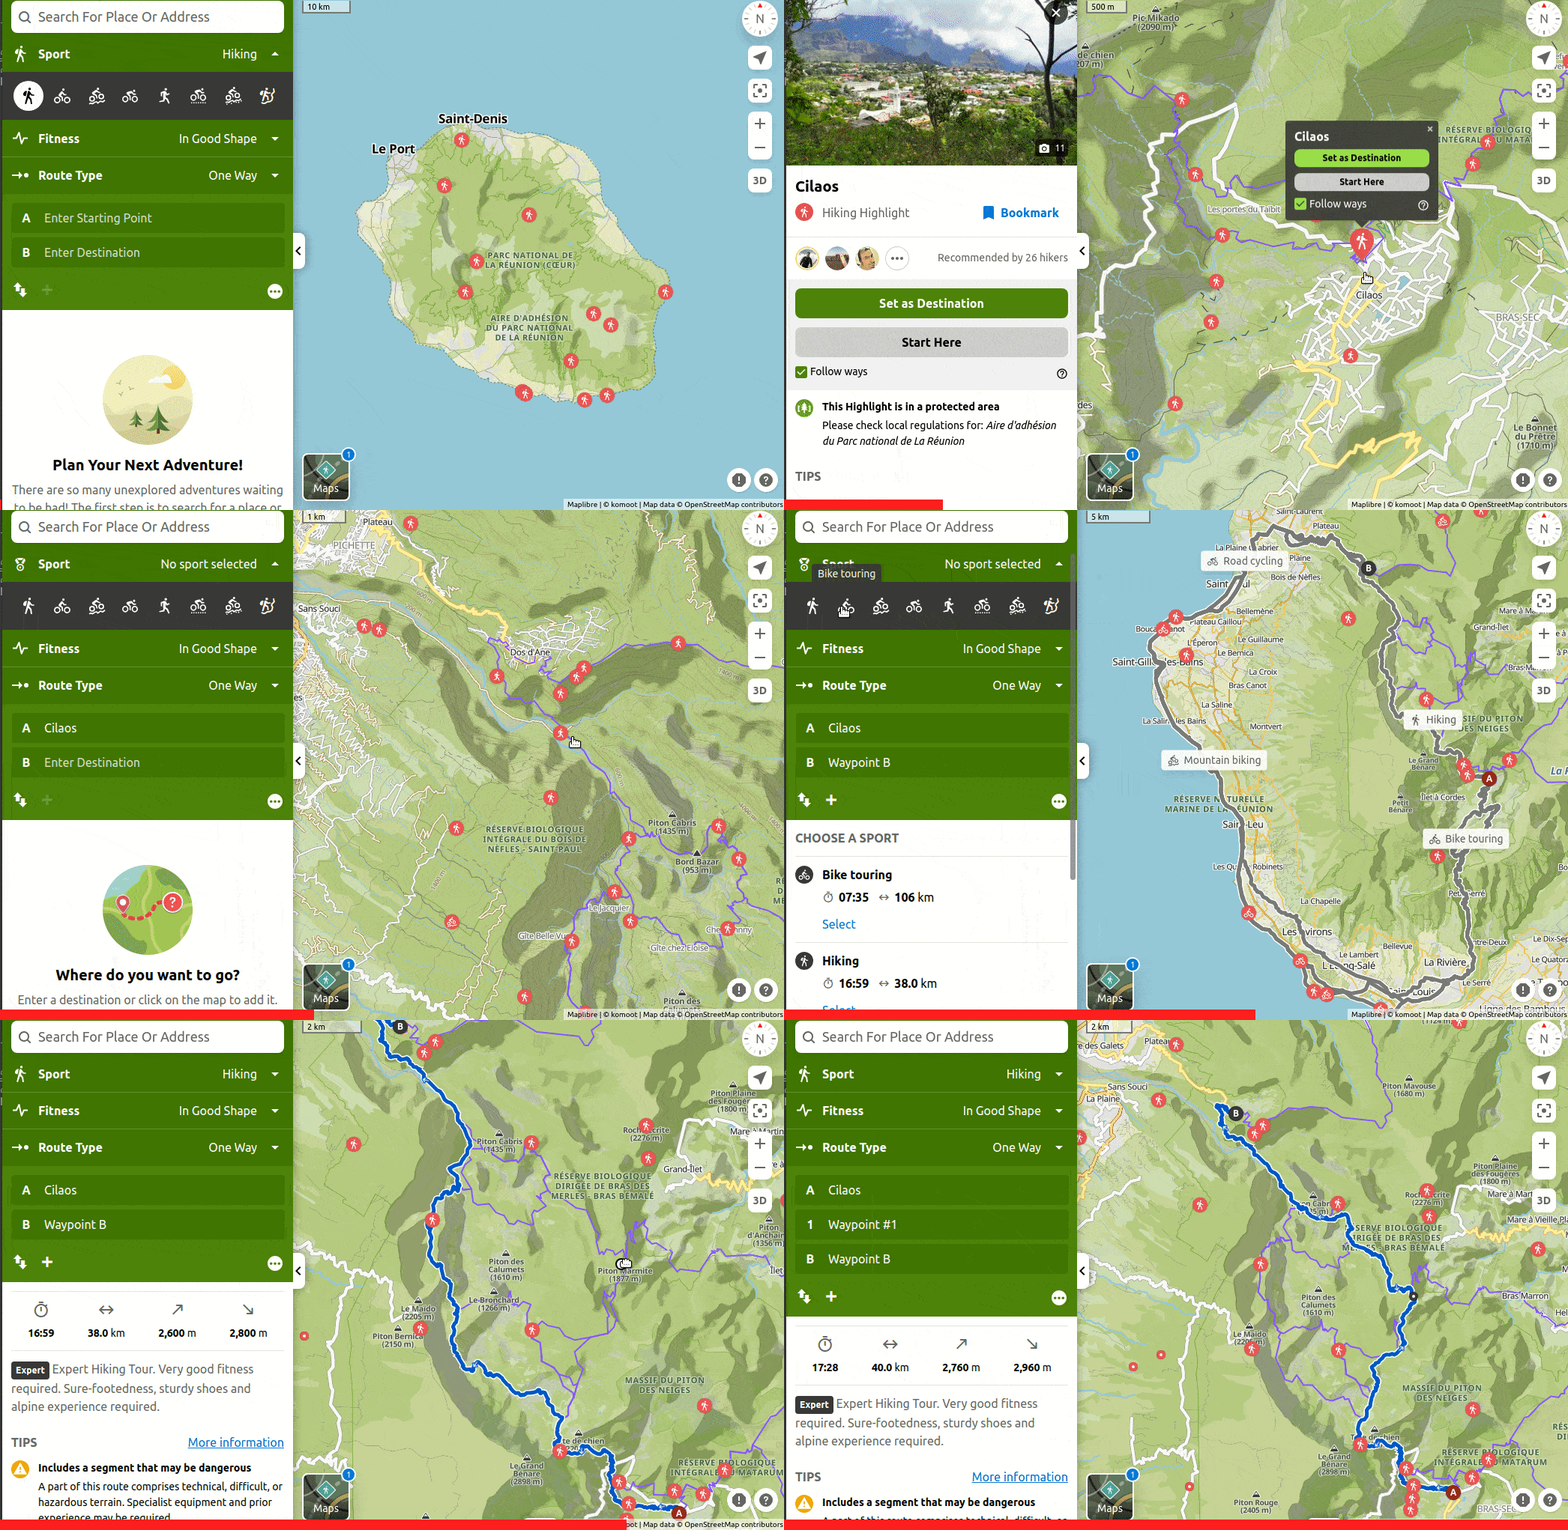 |
|---|
Drafting a route with komoot/plan is easy: define a start, a destination, and an activity type. That's it. Further waypoints could be added to the drafted route. Now you can check if the length and elevation of the route are ok for you. In this example, 40 km may be a bit too much for a one-day hike. |
For more details on komoot/plan:
- Check Route Planner Tips and Tricks by
komoot. - Look for "How to plan a route using
komoot?" in a search-engine.
💡 Tips:
- You may have got a
.gpxfile from the previous section:komootlet you easily import such file as akomoot/plan, and edit it.
The goal of this section is to optimize the drafted route, making it as enjoyable as possible:
Below is a list of things to check.
I advise you to:
- 👀 Check and adjust first on a coarse level: consider re-routing if necessary.
- 🔬 Only then focus on small details. 🔍
After completing this section, your route will be ready!
Click to expand
First of all, review the warnings generated by komoot.
"Be it a rough road, private land or a particularly steep stretch of trail,
komoot’s tips deliver helpful information about your route’s characteristics, so you can better prepare yourself for your adventure." (source)
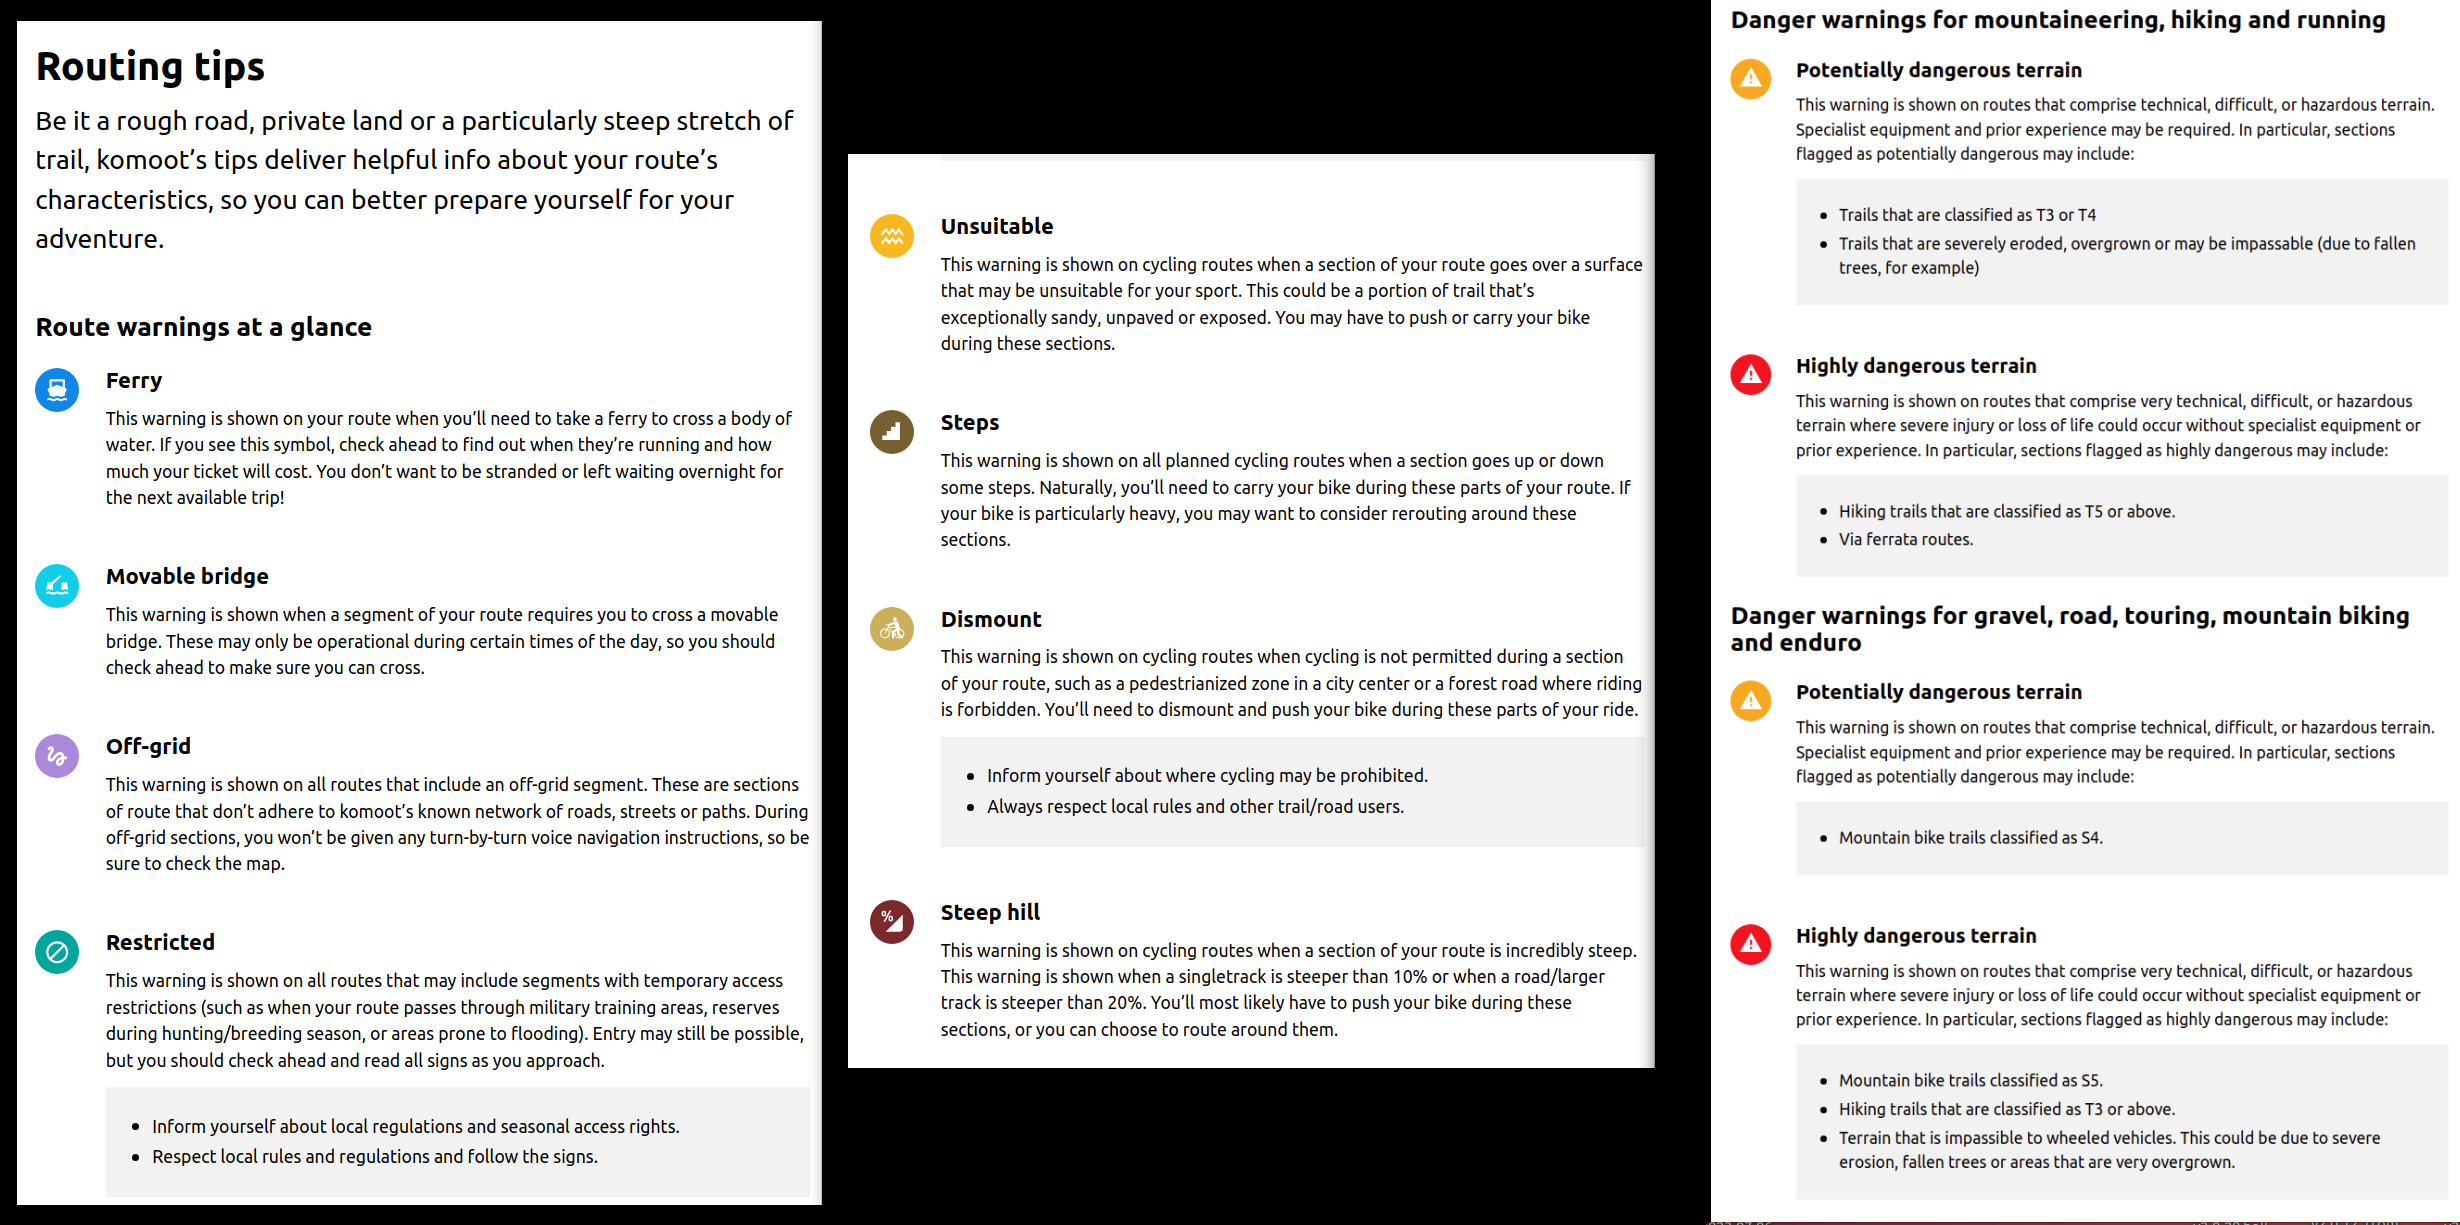 |
|---|
Learn more about the Routing tips in this page. |
Click to expand
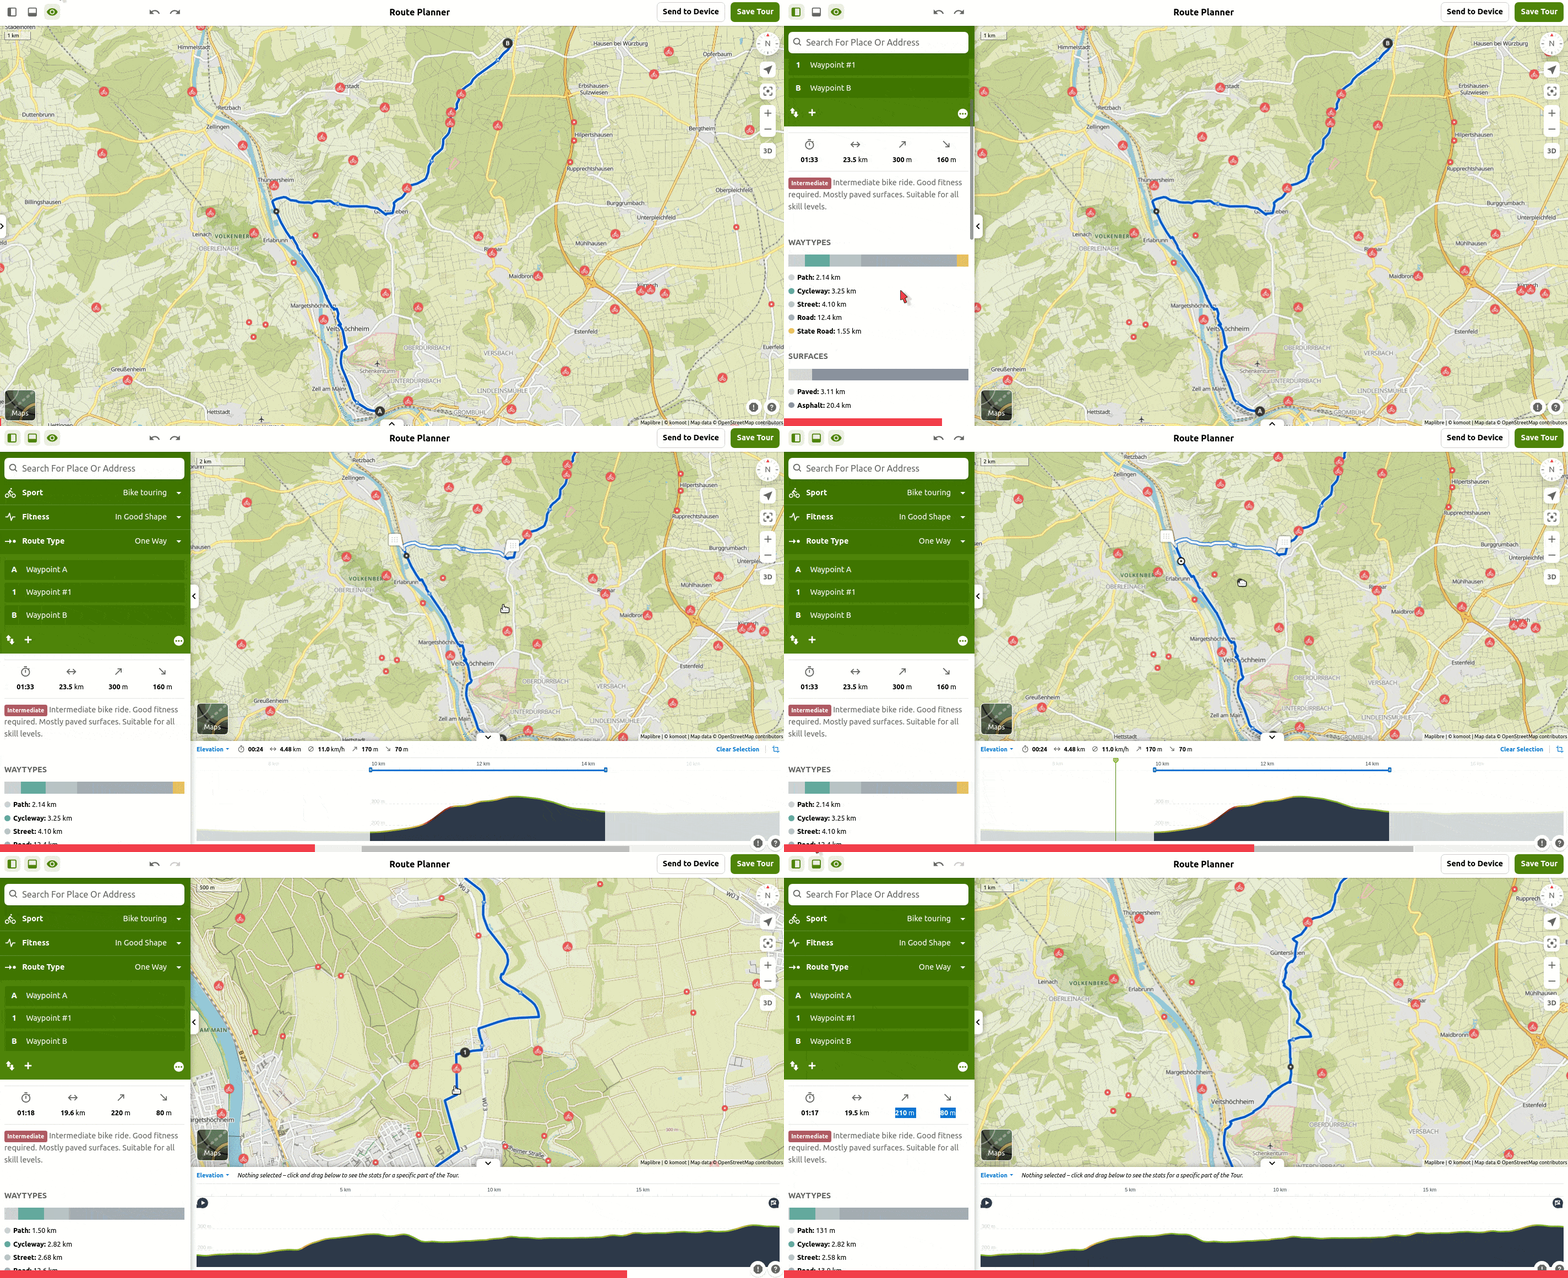
Check the elevation profile and, if necessary, consider re-routing parts of the tour.
 |
|---|
Visualize the elevation profile, identify steep climbs, consider alternatives using strava-global-heatmap, and confirm that the new tour characteristics (waytypes and surfaces) are suitable. |
Click to expand
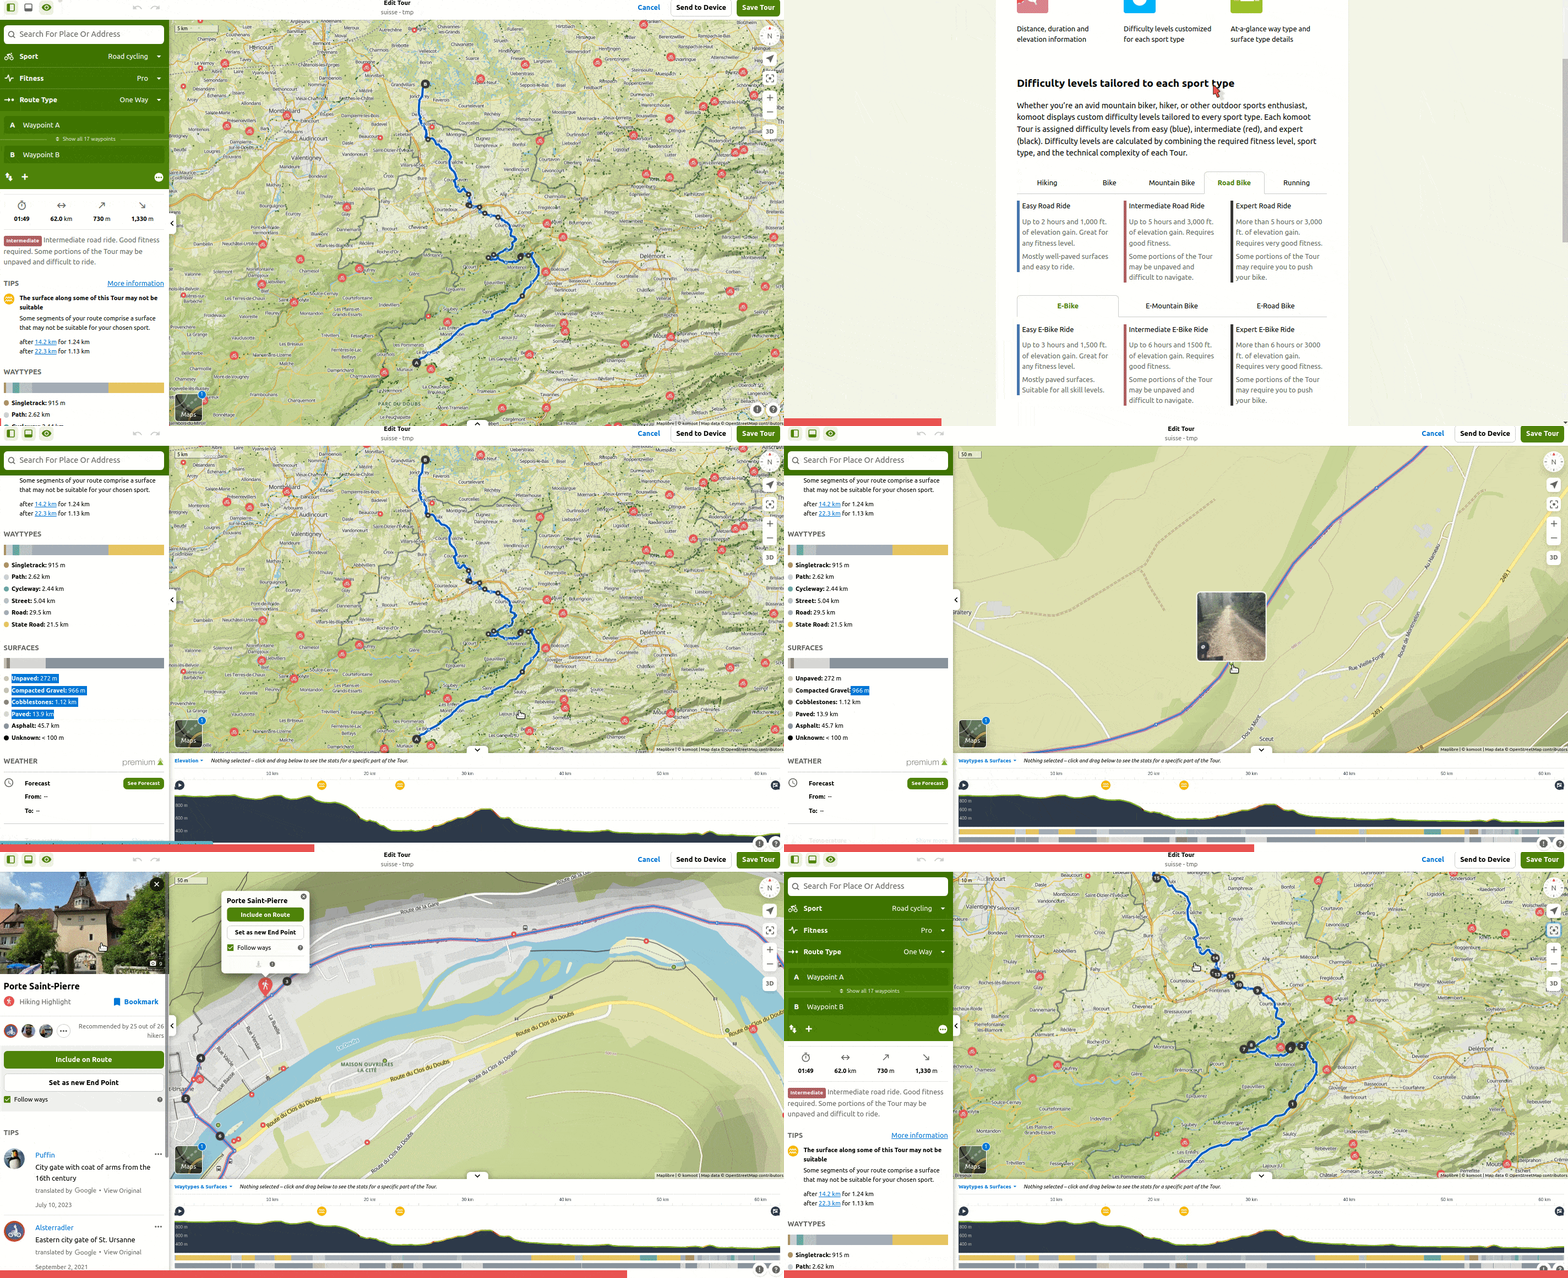
Verify the way type and surface type and, if needed, re-route specific parts of the tour.
Way typesdescribe the nature of the route (path,cycleway,street,highway,trail,singletrackorroad) (source).
Surface typesdescribe the actual condition: whether it’ssand,asphalt,cobblestones, orgravel(source).
 |
|---|
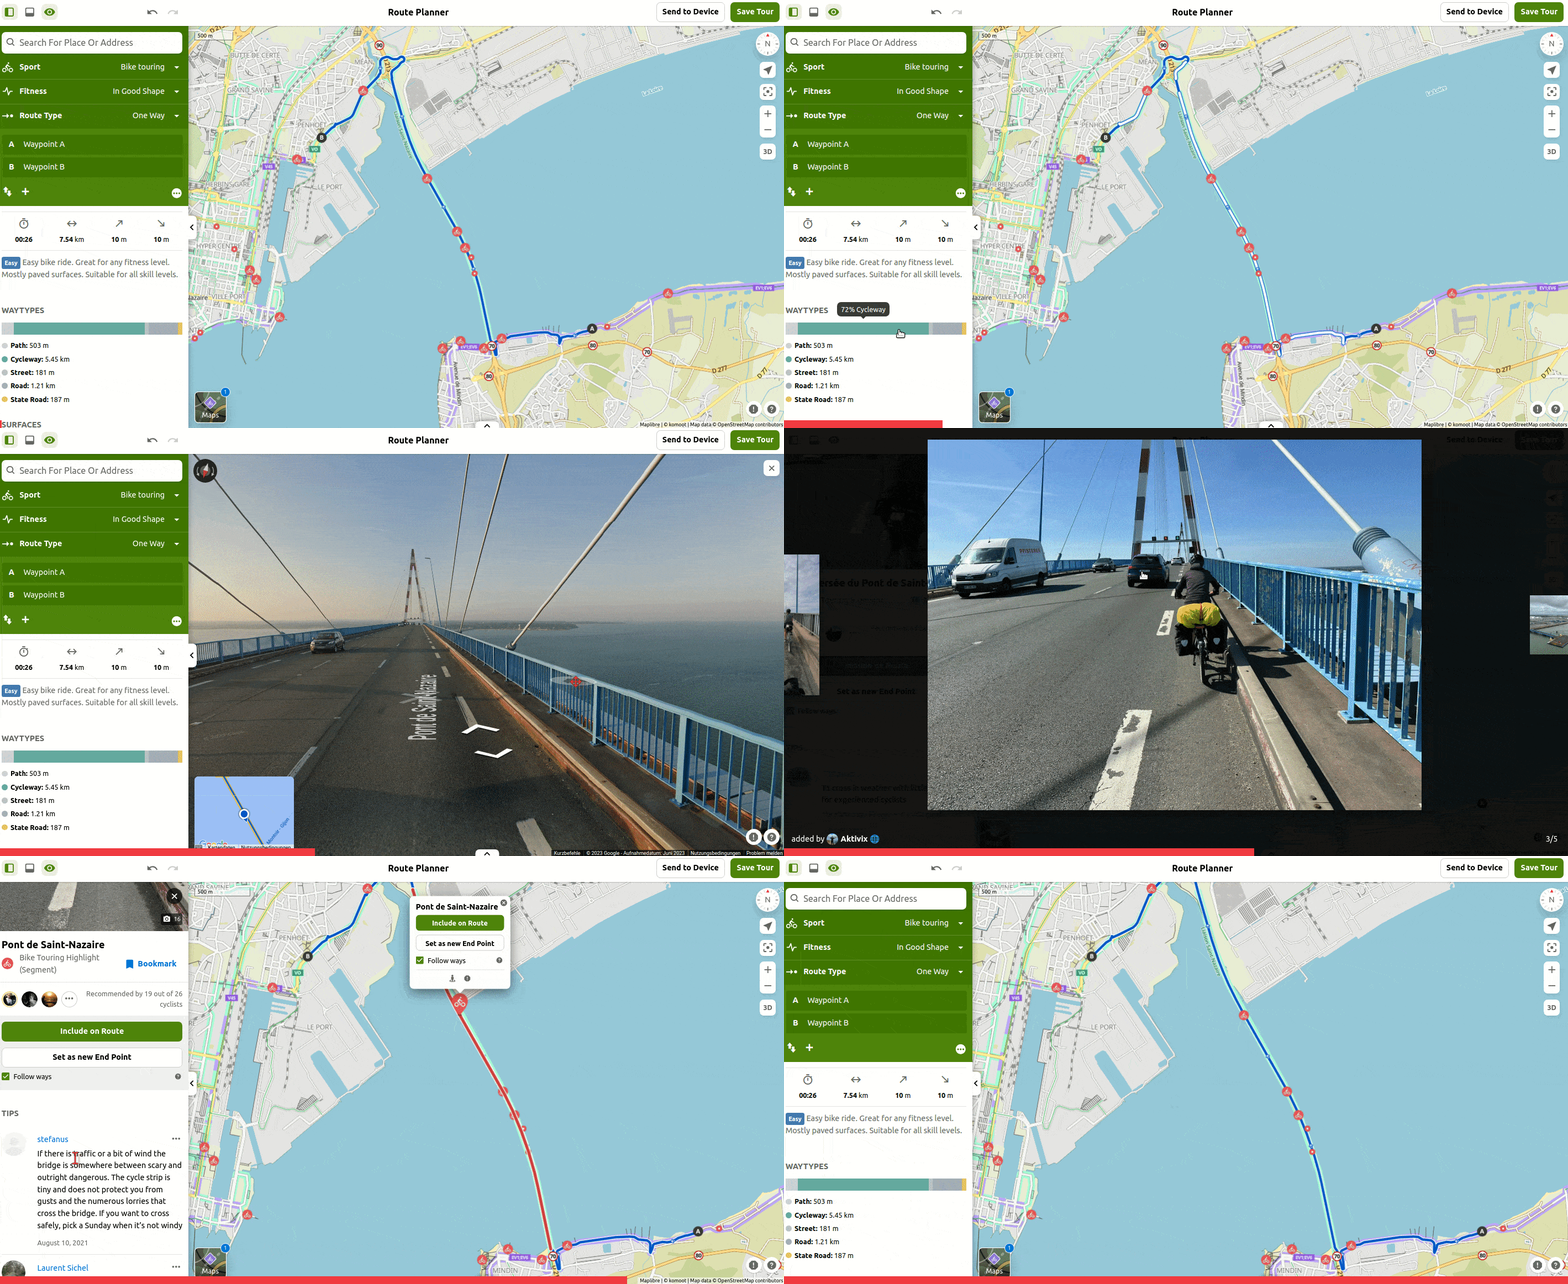
Checking the surface for a road-cycling tour: clicking on the surfaces types (see bar on the left) that may be problematic for road bikes (Unpaved: 272 m, Compacted Gravel: 966 m, Cobblestones: 1.12 km) make the map jump to the corresponding sections. Then, using images showing the path (highlights [red points on the map 🔴] and komoot-trail-view [green dots on the map 🟢]), one can decide if it is ok to ride with a road-bike. Alternatives can be considered at the same time: in this example, the Compacted Gravel section is not ideal, but it is short and calm while the alternative (orange road) would add some steep climbs. The cobblestones section is also accepted, based on pictures, and will let the rider visit the old city. |
💡 Tips:
- ⚖️ Consider trade-offs: road-cycling tours prefer
asphaltandpavedsurfaces, but small roads with less traffic can also be appealing.- On the one hand,
state roadsmay offer ideal surfaces, but can be busy and potentially dangerous. However, safe cycleways may present on its side. - On the other hand, a small street with
compact gravelsurface may not be ideal for road-bike tires, but it can offer a scenic ride.
- On the one hand,
- 🖱️ To inspect each segment of the route with a given
surface type, repeat clicking on the givensurface type: each click makes the map jump to the respective segment. - 📈 As demonstrated in the animation above, display the
Waytypes & Surfacestogether with the elevation profile (bottom of the map) for an overview along the route.
Click to expand
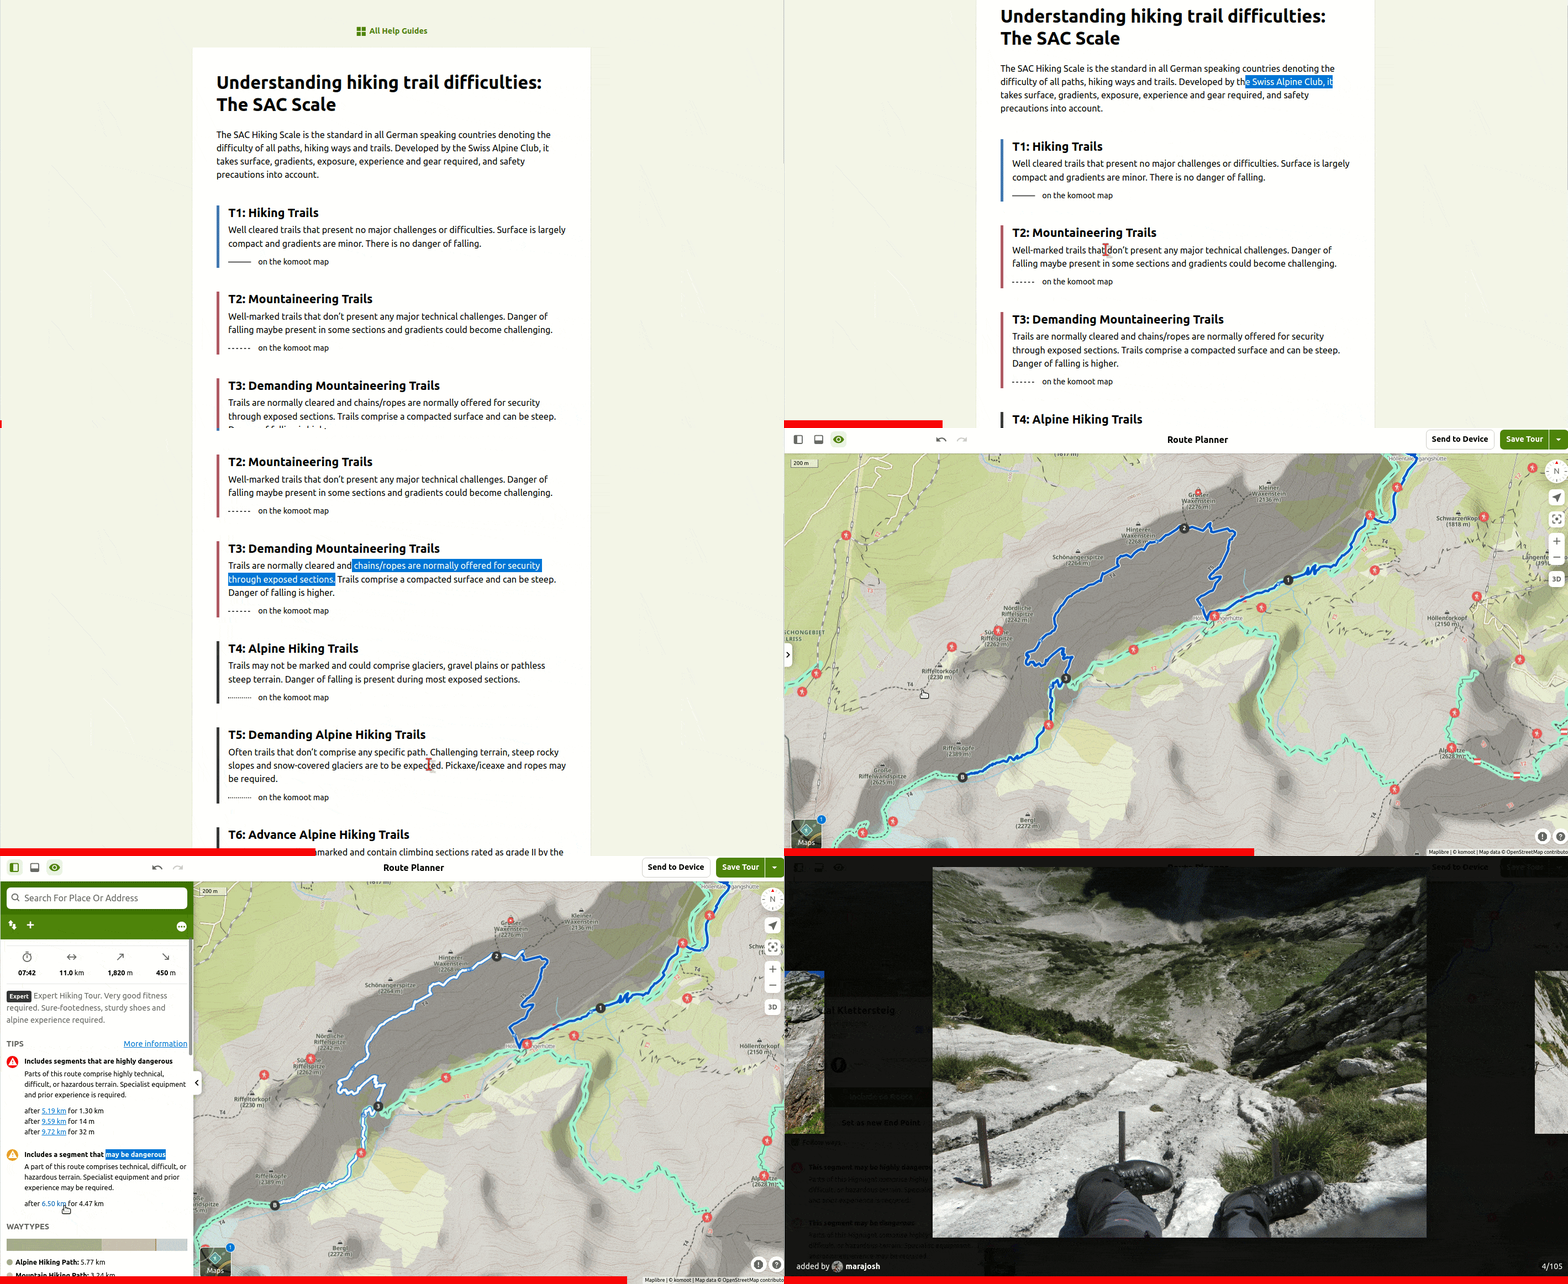
Evaluate the technical difficulty of trails possibly present in your route.
Komoot sometimes provides a "difficulty level" for hiking and MTB paths using different scales:
 |
|---|
Checking the technical difficulty of the route with the SAC Hiking scale, komoot warnings and pictures. |
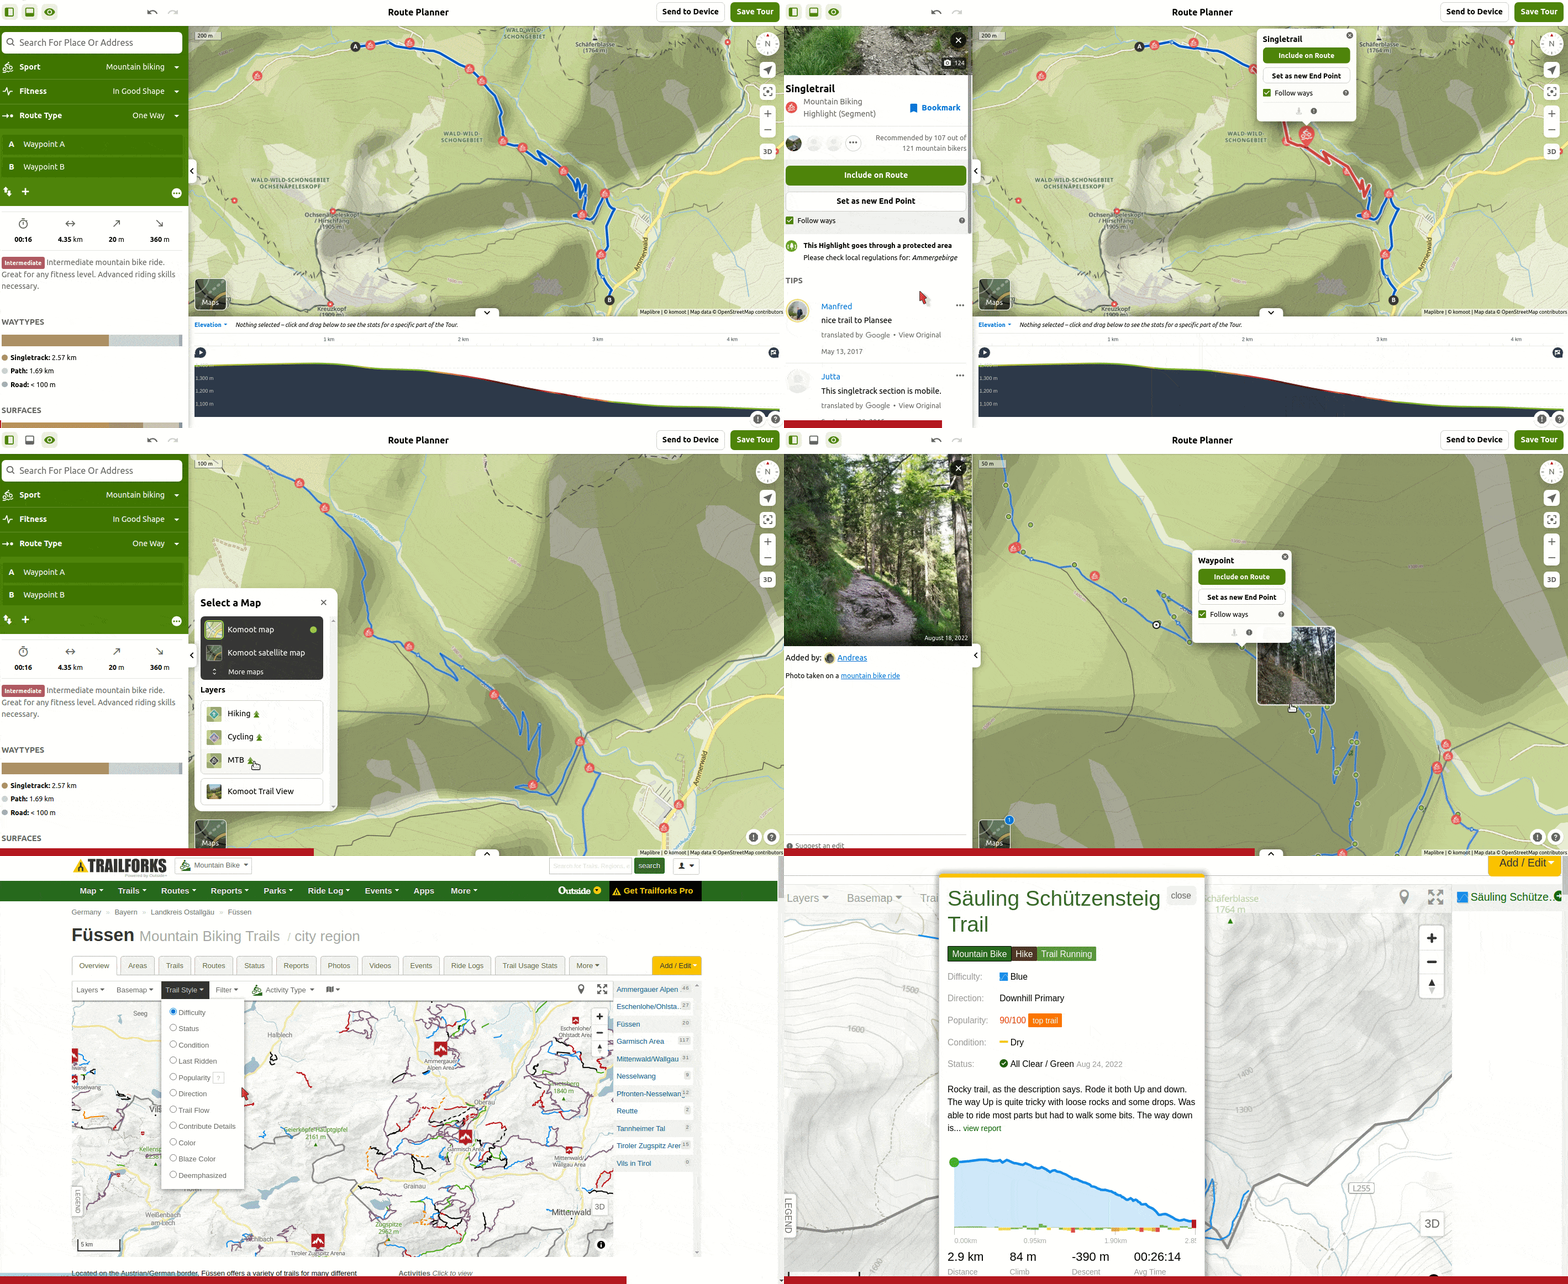
The komoot-trail-view is a feature to see pictures of the actual site, taken by other users.
 |
|---|
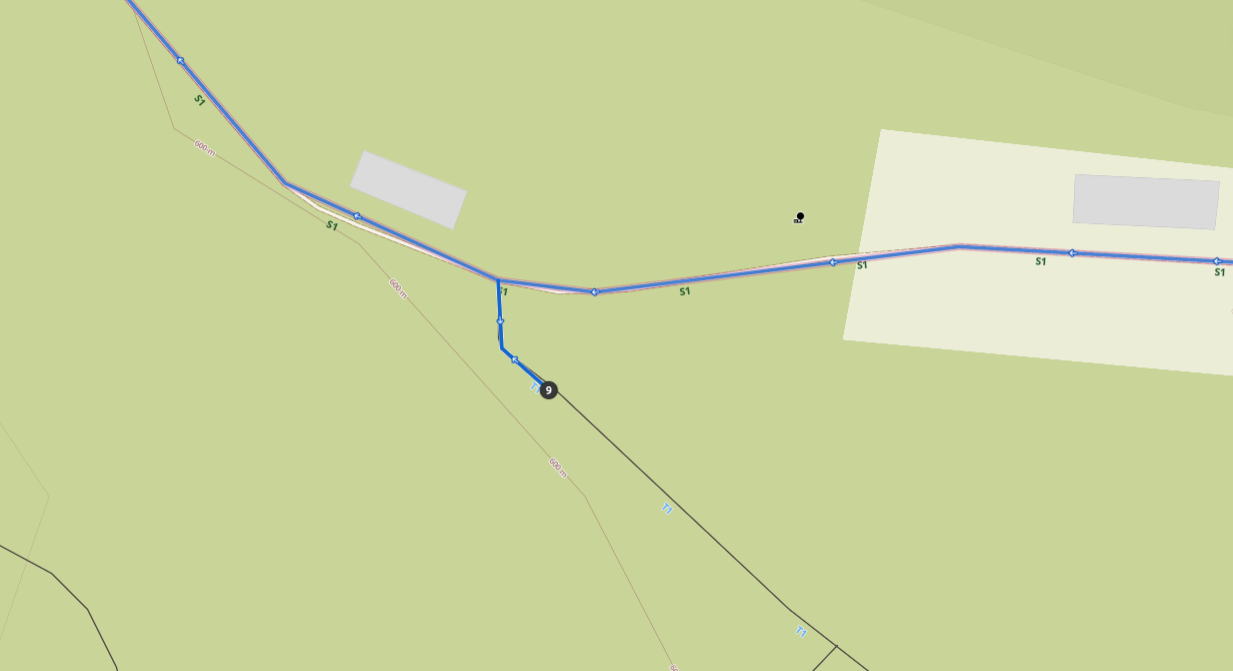
Checking the technical difficulty of a mountain-bike downhill: the MTB single track scale is displayed (S2) - but this information seems to be restricted to komoot premium users. komoot provides additional helpful information: the way-type (singletrack), its surface (natural) and its slope (up to ~20%). The komoot-trail-view (green dot 🟢) is really valuable in this downhill. |
💡 Tip:
- The levels (
S0,S1... for MTB andT0,T1... for run/hike) may only be available with akomootpremium subscription.- However, other websites can reference the difficulties of popular trails.
- For instance the website
trailforks, despite using a different scale system.
- The
difficulty level, as well as thewaytypes & surfacescan help decide the direction of the route (clockwiseorcounterclockwise). 🔄- I personally prefer to hike up on technical trails, and walking down on easier and broader paths.
- But this is the opposite for mountain-bike.
Click to expand
Undecided between two path options?
- The
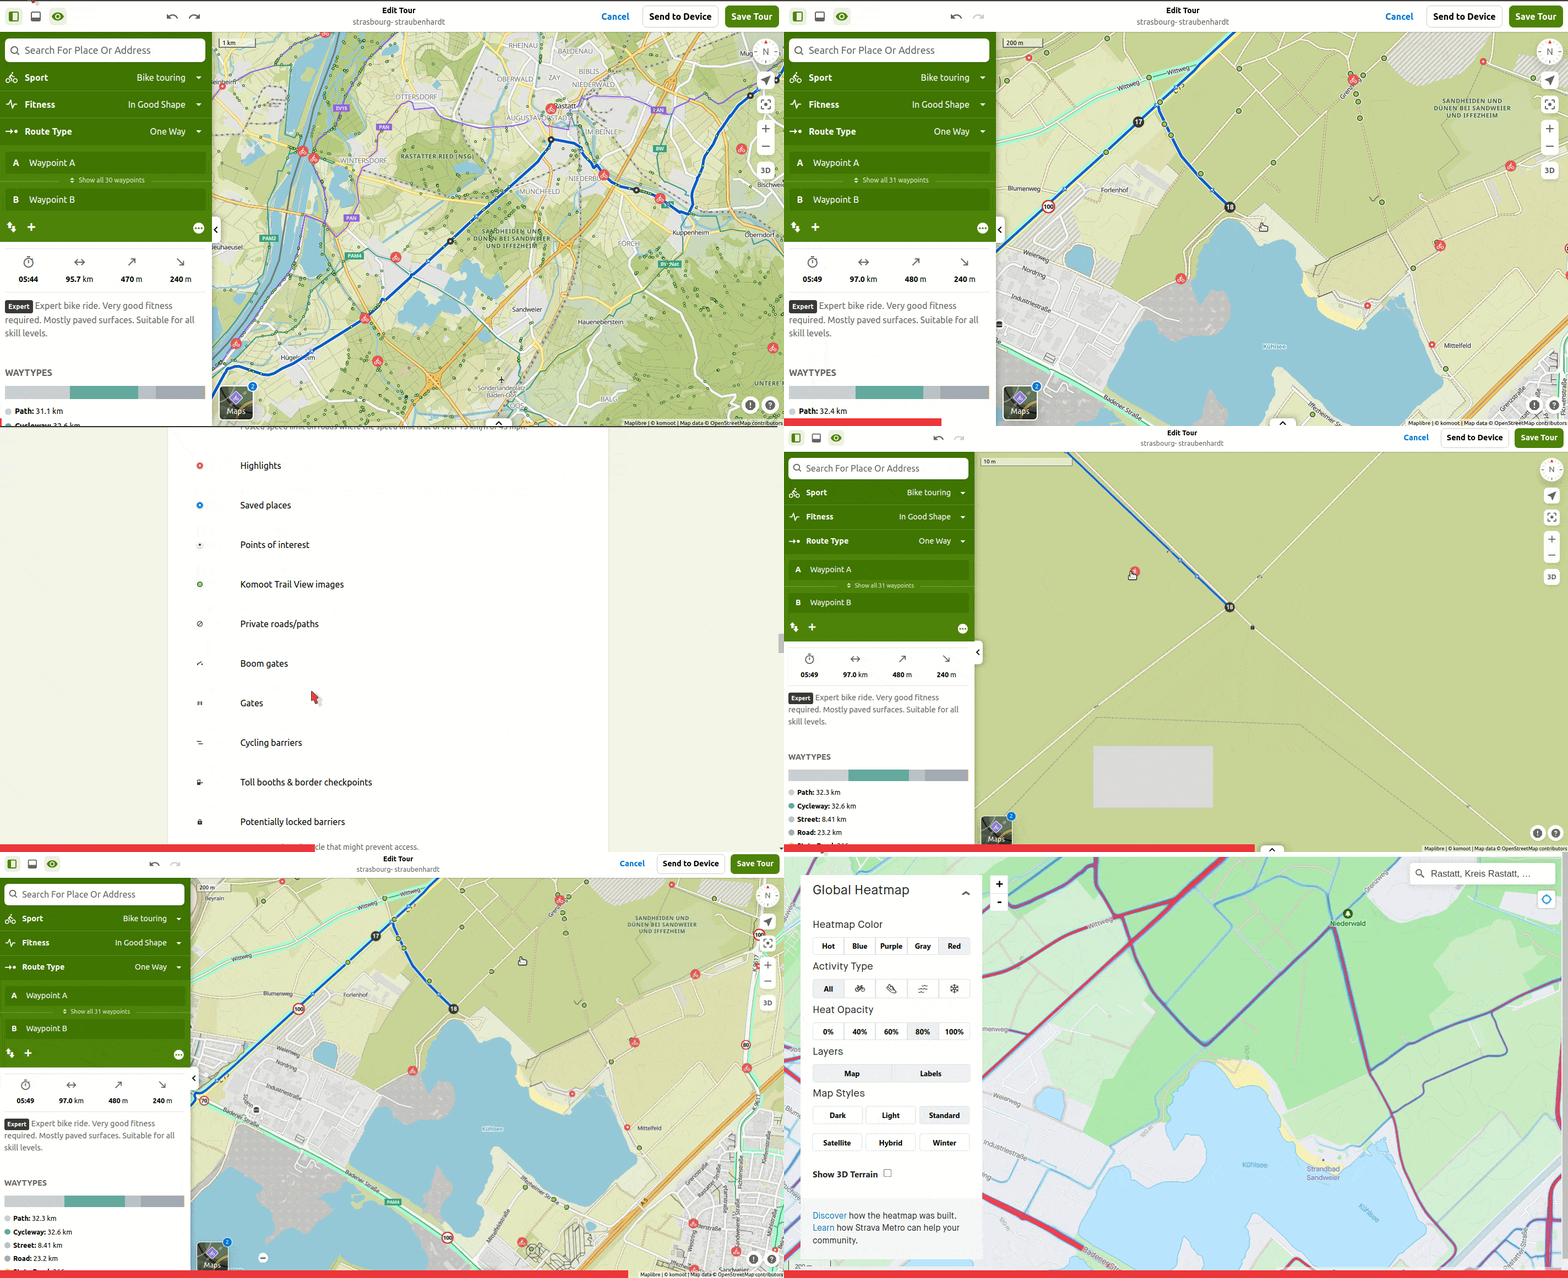
strava-global-heatmapis a VERY convenient tool to check which option is more frequently used, and therefore potentially more reliable.
However, it may be difficult for the eyes to match corresponding locations on the two maps:
- 1- The
komootmap used to draw your route. - 2- The
strava-global-heatmap.
My suggestion is to:
- 1- Open the two maps in two neighbouring tabs in your internet browser.
- 2- Zoom the
komootmap on a portion to be inspected. - 3- "Align" the
strava-global-heatmapwith thekomootmap:- Iteratively adjust the zoom and the position of the
strava-global-heatmap, until both maps show same elements on same places of your screen when switching between the two tabs.
- Iteratively adjust the zoom and the position of the
- 4- Switch between the two tabs (
ctrl+tabandctrl+shift+tab) to get an overlaid view and therefore be able to understand which options are the more frequented.
It would be very convenient to automate this manual alignment method, as listed in the still missing section.
Click to expand
It may not be enjoyable to walk or ride on a highly frequented road, especially for road cycling.
While komoot already indicates the type of road (cycleway, street, state road ...), it is worth verifying the actual traffic.
Click to expand
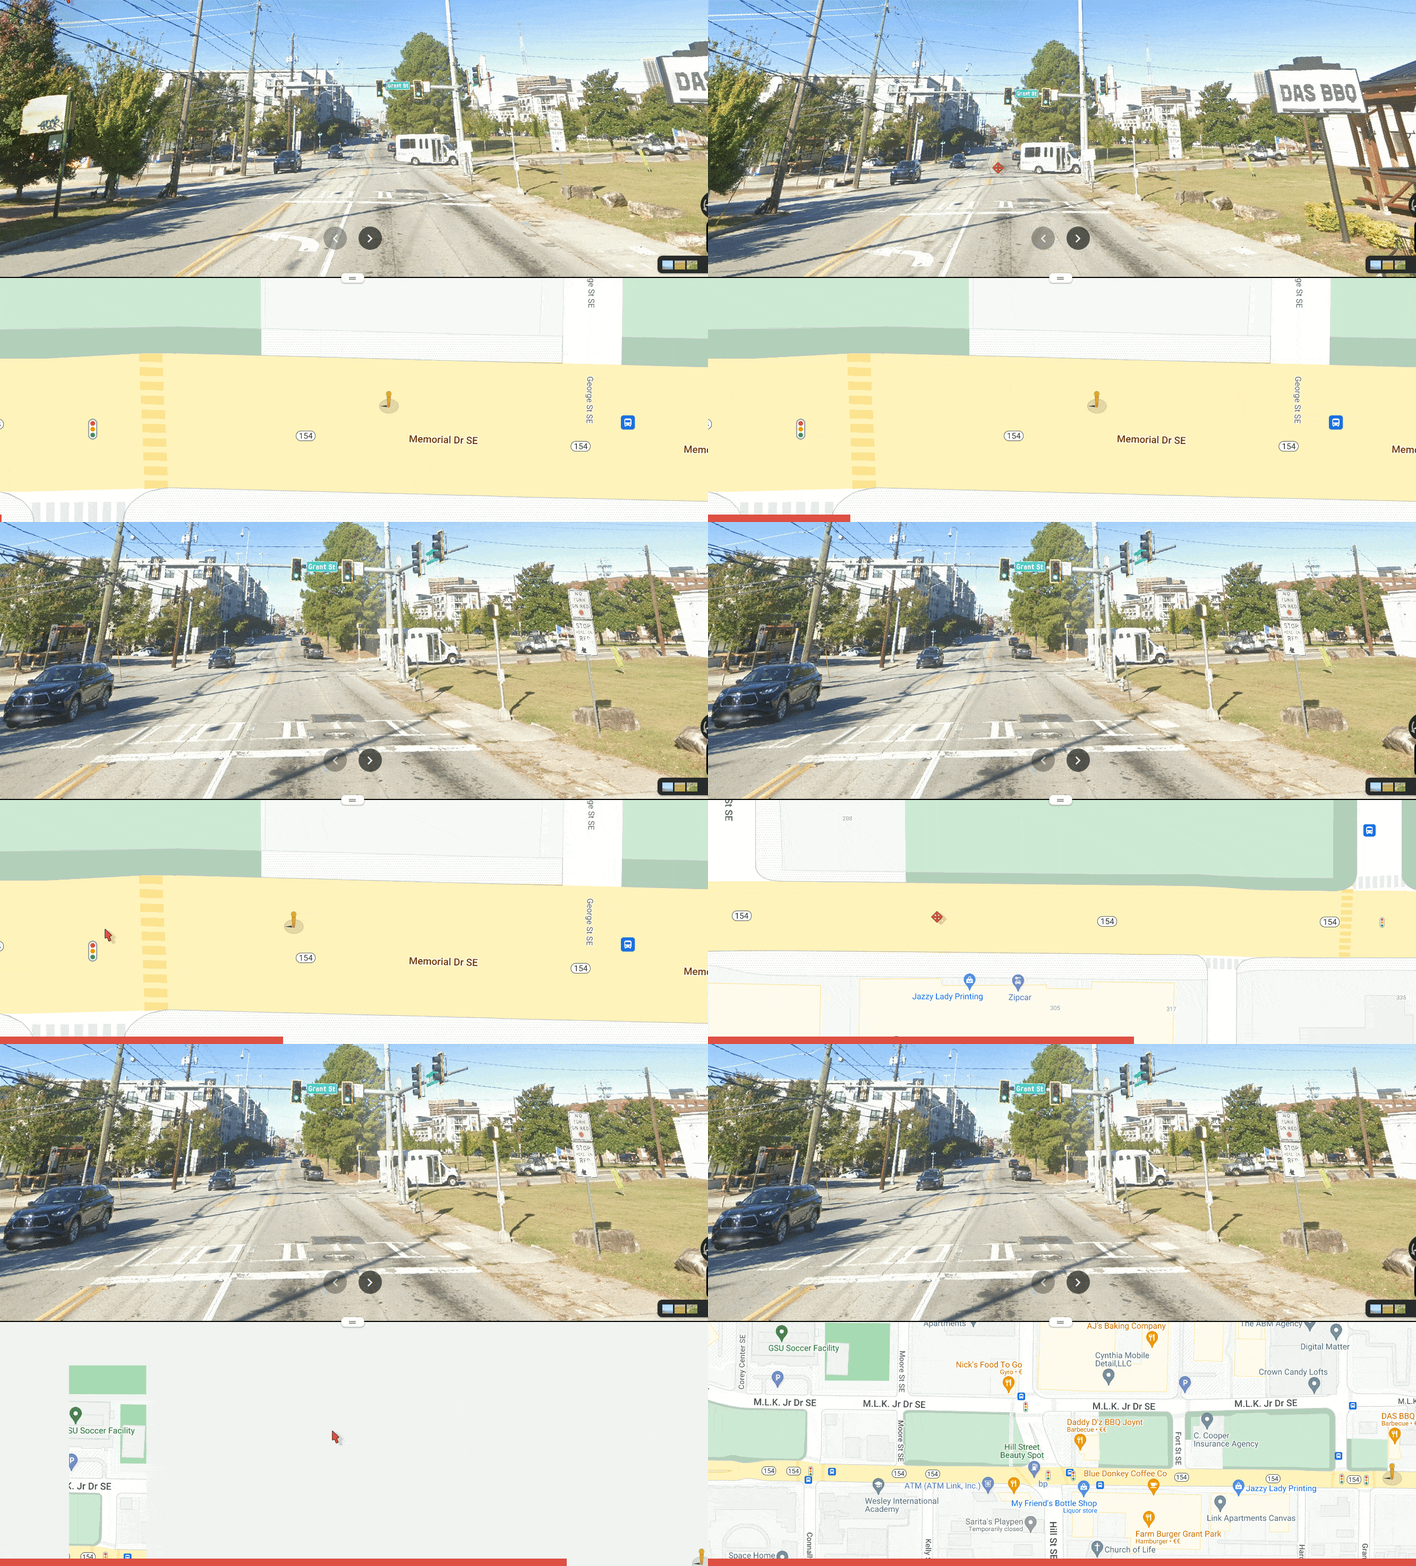
Cycling in a city can become a nightmare if encountering plenty of traffic lights:
- Brake hard
- Change gears - if possible
- Unclip
- Wait
- Clip - or try to! 😜
- Accelerate
- ... and repeat!
Roads with fewer traffic lights can be preferable, even if they are longer.
 |
|---|
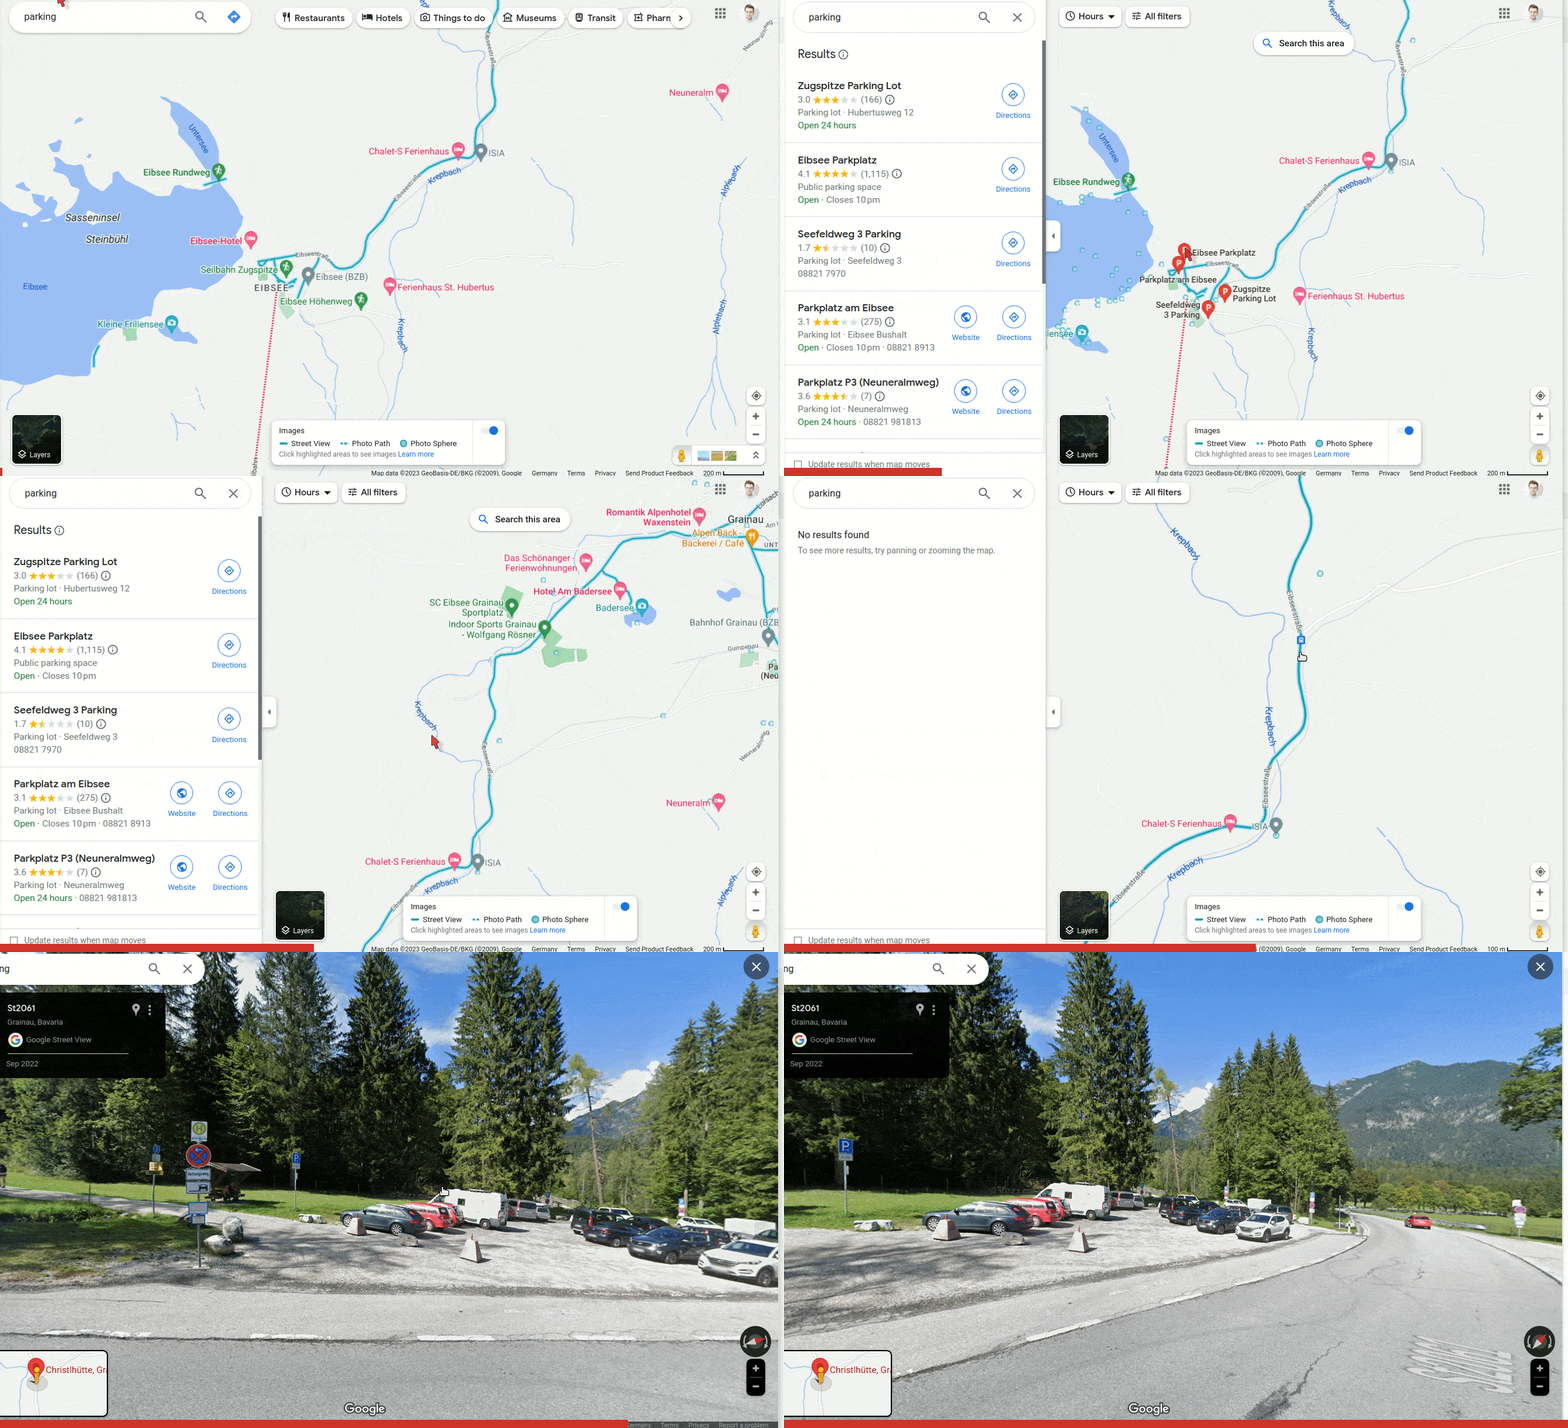
This example shows a simultaneous use of google street view (upper part) and google maps (bottom part) to verify the presence of traffic lights in a street. |
- Not all traffic lights are referenced in
google maps.
This method to select roads with few traffic lights needs to be improved: see the still missing section.
Click to expand
Remove any irregularity in the route that may perturb the navigation.
💡 Tips:
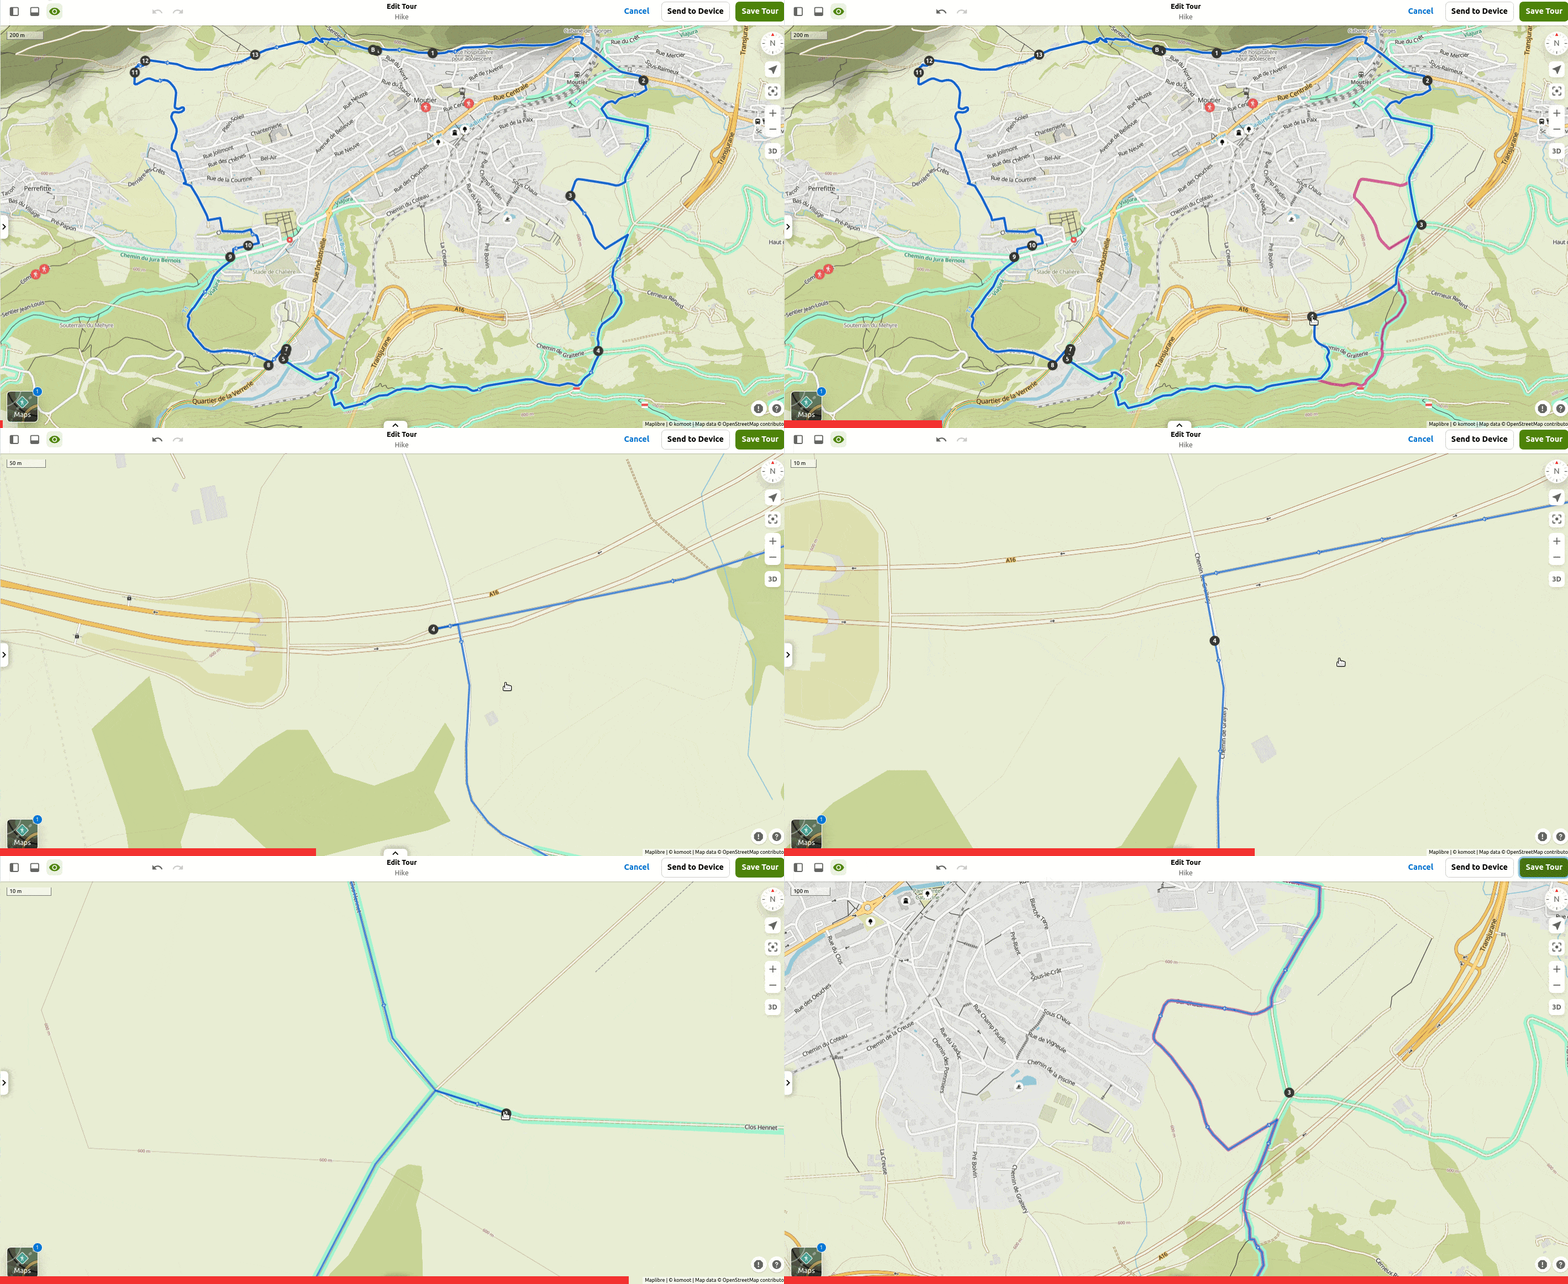
- When you are satisfied with your plan, zoom in and check the position of each waypoint.
- Avoid placing a waypoint directly on an intersection.
- Try to position the waypoint on the desired path, just before or after the intersection.
- Remove unnecessary waypoints.
When downloading a piece of software or opening an attached file in an email, do you not make sure these are
legalandsafe?
It needs to be checked that the route you have just created is safe, feasible and legal.
Click to expand
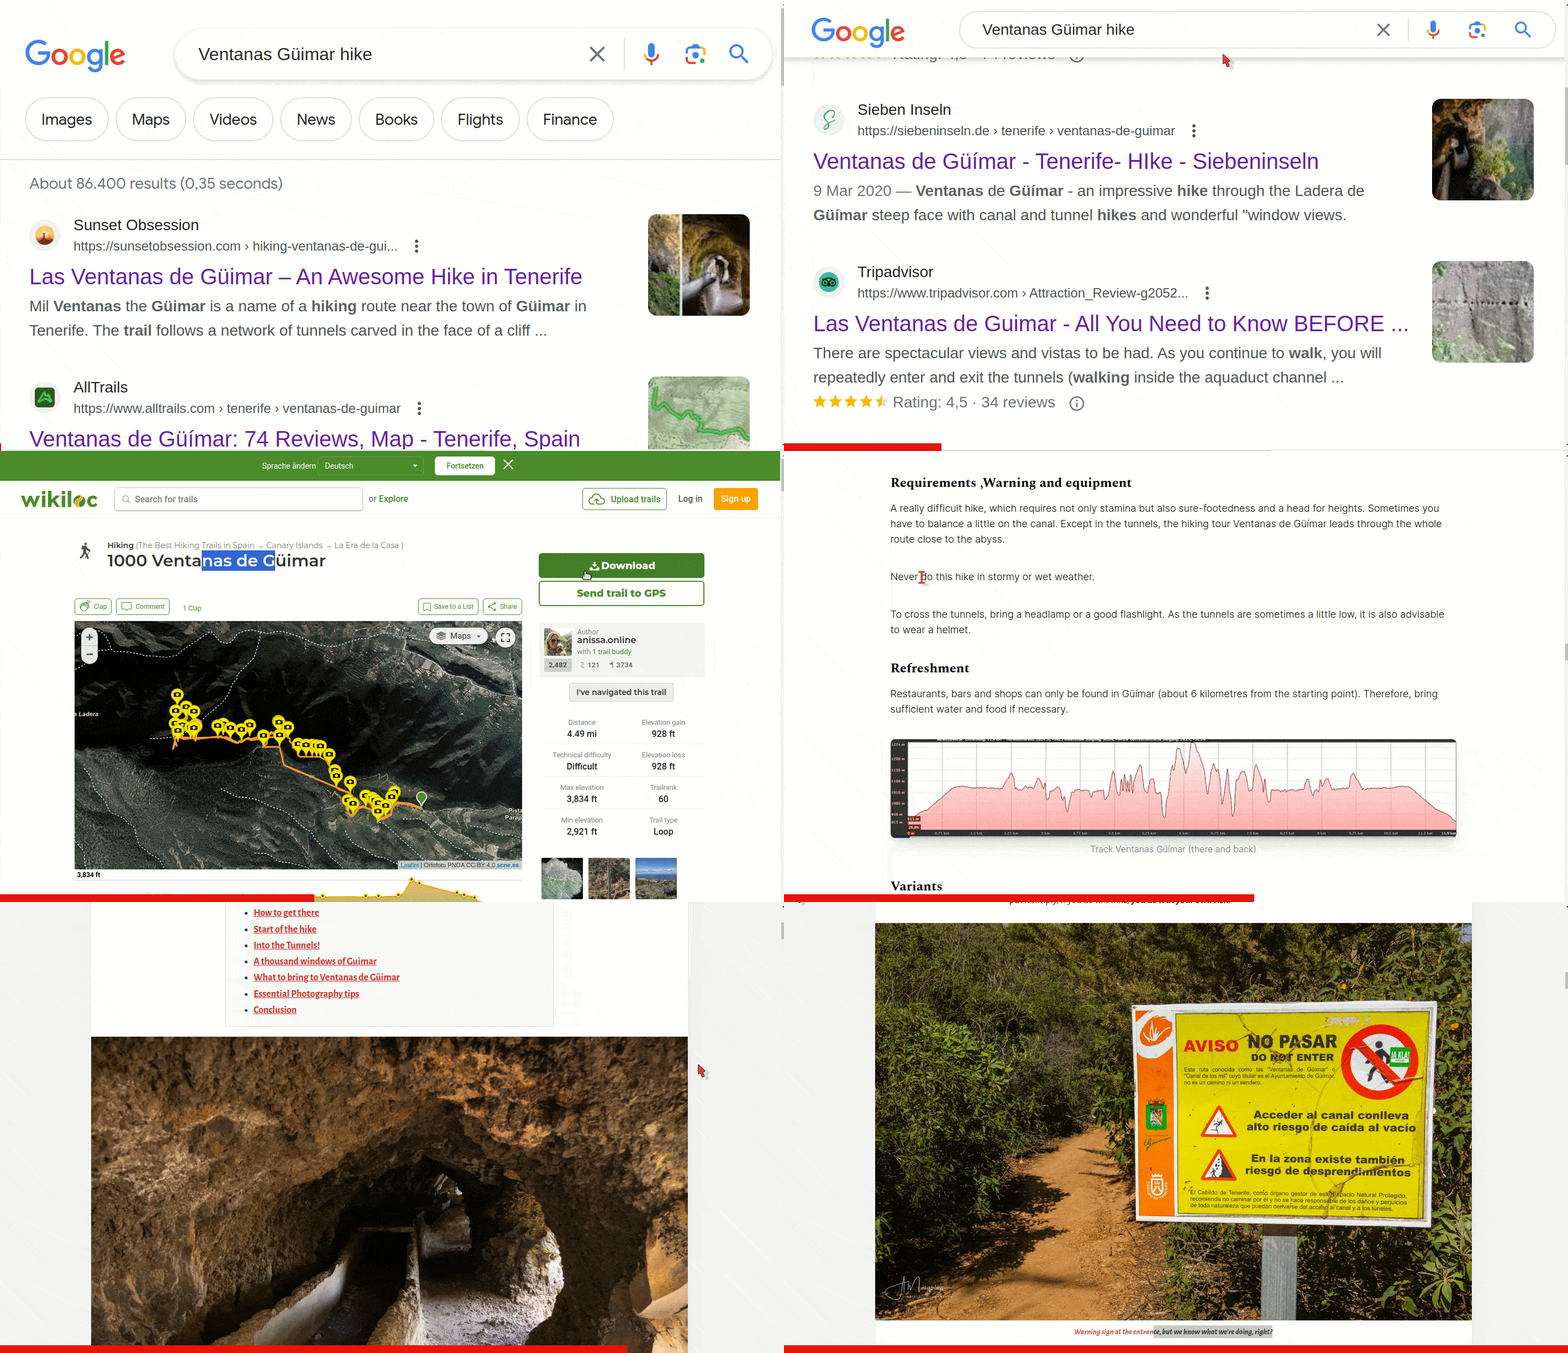
"Anyone can record the route with their mobile phone and download it. The authors don't explicitly mention if it's safe, but they present it with a big smile and encourage people to go."
This article by Sustainable Tourism in Tenerife, continues with:
"Sometimes they do it just for the photo, because these trails and their views always look great on social media and offer breathtaking panoramic views. Other times they do it for pure daring, since small, little-used paths and complicated passages can be very attractive if you are seeking an adrenaline rush. The truth is that these [dangerous] routes have become fashionable among the most adventurous and often people do not really understand the danger to which they are are exposing themselves to."
💡 Tips:
- Check the date: when was the tour posted?
- Look at the comments and the description.
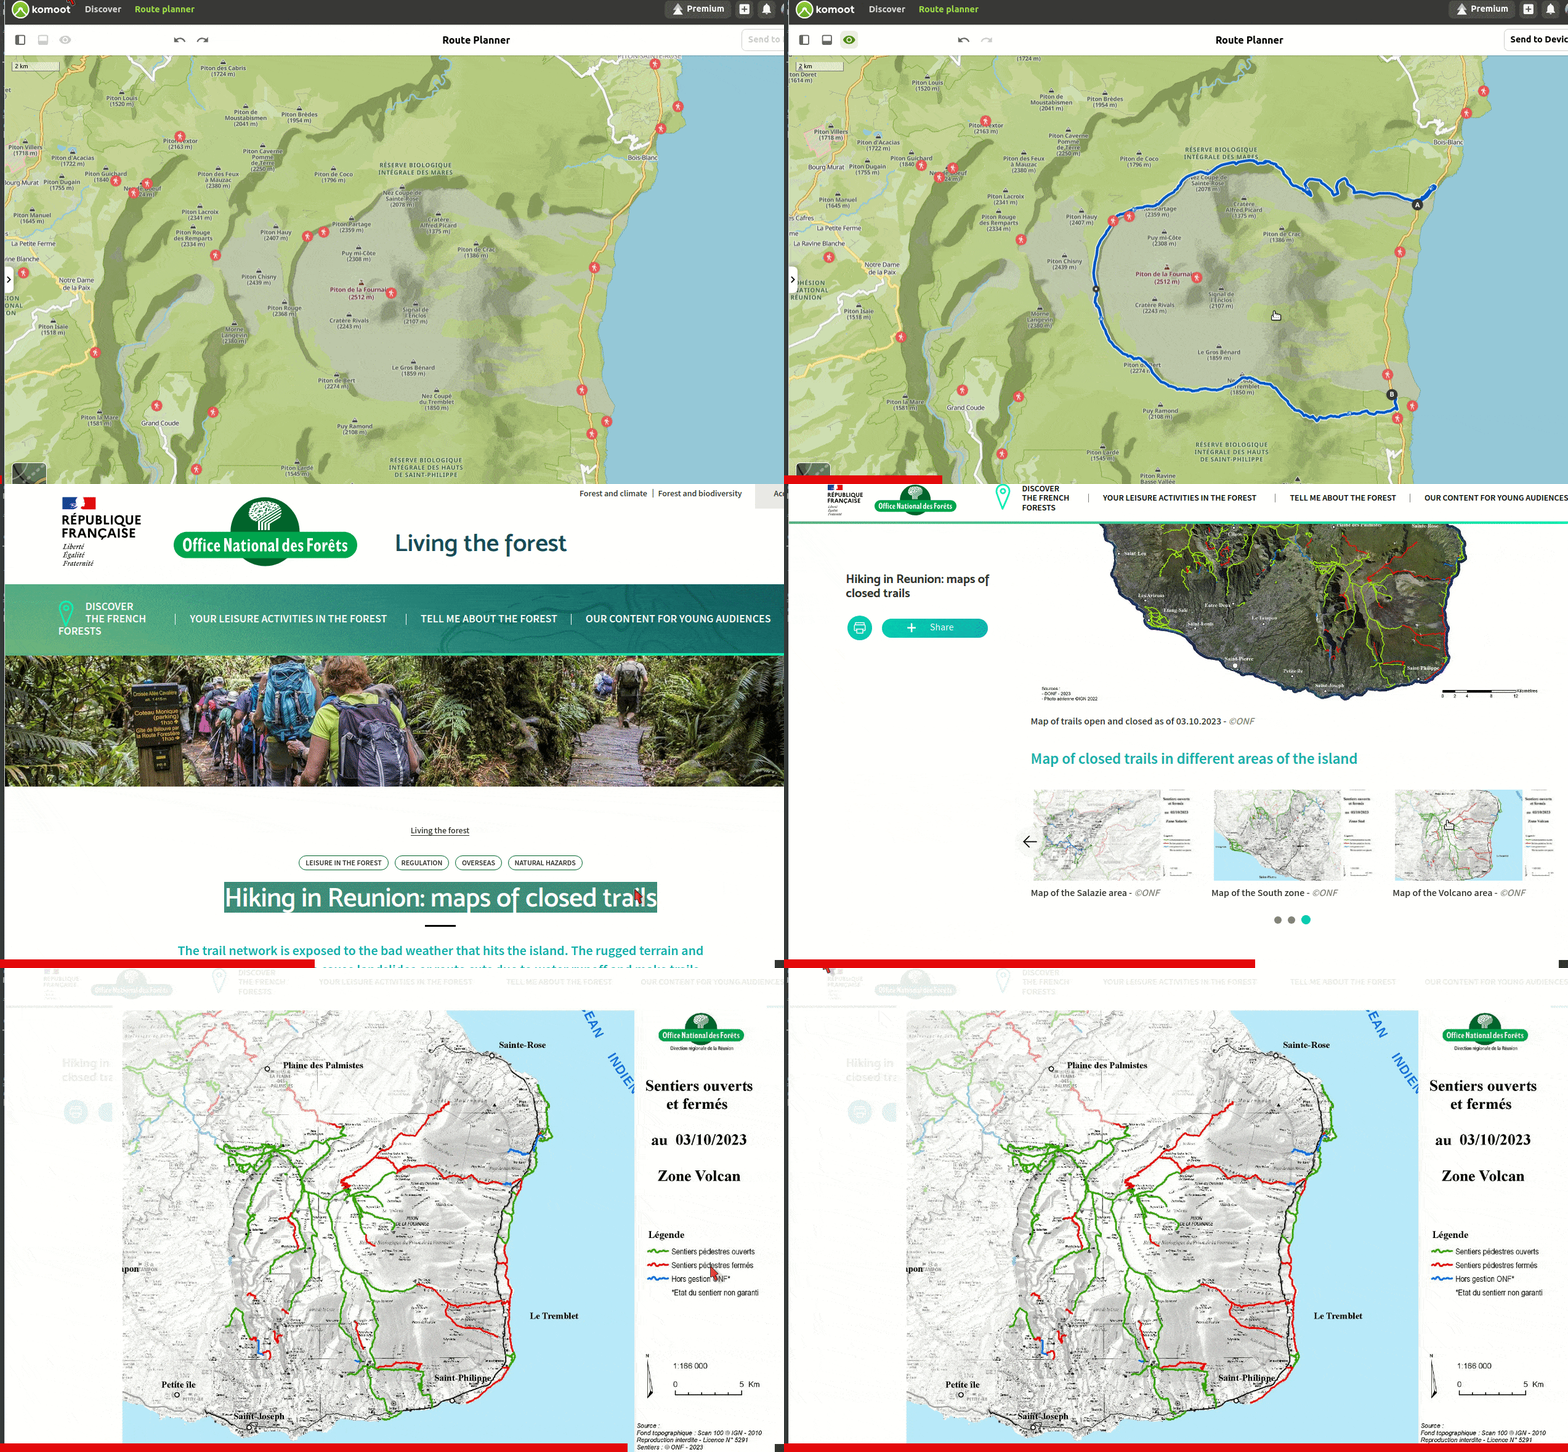
- Look for a website of the region where you plan to go, in order to find an up-to-date list of opened and closed paths.
 |
|---|
| Checking the list of opened and closed paths on an official website. Making sure the information is up-to-date. |
What about tours that do not involve off-road routes? The data on reported accidents involving cyclists could be utilized to tailor road cycling routes.
- Several websites present statistics on road traffic accidents based on local police reports.
- For instance unfallatlas.statistikportal.de in Germany.
- Perhaps, considering the ratio of
accidents/trafficmay be more pertinent than focusing solely on the absolute number of accidents.
 |
|---|
Examining the map of reported accidents with personal injury and applying the "Accidents involving bicycles" filter. |
Click to expand
 |
|---|
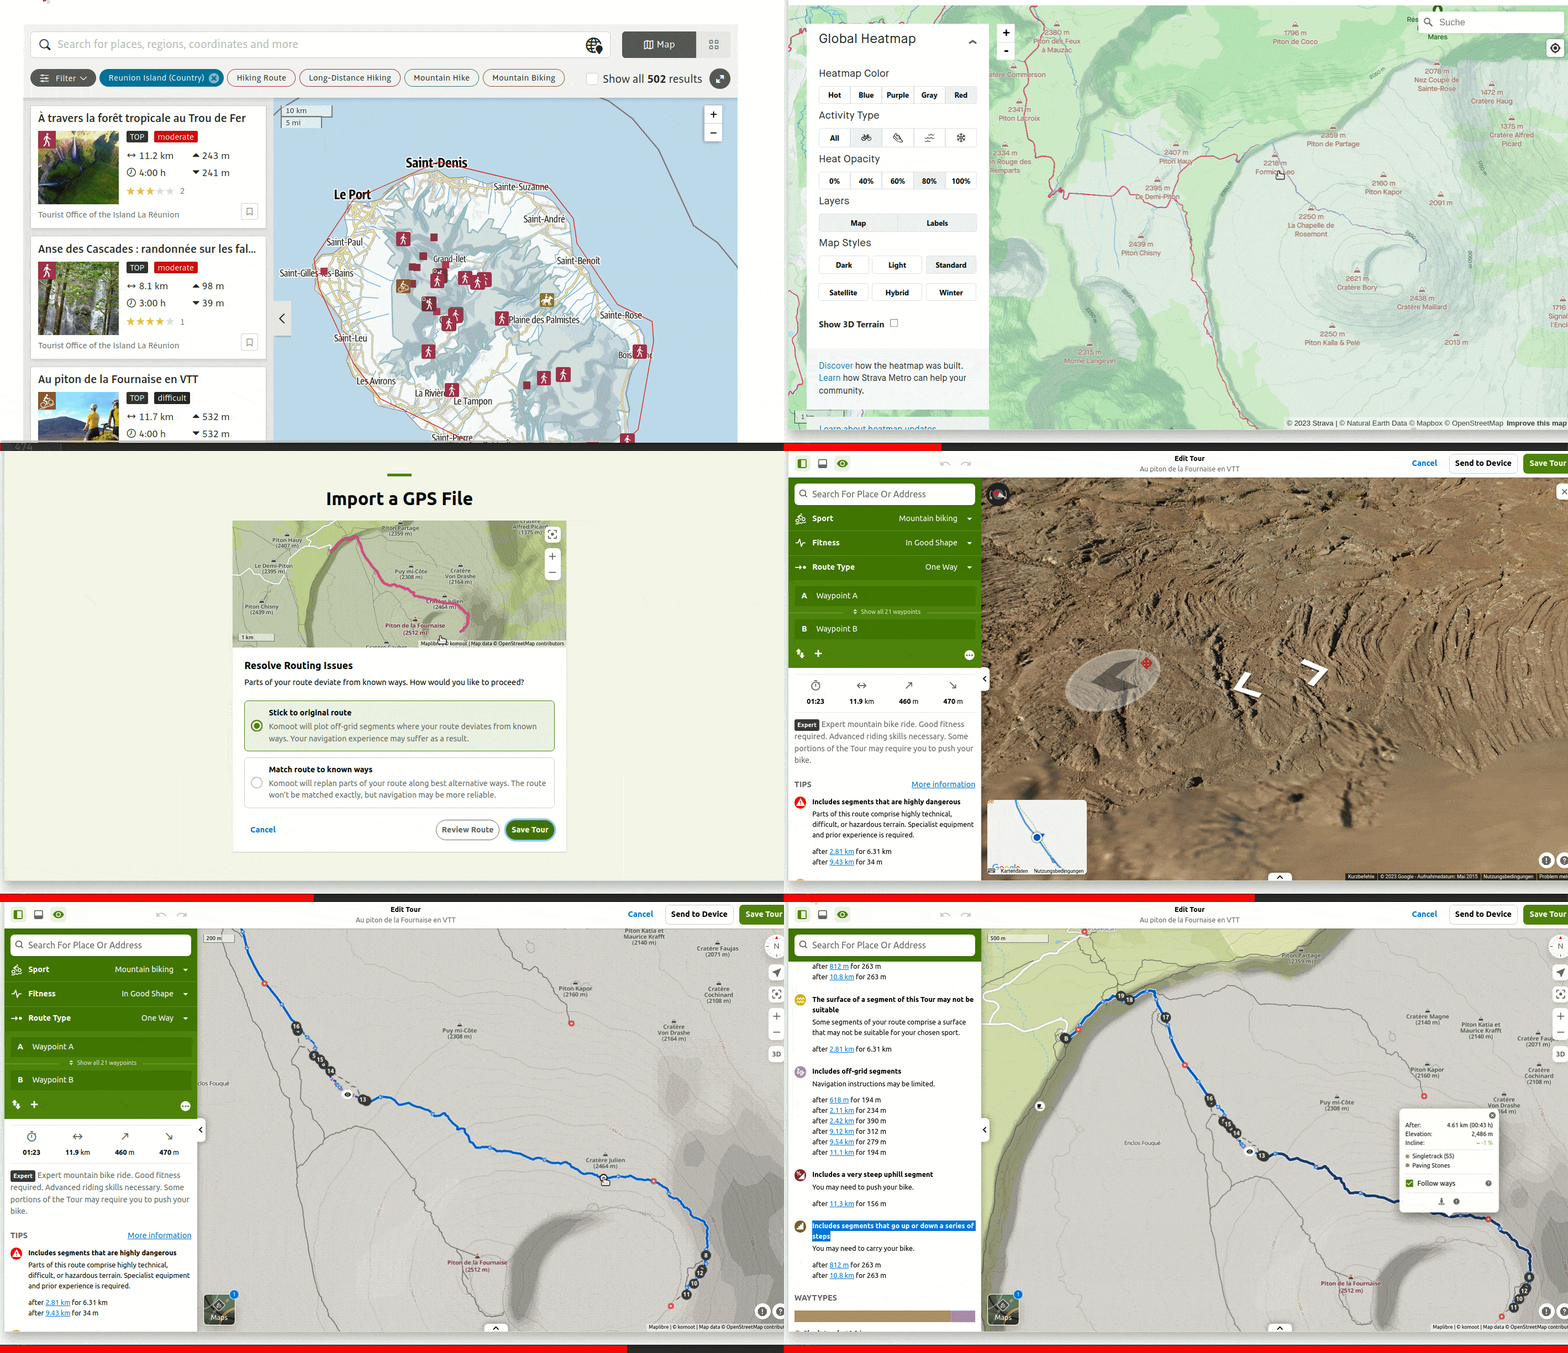
Example of the piton de la fournaise: on outdoor-active, the official local tourist office (it should be reliable, right?) promotes a mountain-bike tour marked as TOP. The .gpx is easily exported and imported to komoot. A first warning comes: "the route includes segments that are highly dangerous (for 6.31 km out of 11.9 km)". In addition, the trail view offered by google street view ends to make it clear: this route would for many mountain-bikers infeasible. |
💡 Tips:
- Be aware that the
strava global heatmapmay contain wrongly-labelled activities. In the above example, thestrava global heatmapshows some activity when applying the "only-by-bike" filter (:bike:), whereas as shown above the route is not suitable for most cyclists.- Strava users may have come by bike and recorded the hike while still in
cyclingmode. - In case of doubt, checking the
google street viewon the considered path inkomootreally helps.
- Strava users may have come by bike and recorded the hike while still in
Click to expand
While a spot may be technically safe and easy enough to access (in addition of being beautiful), it can still be forbidden. This especially applies to cycling.
 |
|---|
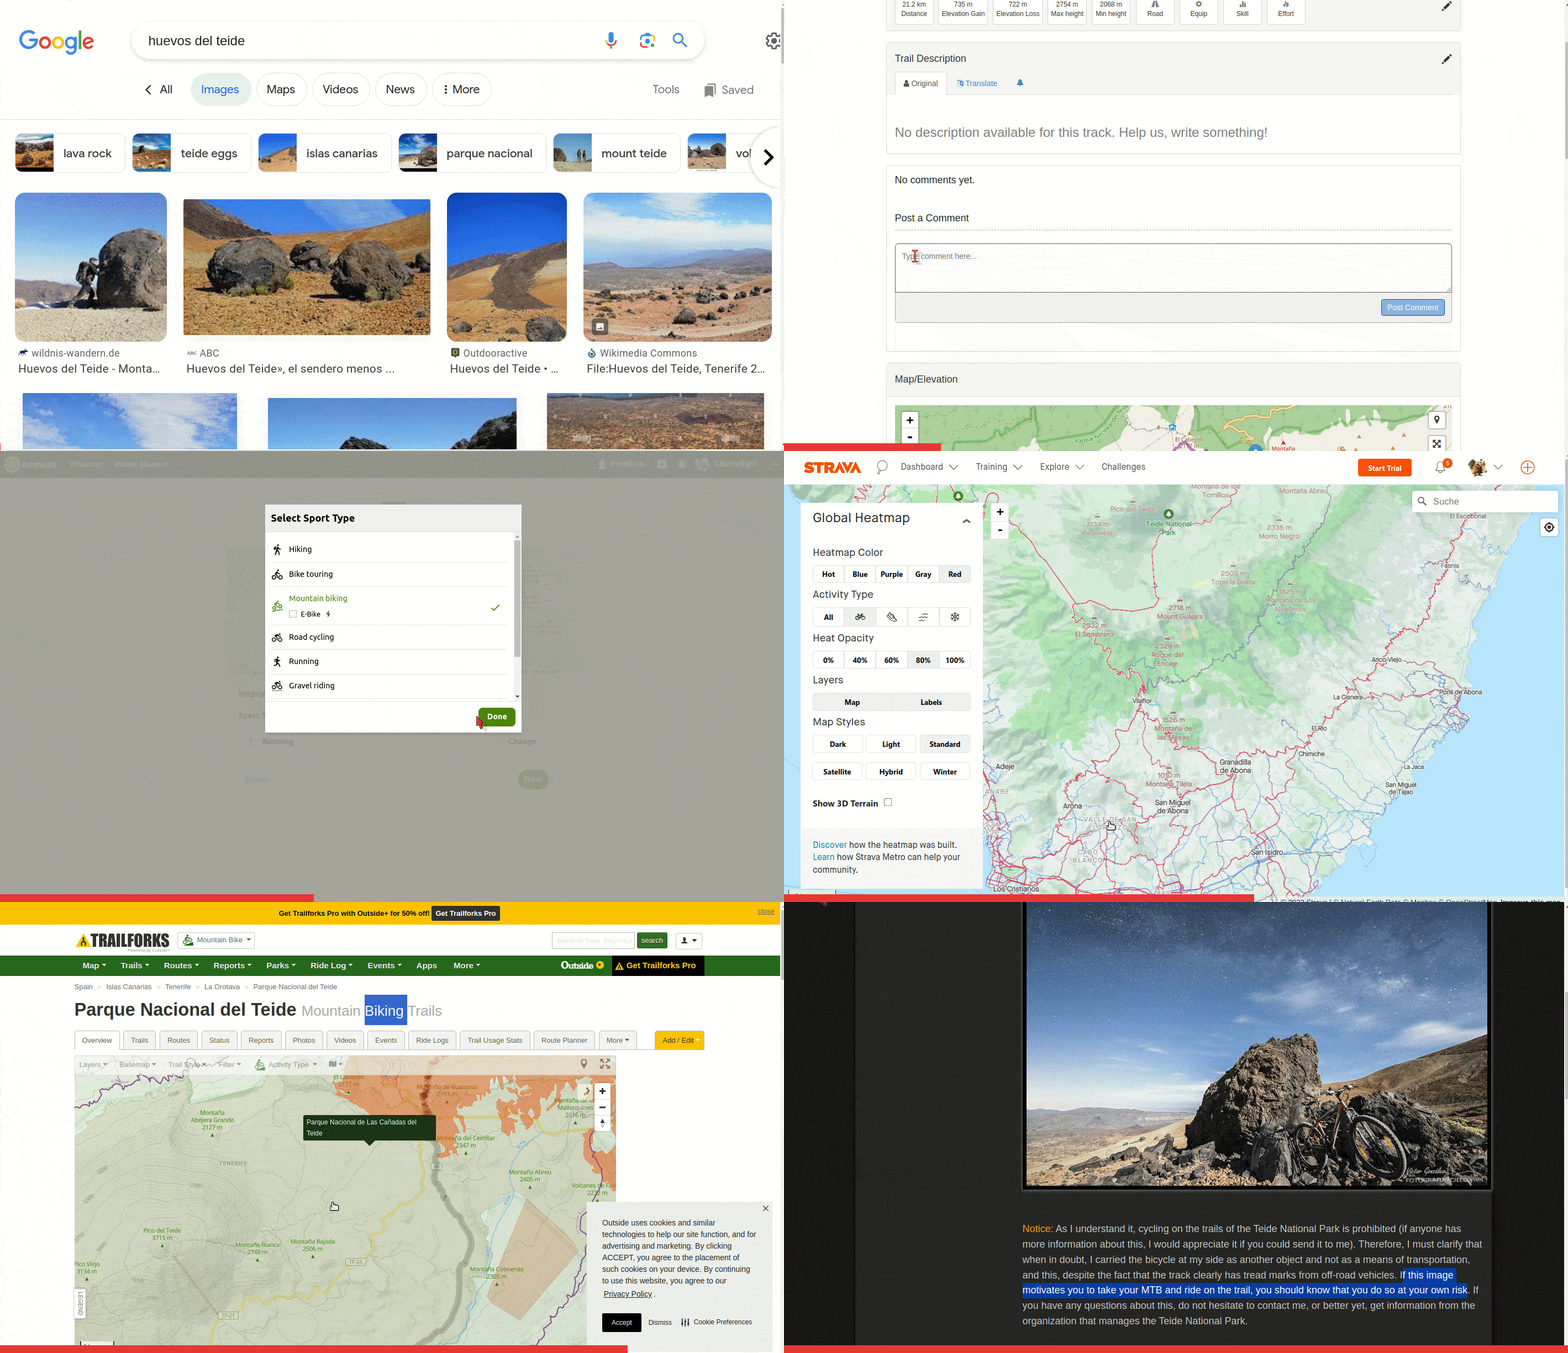
Example of the Huevos del Teide: these trails look amazing for mountain-biking, don't they?! I find in google image a nice MTB pic of this place featuring a mountain-bike. A .gpx file can be quickly and easily found. But then warnings start to accumulate: when importing the .gpx file to komoot, komoot marks most of the route as "not permitted for cycling". The strava global heatmap shows almost no activity in this zone (except the climb to montana blanca). While many MTB trails are referenced by trailforks on the island, there are none inside Teide National Park. Finally, the official text of local government states the prohibition. Back to the nice MTB pic: "If this image motivates you to take your MTB and ride on the trail, you should know that you do so at your own risk". 🤨 |
Conclusion of the above example: do ignore the warnings and use diverse information sources in order to ensure you are not planning to ride on routes forbidden by the local government.
Click to expand
Verify that your route does not contain any (temporary) closed road or path.
Streets may be blocked for a day (because of a race, a market, a demonstration, a street festival, etc.) or for longer (because of a construction site, for example).
- Such info is not easy to find!
- Looking for all the events happening in a given region at a certain date may give hints, but could be very tedious and still incomplete.
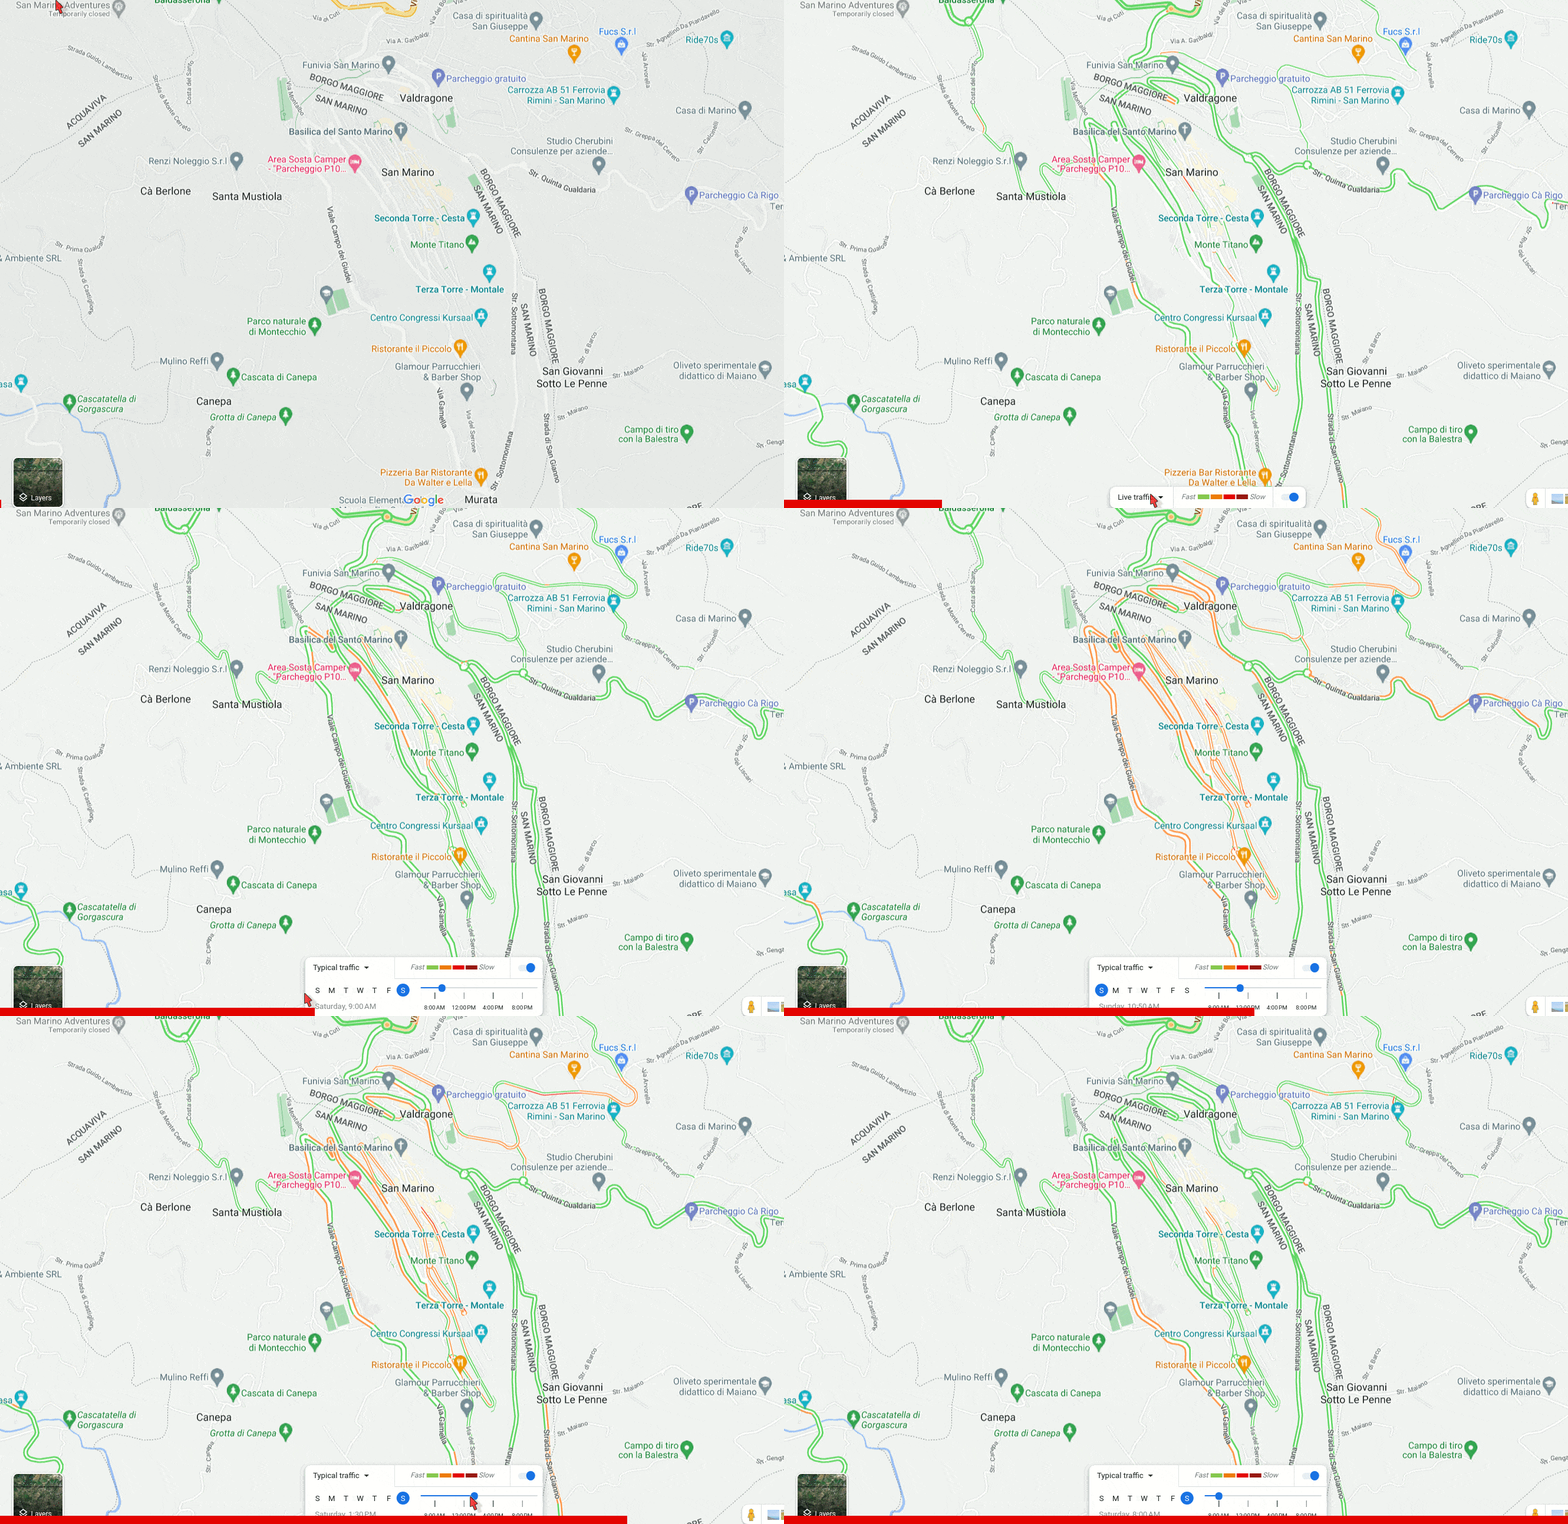
 |
|---|
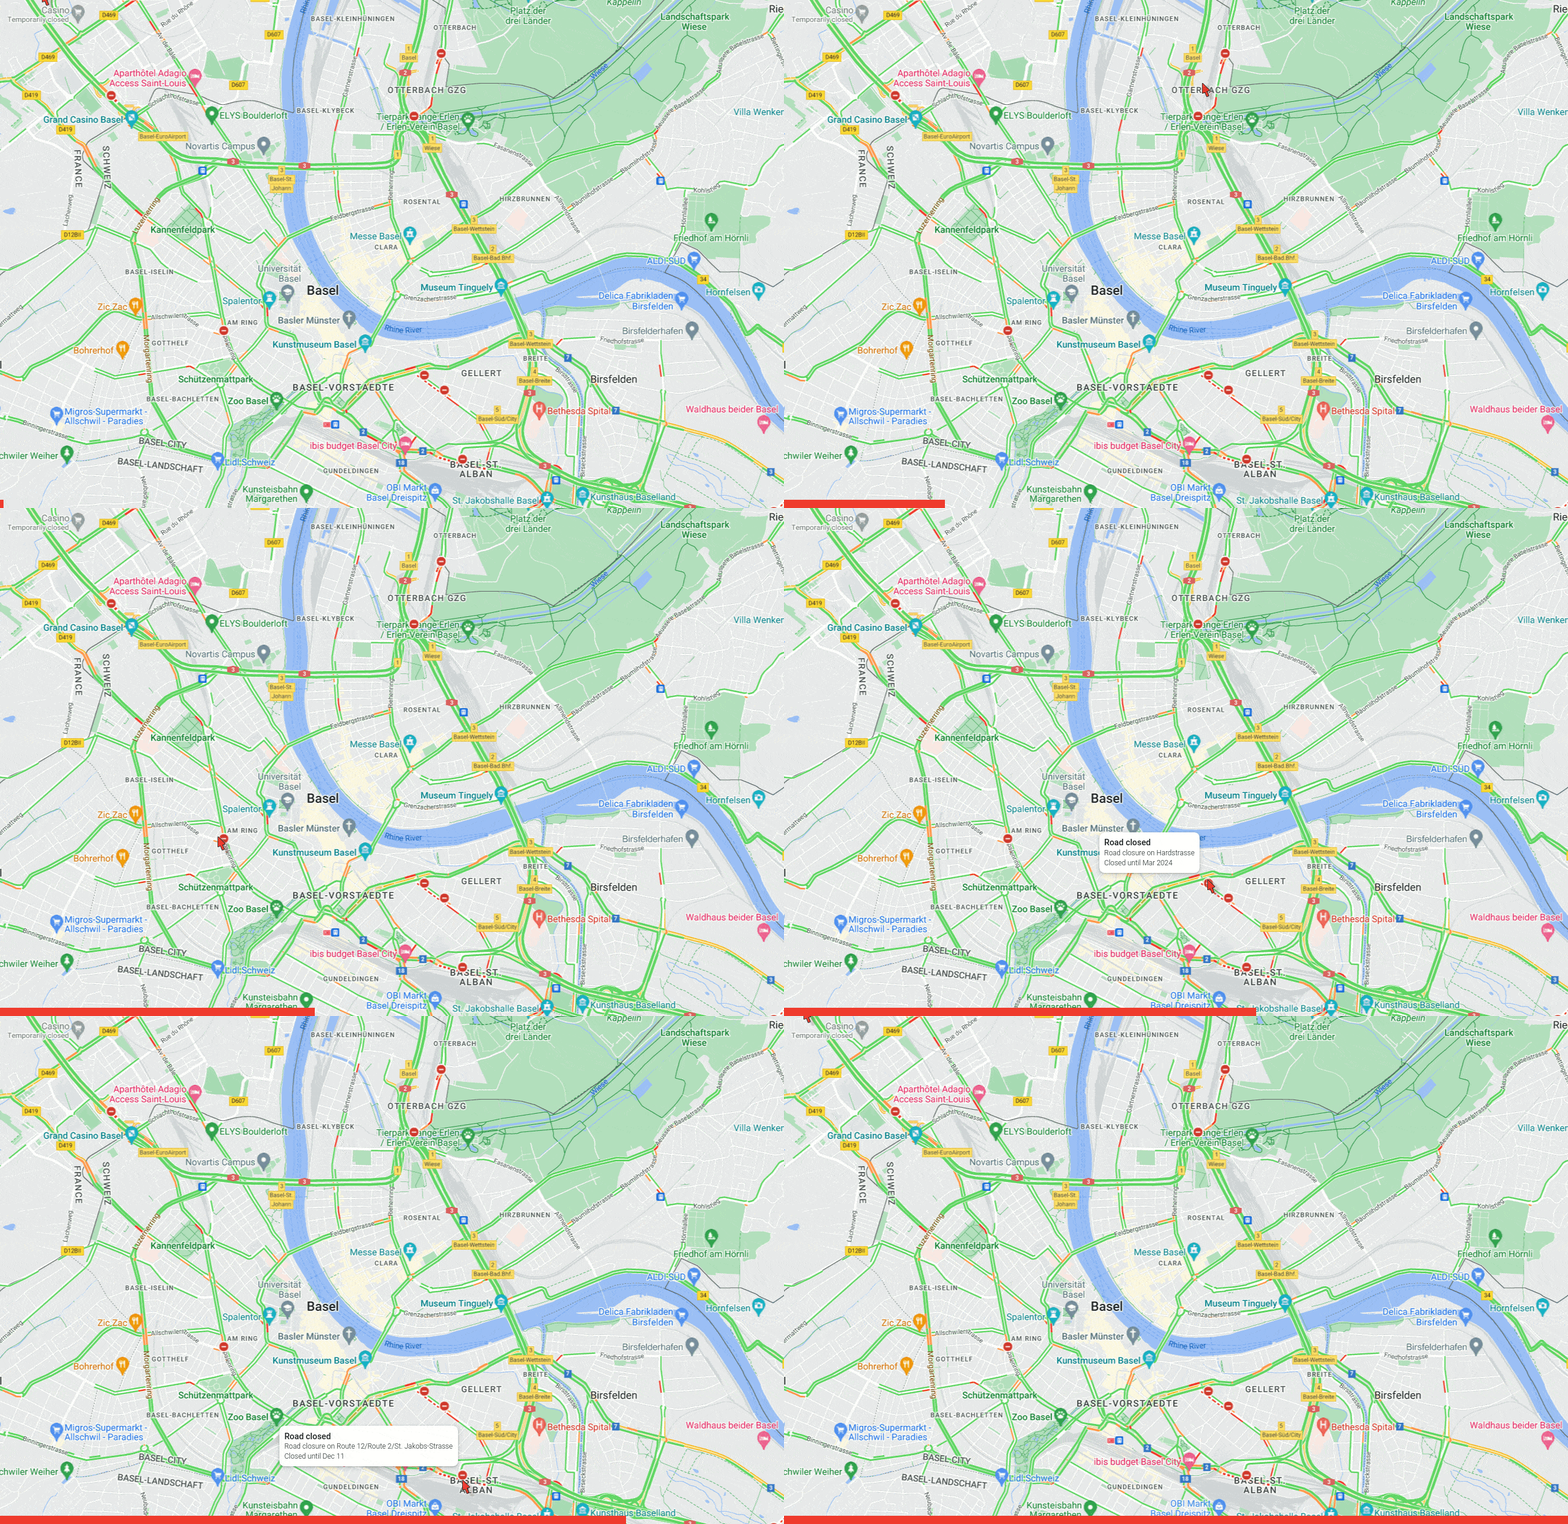
The traffic layer of google maps can show currently blocked streets. |
Paths may be closed for repairs or as a precaution after bad weather, as shown in the example of the saftey section.
 |
|---|
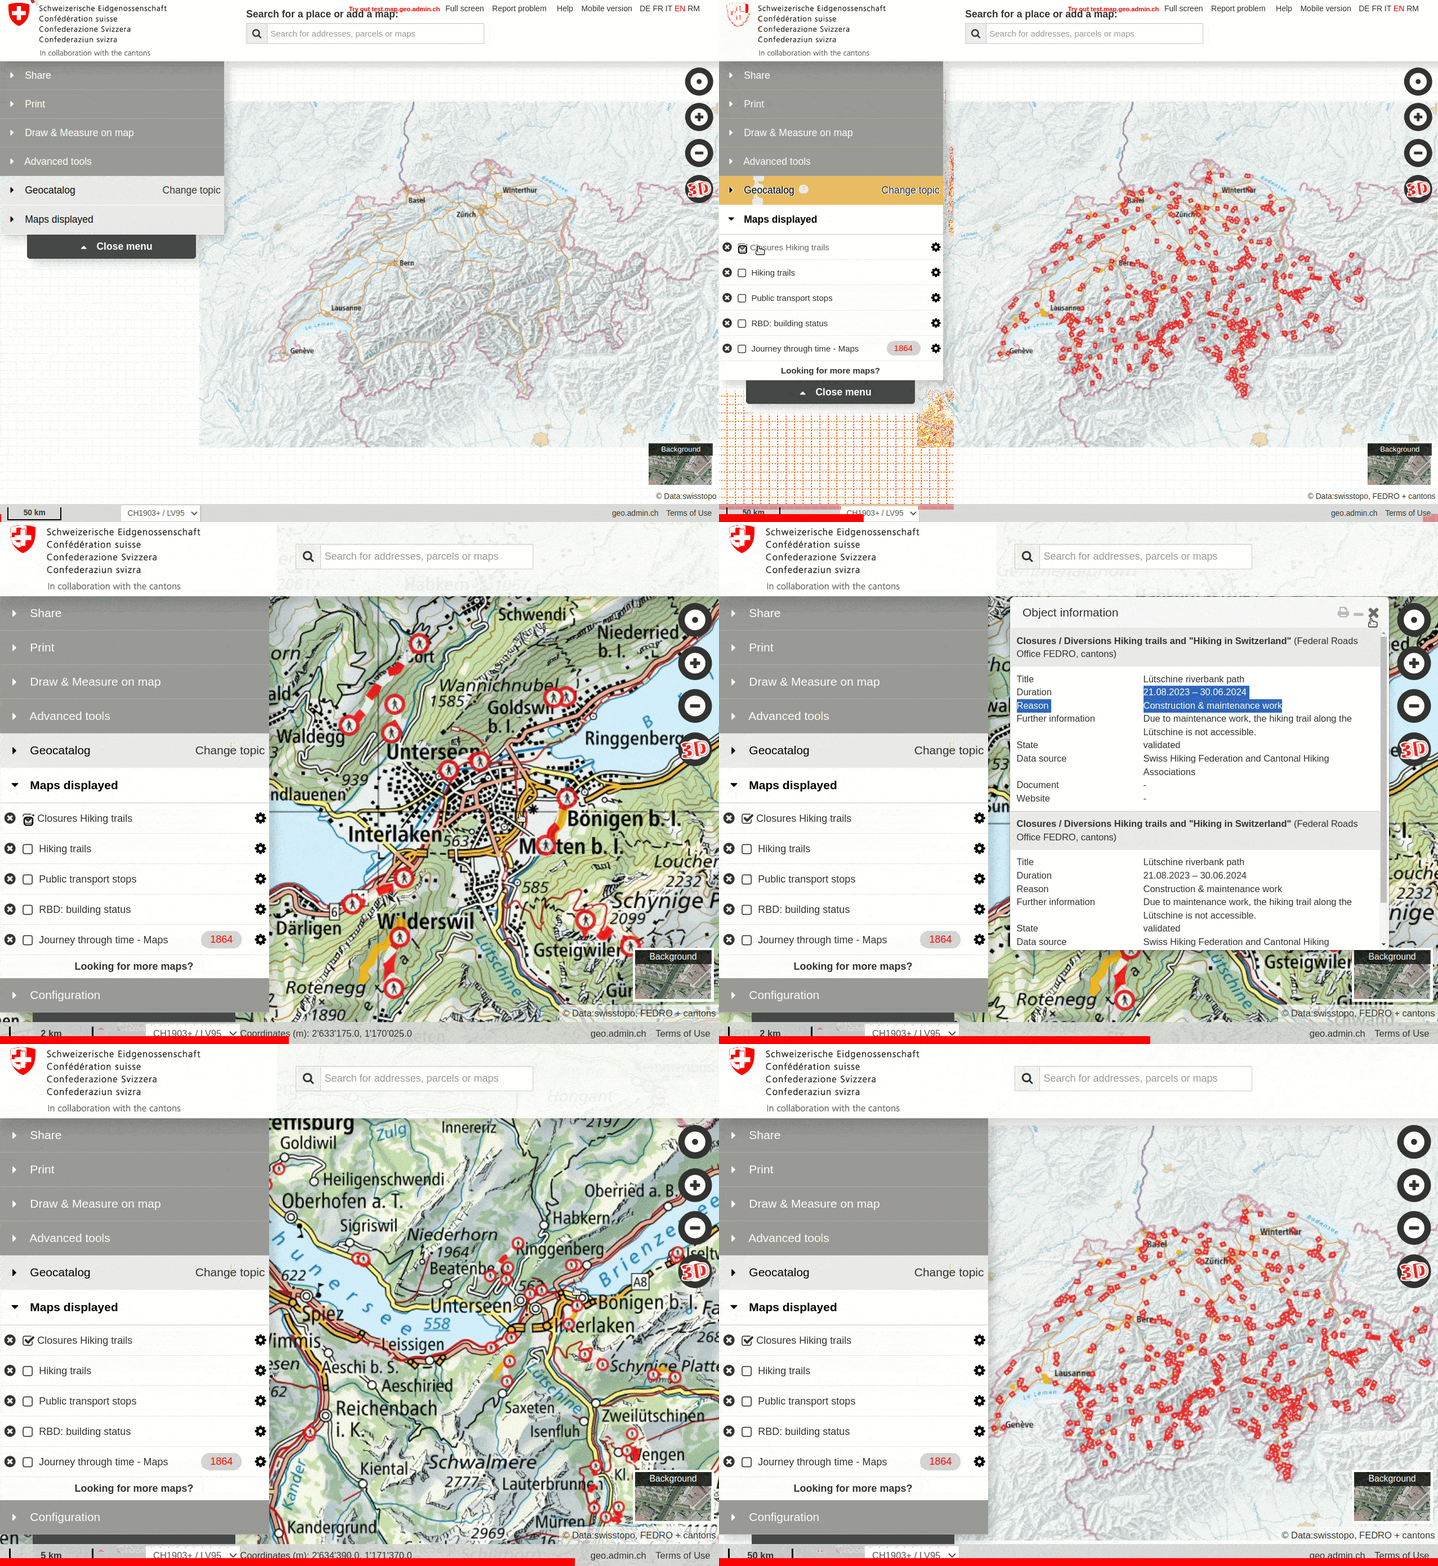
| The map of the excellent Swiss geographical information platform reference the closed trails in Switzerland 🇨🇭. |
The examples above only list current blockages that have already started.
- It would be nice to know in advance which blockages are planned for a certain date. See the still missing section.
Click to expand
The weather conditions along your planned route can be inspected using different tools:
komoot/premium/weather:-
"Worried you’re heading into bad weather? Find out ahead of time and pack precisely the kit you’ll need — thanks to dynamic weather forecasts that cover every inch of your adventure."
-
Epic Ride Weather:-
"
Epic Ride Weatherconnects to your routes and rides inStrava,Ride With GPS,Komootand other services. You pick the route and start time, andEpic Ride Weatherforecasts the weather for the duration of your ride based on your pace."
-
- And many more.
 |
|---|
Ad for the dynamic weather forecasts by komoot (source). Weather information such as temperature, precipitation, wind speed and direction and UV index can be displayed for every single part of your route, as well as waytypes & surfaces and elevation profile information. Forcast can be made up to 48h in advance. This komoot feature is restricted to premium users but, as written above, many free alternatives exist. |
Standard weather forecasts are valuable, but imperfect for outdoor activities since they usually do not express an apparent temperature, which would be more appropriate: 🌡️
- "The apparent temperature, also known as "feels like", is the temperature equivalent perceived by humans, caused by the combined effects of air temperature, relative humidity and wind speed." (wikipedia).
💡 Tips:
- Try to estimate which parts of your route will be:
- 1- Exposed to the wind. 🌬️
- 2- Shaded. 🌓
- For example dense trees in a forest can protect you from the wind, while their leaves can shield you from the sun radiations.
- Multiple methods can be used:
- Satellite views (e.g. with
komoot,strava,google maps) give quick and reliable information about the presence of forest. 🌲 - The vegetation and its density can also be estimated using a map legend and/or the shades of green on the map. 🌳
- For instance
dense forest,open forest,mountain pasture,meadow,rock,glacierare possible vegetation types in the map legend.
- For instance
- The surrounding terrain should also be taken into account:
- For instance a mighty mountain in the west can obscure the setting sun and therefore cause an earlier sunset for you. 🌄
- Satellite views (e.g. with
- Once you have estimated the shadow and wind protection along the route, you could decide the direction of your route (
clockwiseorcounterclockwise). 🔄- Personally, I prefer to climb hills in cool conditions and descend them in warmer conditions.
 |
|---|
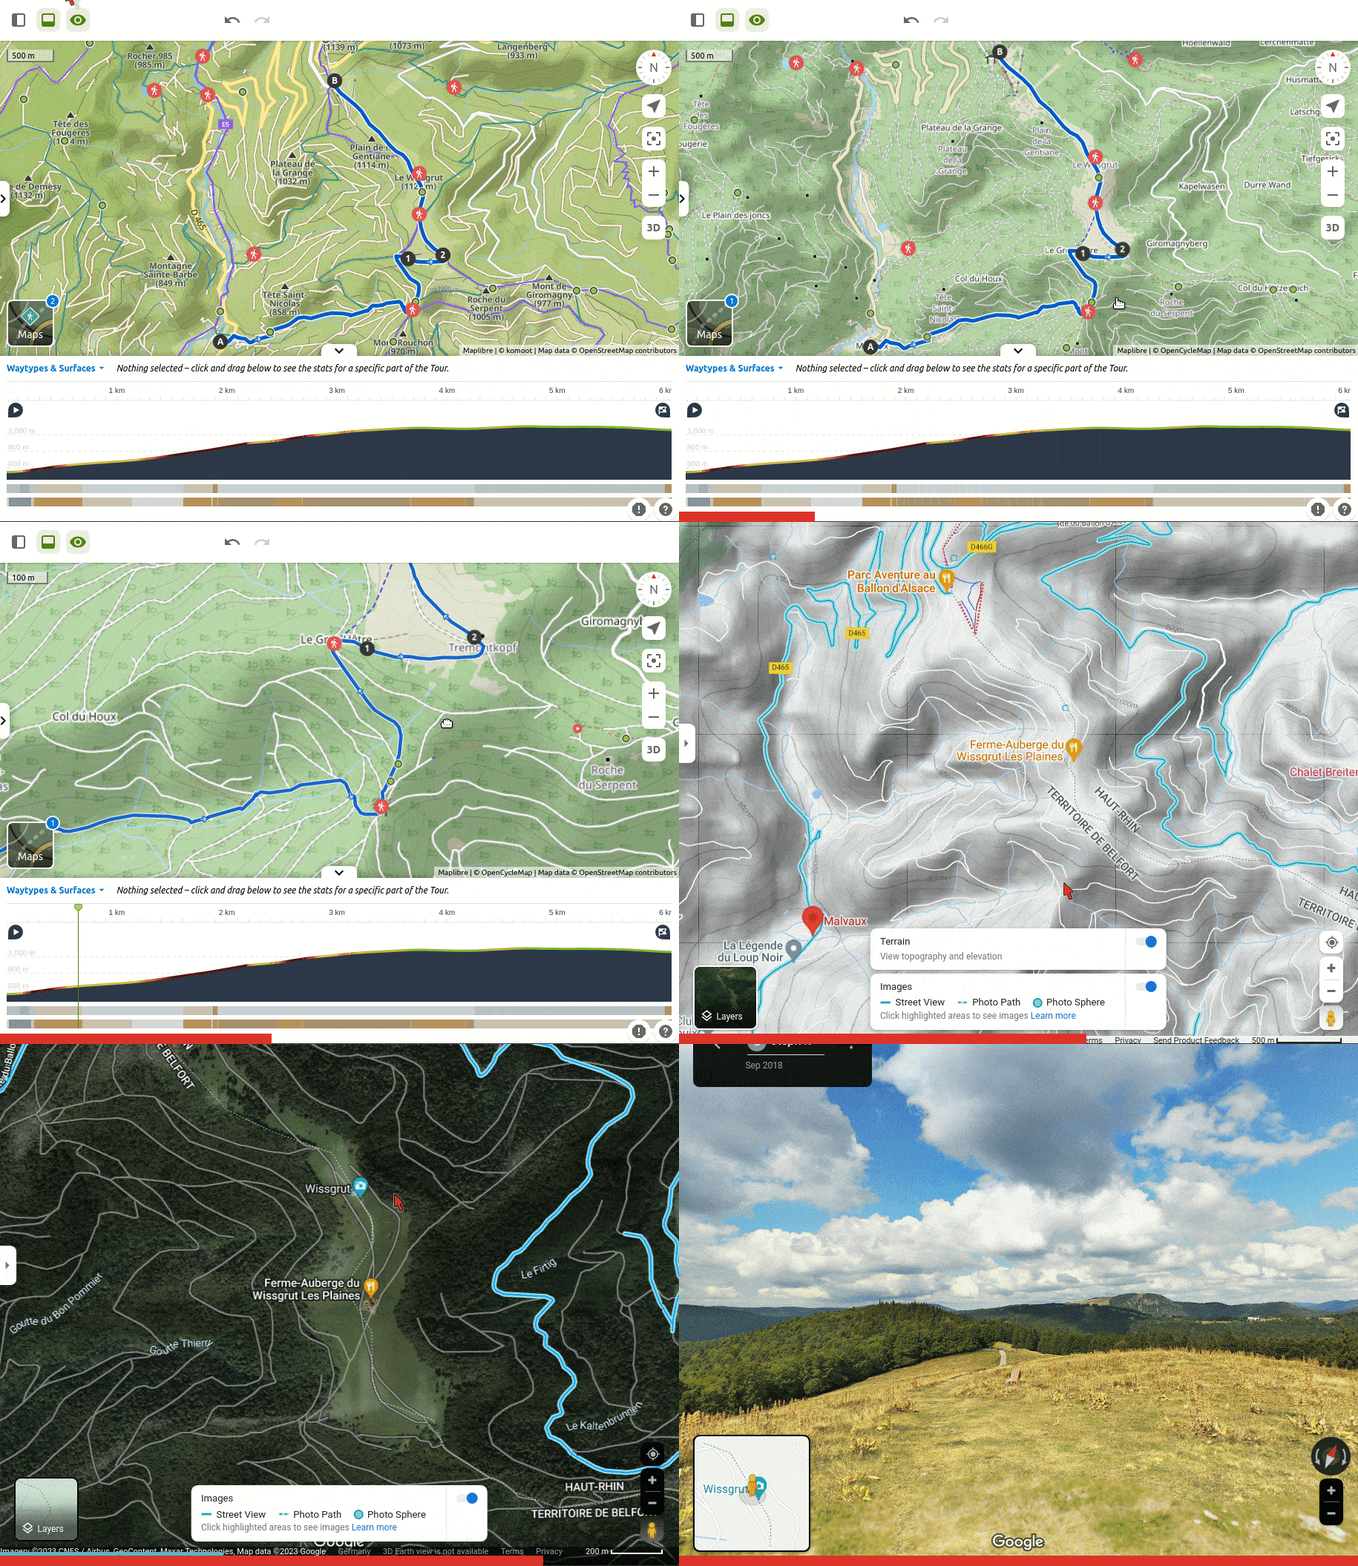
Inspecting the vegetation along this route which, according to the elevation profile, consists of a long climb followed by a flat portion on a ridge. The OpenStreetMap layer shows forest as "vegetation type" for the climb (:evergreen_tree:) while the ridge looks to be more like a meadow (light gray). The komoot-trail-view, the satellite view, and the google street view confirm these vegetation types. This means the ridge should be more exposed to sun and wind than the climb. |
 |
|---|
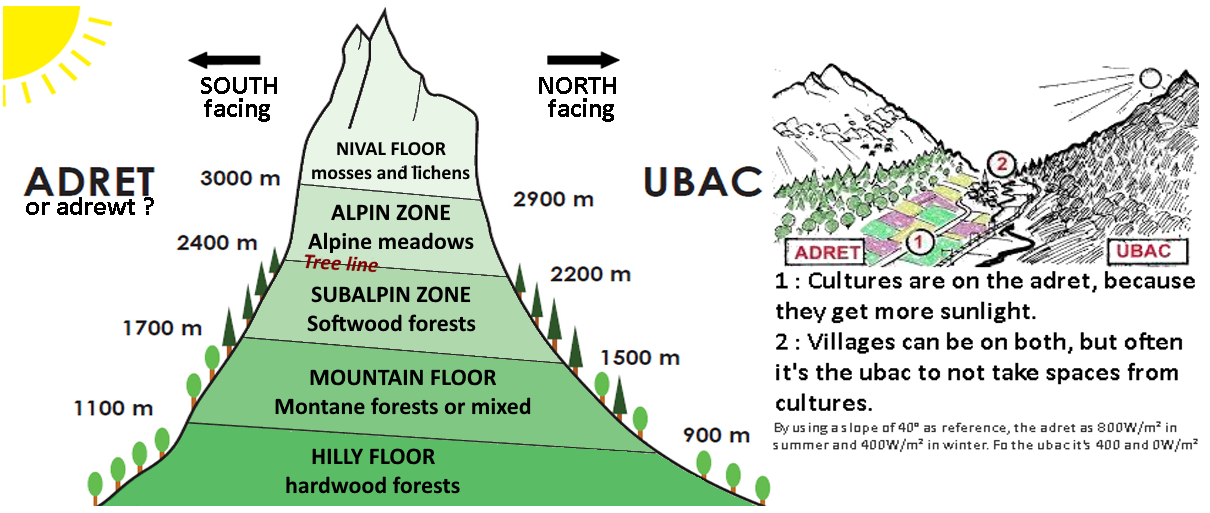
| Bonus: Do you know the terms "adret" and "ubac" used in the French Alps? An "adret" slope is the land on the side of a valley that receives the most sunlight. Conversely, an "ubac" slope refers to the opposite side (cool and dark). (source of image) |
Click to expand
You can utilize further different maps to refine your planned tour, for example:
- 🇫🇷
- 🇨🇭 (this map offers many interesting layers 👍)
outdoor-active
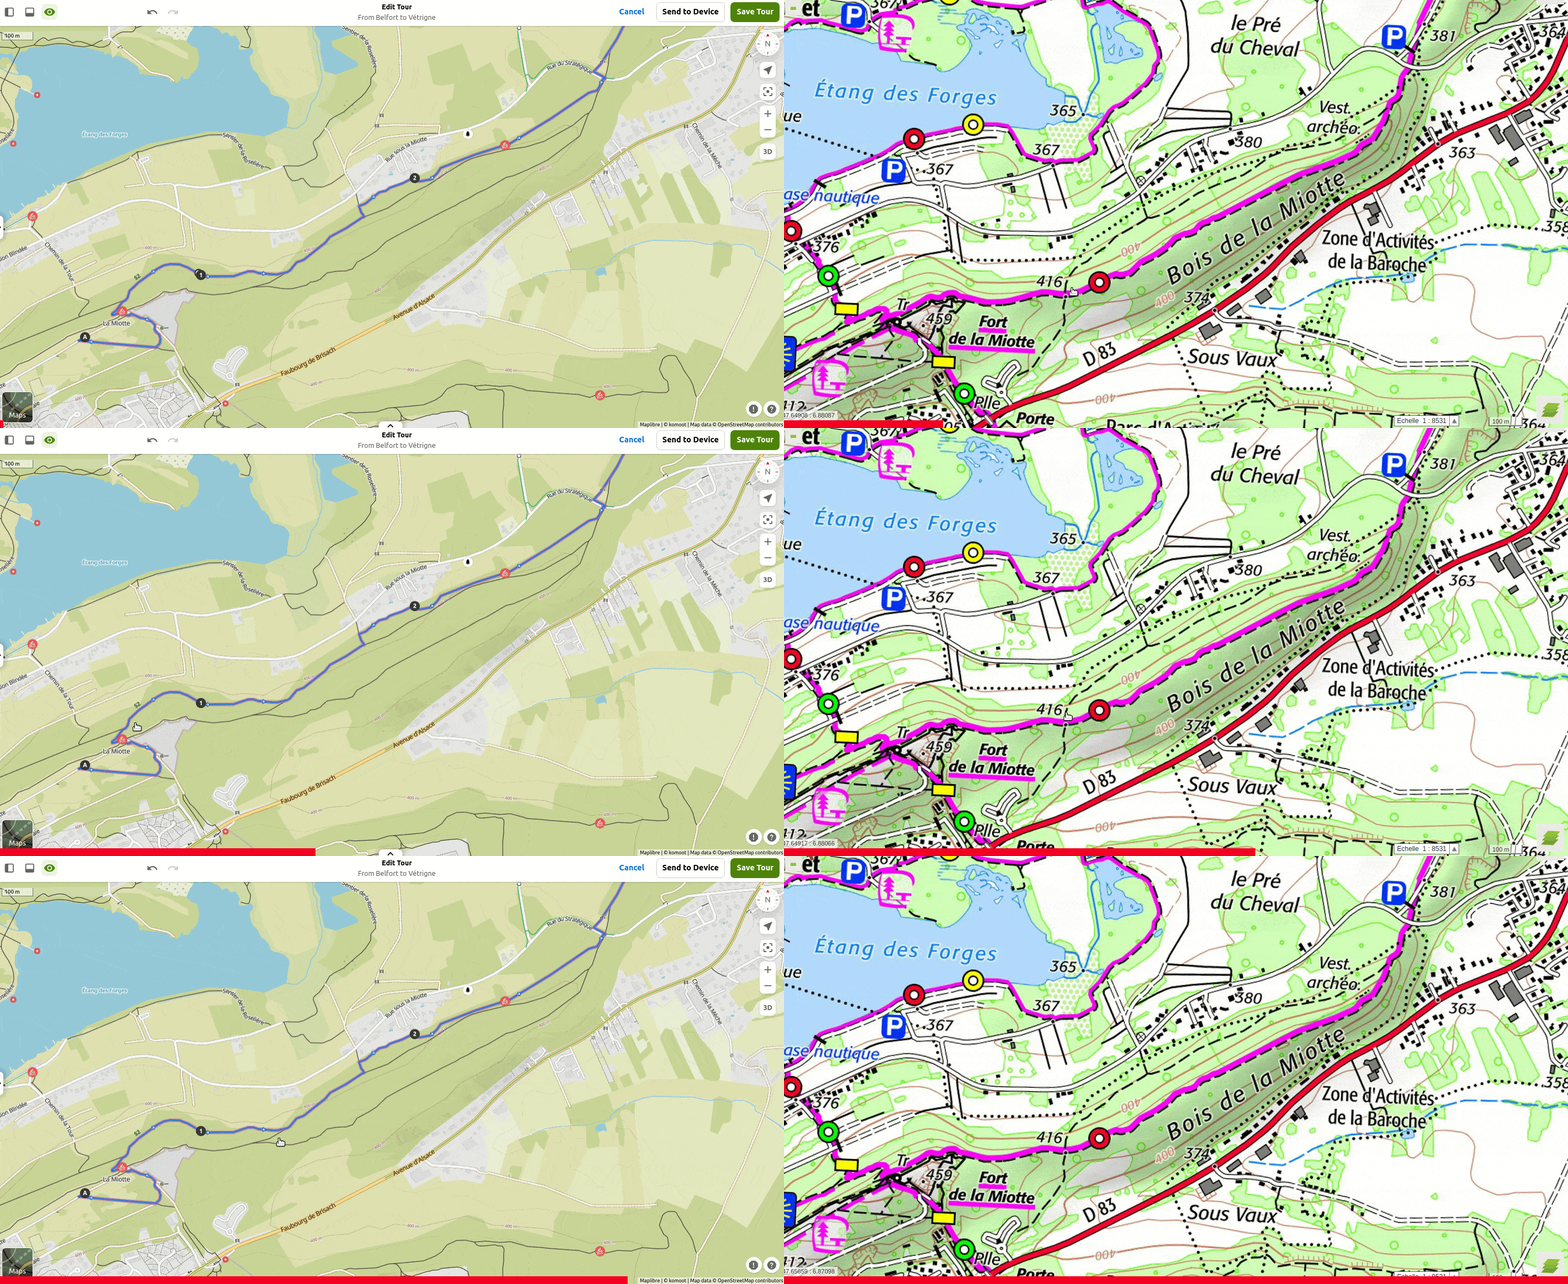 |
|---|
The maps of komoot and IGN differ: some paths exist on one map and not on the other. The strava-global-heatmap shows that the komoot map seems to be more up-to-date. |
Your route is now prepared! 🏆
Before you go for your adventure, here a couple of final words and thoughts.
Click to expand
🧭 1- To navigate the route:
- Either navigate the route using the
komootapp. - Or download the
.gpxfile fromkomootand use it on another navigation device.
💡 Tips:
- Non-premium users of
komootcan download the.gpxfile of the route using theKomoot to GPXapp.- Make sure to (temporary) make the route "public", otherwise the app will not manage to find and download it.
🩹 2- Your adventure, although carefully planned, could be disrupted by various factors:
- Personal reasons:
- Injury 🤕
- Mechanical problem 💥
- External reasons:
- Delayed / cancelled transport, e.g. train/bus ⏳
- Blocked route 🚧
- Changing weather 🌪️
Preparing an alternative route may be useful!
Here's a list of features I'm missing and that would be very useful for planning routes.
- Should you know already existing solutions or should you have ideas, please let me know (see the your suggestions section)! 🙏
Click to expand
-
🗺️ #1 How to overlay maps.
- Some examples in previous sections (e.g. usage frequency) were using both
strava-global-heatmapandkomoot-mapin parallel. - It would be very convenient to have these two maps merged into one single map.
- Here is a very good example of a chrome extension which allows to overlay the
strava-global-heatmaponto theOpenStreetMap(in "iD editor" mode). 👍 - It would be useful to extend this tool to other maps such as
komoot.
- Here is a very good example of a chrome extension which allows to overlay the
- As explained in the usage frequency section, an alternative to merging two aligned maps into one single map is to align the two maps opened in two neighbouring tabs of the internet browser, and to quickly switch from one to another.
- The alignment of the two maps can be done manually, but it would be great to automate it. 🤖
- This should not be too hard:
- Most maps are displayed based on
latitude,longitudeandzoomparameters. You can see below that these three parameters are present in the two URLs ofstravaandkomoot, for example:https://www.strava.com/heatmap#11.42/-4.46321/48.33819/bluered/ride(format:zoom/longitude/latitude)https://www.komoot.com/plan/@48.3332830,-4.4579533,10.304z?sport=racebike(format:latitude,longitude,zoom)
- Equalizing these three parameters for the two websites of
stravaandkomootshould align their maps.
- Most maps are displayed based on
- Some examples in previous sections (e.g. usage frequency) were using both
-
🚦 #2 Traffic-lights counter.
- Current issue:
road-cyclingin a city can become a nightmare if encountering plenty of traffic lights. - It would be great to determined, given a planned cycling route, the number of traffic lights contained in the route.
- Idea-1: as a first estimate, this could be determined based on the number of crossroads along the route.
- Idea-2: another approach could be to utilize
Google Maps, which already provides information about traffic lights and stop signs along your route.- As shown in the traffic lights section.
- Current issue:
-
🚘 #3 Heatmap of cars.
- While it's not always possible to road-cycle exclusively on
cycleways(e.g. some of them have a gravel surface), sharing the road with a high volume of vehicles is not ideal. - It would be useful to find roads with the less possible automotive traffic. 😉
- Idea: the traffic layer of
google mapscan be used to estimate the usual traffic, as demonstrated in the traffic lights section.
- While it's not always possible to road-cycle exclusively on
-
🚧 #4 Map of temporary closed streets.
- Most maps focus on describing the space. There is no time dimension. But indeed maps can change over time: For instance, a race event or a construction site could block certain streets.
- Visualizing such modifications on the map, based on the date of the planned activity, would be beneficial.
- Idea-1: local authorities should be aware of coming events (organizers have declared). Maybe they could communicate this to
komootorstrava. - Idea-2:
google mapsalready references some roads that are currently closed, as shown in the road blockage section.
 |
|---|
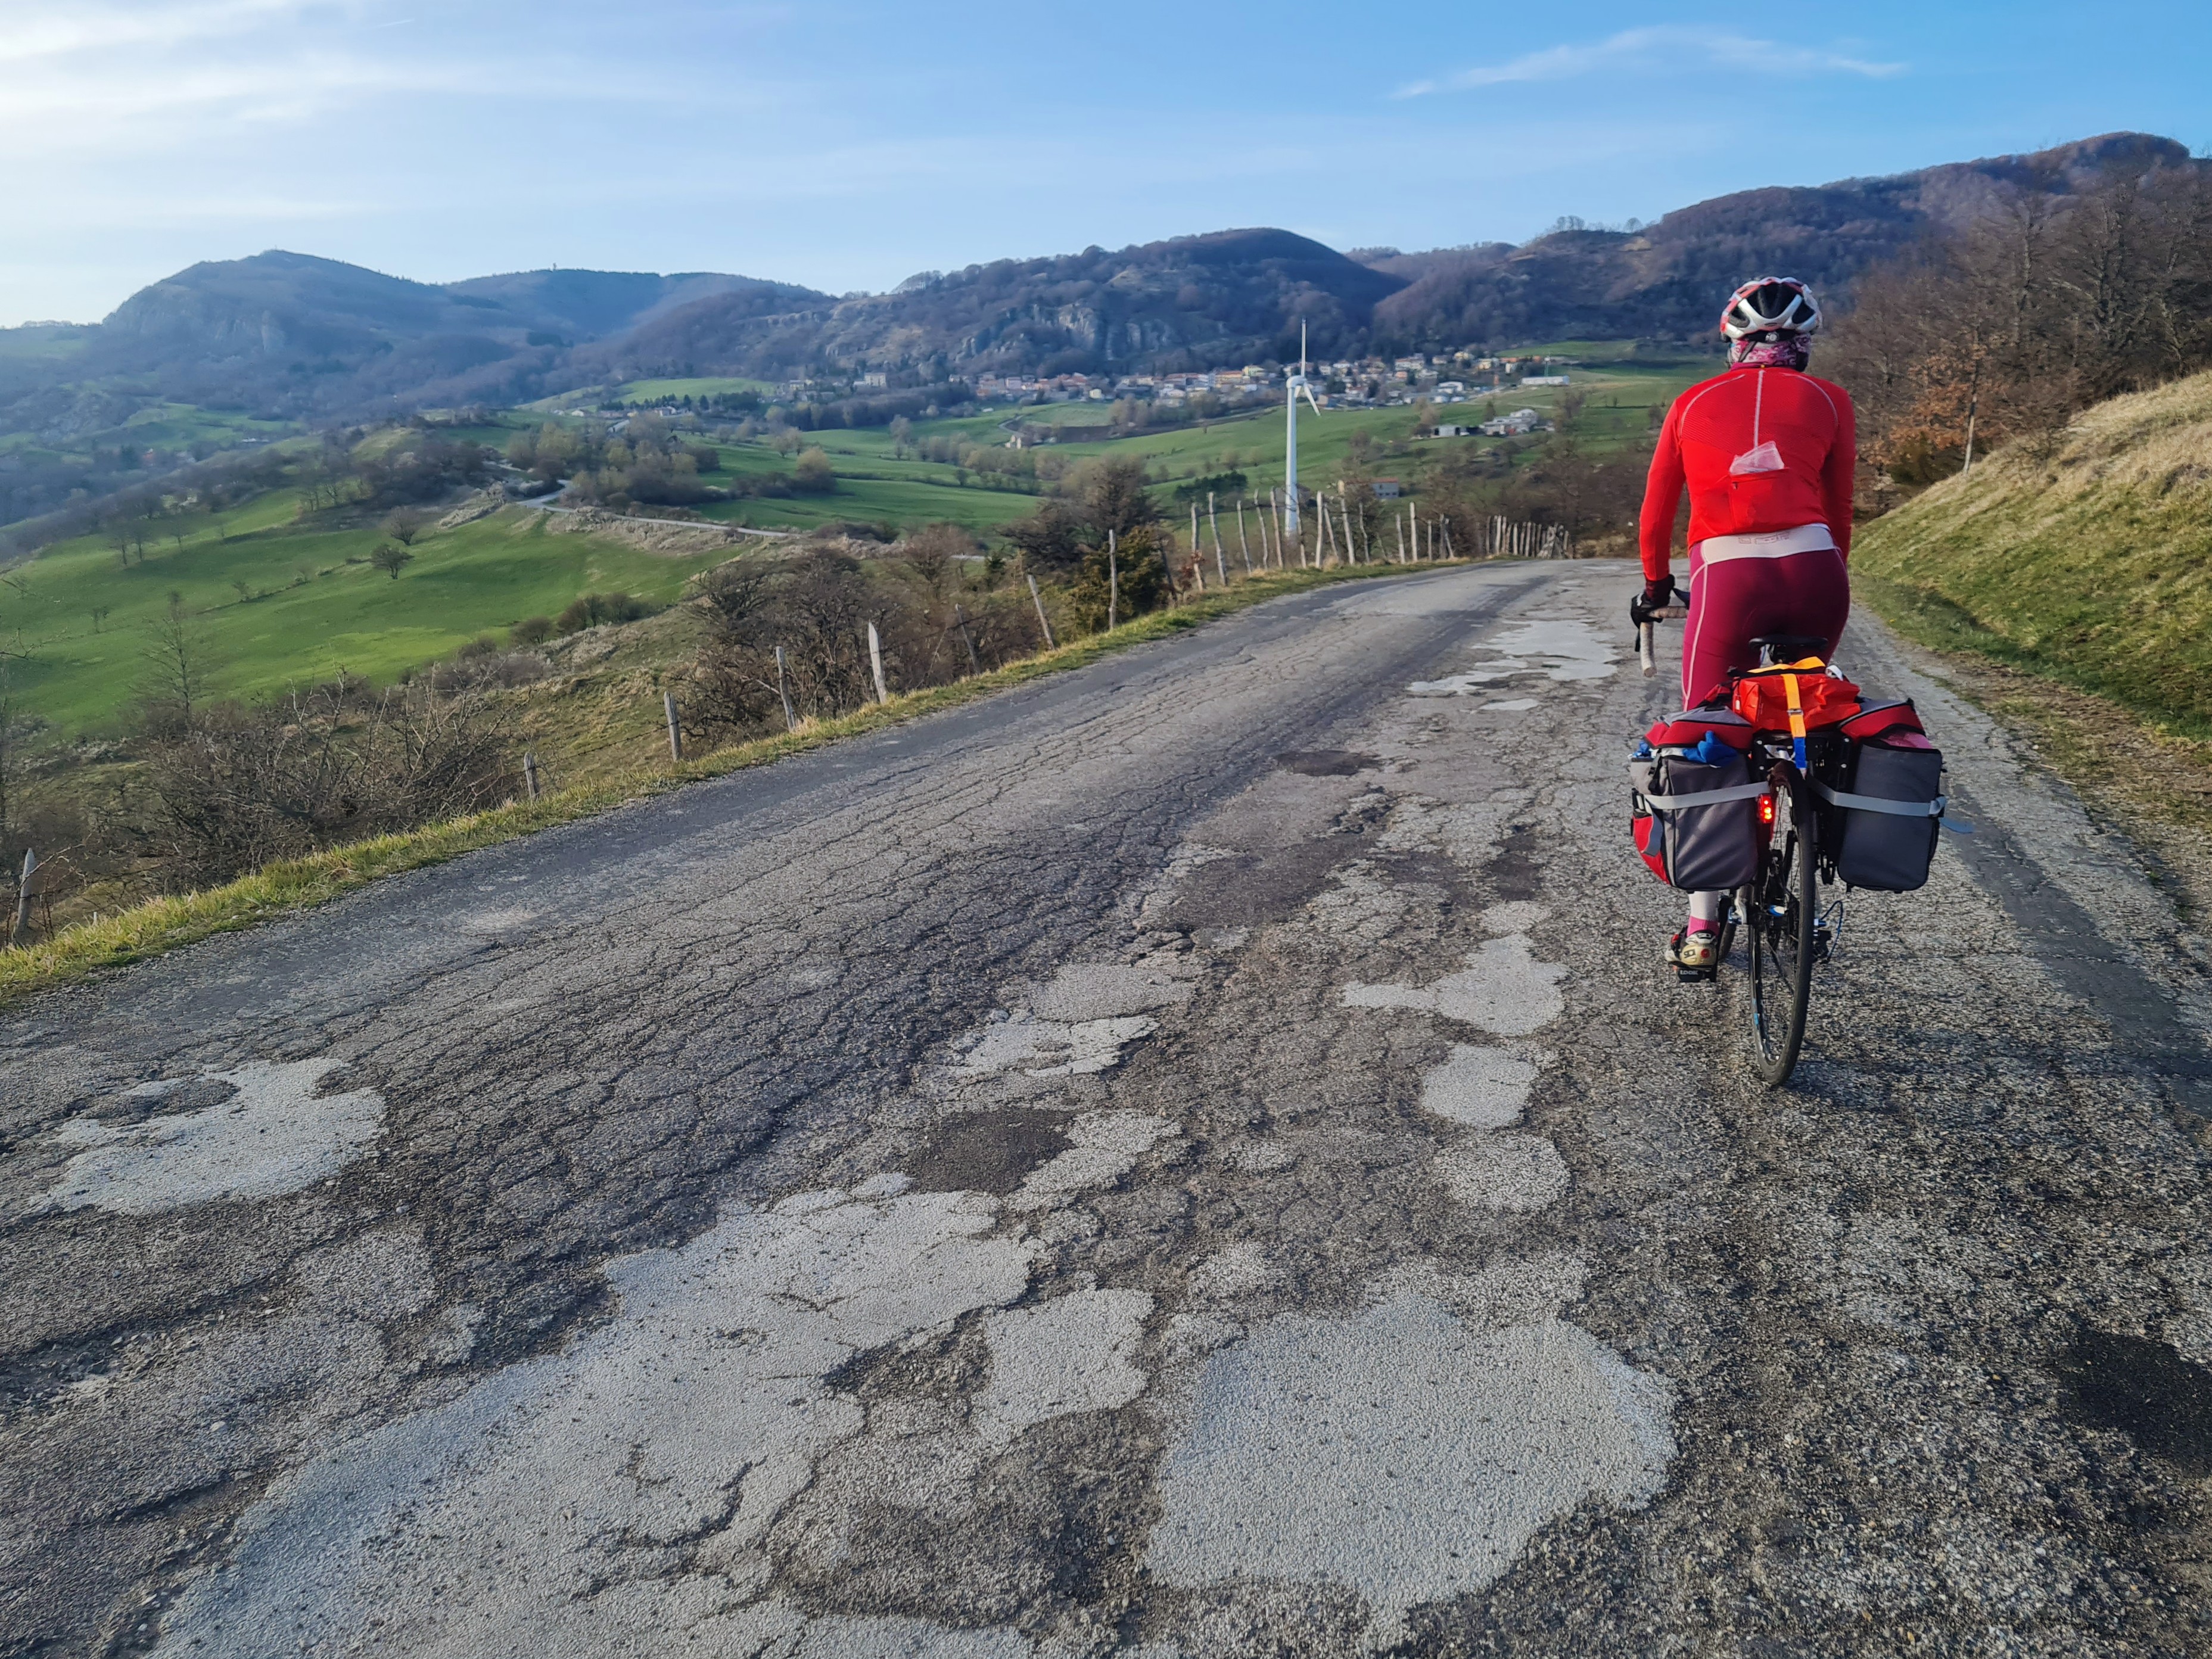
| Asphalt 😋 |
-
🛣️ #5 Map with asphalt quality.
- What a pleasure it is to road cycle on smooth asphalt, without any irregularities! 🤗
- In contrast, it can be uncomfortable, energy-consuming, and attention-demanding to deal with a road full of cracks. 😵💫
- Idea: activity trackers, e.g.
garmin, could record and analyse the vibrations during a road-cycling activity, in order to accordingly evaluate the smoothness of each road.
-
🤹 #6 Embed multiple options inside one single
.gpx, in order for the user to decide during the activity which alternative to follow.komootoffers some features formid-Tour route adjustments, but the alternative plan is not prepared in advance.- Idea: one possible solution is to incorporate all the alternatives into a single route, this may affect the route summary (
elevation,distance) though.
-
🍝 #7 Miscellaneous.
- 🚵 Mountain-bike filter for
strava-global-heatmap.- [2024.05] Now available 🥳. Together with other filters such as
Gravel RideandE-Mountain Bike Ride. - For some regions, these filters provide an empty heatmap despite a high volume of traffic: most
stravausers probably do not specify the activity type and the default setting (Ride) is applied. - It would be nice to be able to apply multiple filters. For instance
Gravel RideANDMountain Bike Ride.
- [2024.05] Now available 🥳. Together with other filters such as
- 🌗 A map showing shaded areas based on a date and time.
🅿️ A reliable map of car parks (near your tour starting point).- 🐷 One way of answering the question: "Is this trail usually muddy?"
- Together with trail reviews, some information can help to give a rough estimate: exposure to the sun (shaded or exposed area), presence of springs or small streams and type of trail surface.
- 🌧️ The amount of precipitation that has fallen in a region in the last few days (e.g. in the last 72 hours).
- Either as a map or as a number.
- To be able to estimate how muddy paths can be.
- 🚰 A map showing free drinking water sources.
- Some are already marked in
komootas "highlight".
- Some are already marked in
- 🚵 Mountain-bike filter for
Please share yours ideas, especially regarding the still missing section:
- ✍️ Either using ➡️ this simple formular ⬅️ (entries are collected in this sheet).
 Or via GitHub discussion (requires a GitHub account).
Thank you in advance for your contributions. 🙏
A couple of final suggestions from my side:
- 🤩 Do not check every detail in advance; leave room for surprise and wonder.
- 🐑
strava-global-heatmapis a fantastic tool, but do not become a mouton de Panurge, i.e. one sheep who follows a group without thinking for himself. - ⛑️ Safety first. Agree to turn back and abandon your plan if the situation becomes too dangerous.
- 🥳 A
planmust stay aplan: feel free to improvise while on the terrain.
I hope you enjoyed reading this page, and could learn something.
Happy planning, but above all happy outdoor activity! 😃
Simon
