Disclaimer
This package is a work in progress. It has been released to get feedback from users that we can incorporate in future releases.
The goal of incidenceflow is to provide tidy workflows using
incidence and EpiEstim with tidyverse and purrr.
if(!require("remotes")) install.packages("remotes")
remotes::install_github("avallecam/incidenceflow")Here are two basic examples which shows you how to solve common problems:
library(incidenceflow)
## basic example codeget_info_tidy: generates a tibble ofincidence::get_info(). click here for more information.tidy_incidence: generates a complete summary tibble from incidence fit paramteter estimatesglance_incidence: generates a complete summary tibble from incidence fit model performance
# packages ----------------------------------------------------------------

if(!require("devtools")) install.packages("devtools")
# if(!require("avallecam")) devtools::install_github("avallecam/avallecam") #improvements

library(tidyverse) #magrittr and purrr packages
library(lubridate) #ymd
library(outbreaks) #sample data
library(incidence) #core functions

# example outbreak --------------------------------------------------------

dat <- ebola_sim$linelist$date_of_onset
i.7 <- incidence(dat, interval=7)
# plot(i.7)
f1 <- fit(i.7[1:20])
f2 <- fit_optim_split(i.7)

# broom like functions ----------------------------------------------------

# tidy
f1 %>% tidy_incidence()
#> # A tibble: 2 x 5
#>   mark  parameter estimate conf_lower conf_upper
#>   <chr> <chr>        <dbl>      <dbl>      <dbl>
#> 1 1     r           0.0318     0.0260     0.0376
#> 2 1     doubling   21.8       18.5       26.7
f2 %>% pluck("fit") %>% tidy_incidence()
#> # A tibble: 4 x 5
#>   mark   parameter estimate conf_lower conf_upper
#>   <chr>  <chr>        <dbl>      <dbl>      <dbl>
#> 1 before r           0.0298     0.0261    0.0336
#> 2 after  r          -0.0102    -0.0110   -0.00930
#> 3 before doubling   23.2       20.7      26.6
#> 4 after  halving    68.2       62.9      74.5

# glance
f1 %>% glance_incidence()
#> # A tibble: 1 x 11
#>   r.squared adj.r.squared sigma statistic  p.value    df logLik   AIC   BIC
#>       <dbl>         <dbl> <dbl>     <dbl>    <dbl> <int>  <dbl> <dbl> <dbl>
#> 1     0.880         0.874 0.498      133. 9.81e-10     2  -13.4  32.8  35.7
#> # ... with 2 more variables: deviance <dbl>, df.residual <int>
f2 %>% pluck("fit") %>% glance_incidence()
#> # A tibble: 2 x 12
#>   names r.squared adj.r.squared sigma statistic  p.value    df logLik   AIC
#>   <chr>     <dbl>         <dbl> <dbl>     <dbl>    <dbl> <int>  <dbl> <dbl>
#> 1 befo~     0.922         0.919 0.455      273. 2.95e-14     2  -14.8  35.5
#> 2 after     0.951         0.949 0.155      578. 3.72e-21     2   15.4 -24.8
#> # ... with 3 more variables: BIC <dbl>, deviance <dbl>, df.residual <int>


# using purrr -------------------------------------------------------------

# using purrr::map family function allows easy stratification
# for gender and could be extrapolated to administrative levels
# in country level analysis

incidence_purrr <- ebola_sim$linelist %>%
  as_tibble() %>%
  #filter observations explicitly before incidence()
  filter(date_of_onset<lubridate::ymd(20141007)) %>%
  #stratify by any group of covariates
  group_by(gender) %>%
  nest() %>%
  mutate(incidence_strata=map(.x = data,
                              .f = ~incidence(.x %>% pull(date_of_onset),
                                              interval=7))) %>%
  mutate(strata_fit=map(.x = incidence_strata,
                        .f = possibly(fit,NA_real_)
                        )) %>%
  mutate(strata_fit_tidy=map(.x = strata_fit,
                                  .f = possibly(tidy_incidence,tibble()))) %>%
  mutate(strata_fit_glance=map(.x = strata_fit,
                                       .f = possibly(glance_incidence,tibble())))

# keep only the tibbles
incidence_purrr_tibble <- incidence_purrr %>%
  select(-data,-incidence_strata,-strata_fit)

# tidy_incidence output
incidence_purrr_tibble %>%
  unnest(cols = c(strata_fit_tidy))
#> # A tibble: 4 x 7
#> # Groups:   gender [2]
#>   gender mark  parameter estimate conf_lower conf_upper strata_fit_glance
#>   <fct>  <chr> <chr>        <dbl>      <dbl>      <dbl> <list>
#> 1 f      1     r           0.0228     0.0189     0.0267 <tibble [1 x 11]>
#> 2 f      1     doubling   30.3       25.9       36.6    <tibble [1 x 11]>
#> 3 m      1     r           0.0241     0.0188     0.0294 <tibble [1 x 11]>
#> 4 m      1     doubling   28.7       23.6       36.8    <tibble [1 x 11]>

# glance_incidence output
incidence_purrr_tibble %>%
  unnest(cols = c(strata_fit_glance))
#> # A tibble: 2 x 13
#> # Groups:   gender [2]
#>   gender strata_fit_tidy r.squared adj.r.squared sigma statistic  p.value
#>   <fct>  <list>              <dbl>         <dbl> <dbl>     <dbl>    <dbl>
#> 1 f      <tibble [2 x 5~     0.859         0.853 0.510     146.  1.05e-11
#> 2 m      <tibble [2 x 5~     0.795         0.786 0.657      89.0 2.26e- 9
#> # ... with 6 more variables: df <int>, logLik <dbl>, AIC <dbl>, BIC <dbl>,
#> # deviance <dbl>, df.residual <int># install package
if(!require("remotes")) install.packages("remotes")
remotes::install_github("avallecam/incidenceflow")
# install learner and run tutorial
if(!require("learnr")) install.packages("learnr")
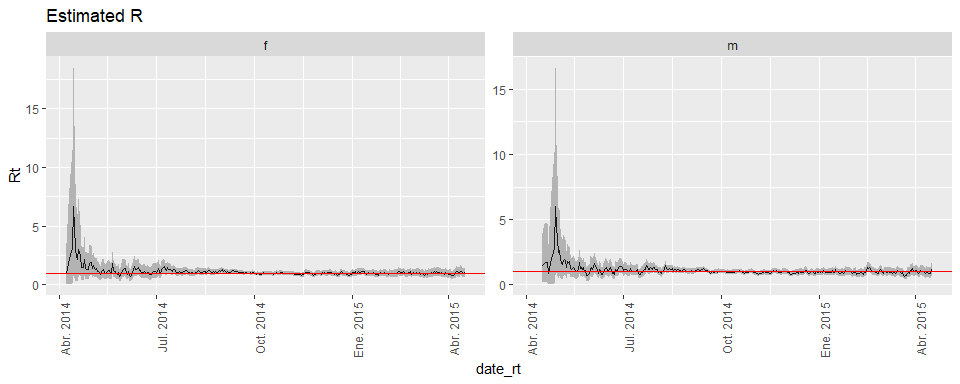
learnr::run_tutorial(name = "taller",package = "incidenceflow")create_nest_dynamics: estimate Rt per stratacreate_nest_summary: create figure and tables of incidence and Rt
linelist_raw <- ebola_sim$linelist %>%
  as_tibble() %>%
  #filter observations explicitly before incidence()
  # filter(date_of_onset<lubridate::ymd(20141007)) %>%
  mutate(all="all")

dictionary <- linelist_raw %>%
  count(all,gender) %>%
  rownames_to_column(var = "code")

# linelist_raw %>%
#   group_by(gender) %>%
#   skimr::skim()
time_delay_set = 7
#### execute -------------------------------
nest_dynamics <- create_nest_dynamics(linelist = linelist_raw,
dictionary = dictionary,
strata_major = all,
strata_minor = gender,
strata_minor_code = code, # unico para diccionario
date_incidence_case = date_of_onset,
date_of_analysis_today=FALSE,
issue_number_set = 0)
nest_dynamics #nest_dynamics %>% glimpse()
#> # A tibble: 2 x 19
#> strata_major strata_minor strata_minor_co~ data n_pre_clean n_pos_clean
#> <chr> <fct> <chr> <lis> <int> <int>
#> 1 all f 1 <tib~ 2962 2962
#> 2 all m 2 <tib~ 2926 2926
#> # ... with 13 more variables: one_incidence_tidy <list>,
#> # one_incidence_glance <list>, date_split_peak <date>,
#> # date_firstone <date>, date_lastone <date>, date_lastlag_days <date>,
#> # incidence_fit_figure <list>, tsibble_rt <list>, current_rt <list>,
#> # last5wk_rt <list>, rt_figure <list>, tsibble_day <list>,
#> # tsibble_wik <list>#### nested figures -------------------------------
nest_summary <- create_nest_summary(nest_dynamics = nest_dynamics,
time_limit_fig02 = Inf)
nest_summary #%>% glimpse()
#> # A tibble: 1 x 9
#> strata_major data fig01 fig02 fig03 tab01 tab02 tab03 tab04
#> <chr> <list> <list> <list> <lis> <list> <list> <list> <list>
#> 1 all <tibble~ <gg> <gg> <gg> <tibbl~ <tibbl~ <tibbl~ <tibbl~#### if a shapefile is available ----------------------
# nest_summary <- create_nest_summary_map(nest_dynamics = nest_dynamics,
# geometry = ubigeo_geometria_per2,
# strata_major=nm_pais,
# strata_minor=nm_depa)region_name <- "all"
nest_summary %>%
filter(strata_major==region_name) %>%
pull(fig01) %>% pluck(1)nest_summary %>%
filter(strata_major==region_name) %>%
pull(fig02) %>% pluck(1)nest_summary %>%
filter(strata_major==region_name) %>%
pull(fig03) %>% pluck(1)# nest_summary %>%
# filter(strata_major==region_name) %>%
# pull(fig04) %>% pluck(1)
nest_summary %>%
filter(strata_major==region_name) %>%
pull(tab01) %>% pluck(1)
#> # A tibble: 8 x 8
#> strata_minor strata_minor_co~ mark parameter estimate conf_lower
#> <fct> <chr> <chr> <chr> <dbl> <dbl>
#> 1 f 1 befo~ growth_r~ 0.0212 0.0194
#> 2 f 1 after growth_r~ -0.00958 -0.0104
#> 3 f 1 befo~ doubling 32.7 30.2
#> 4 f 1 after halving 72.3 66.8
#> 5 m 2 befo~ growth_r~ 0.0214 0.0195
#> 6 m 2 after growth_r~ -0.0101 -0.0111
#> 7 m 2 befo~ doubling 32.3 29.7
#> 8 m 2 after halving 68.4 62.4
#> # ... with 2 more variables: conf_upper <dbl>, date_split_peak <date>
nest_summary %>%
filter(strata_major==region_name) %>%
pull(tab02) %>% pluck(1)
#> # A tibble: 4 x 6
#> strata_minor strata_minor_code names r.squared adj.r.squared p.value
#> <fct> <chr> <chr> <dbl> <dbl> <dbl>
#> 1 f 1 before 0.800 0.798 2.32e-50
#> 2 f 1 after 0.735 0.734 2.39e-61
#> 3 m 2 before 0.790 0.788 1.56e-46
#> 4 m 2 after 0.673 0.672 6.03e-51
nest_summary %>%
filter(strata_major==region_name) %>%
pull(tab03) %>% pluck(1)
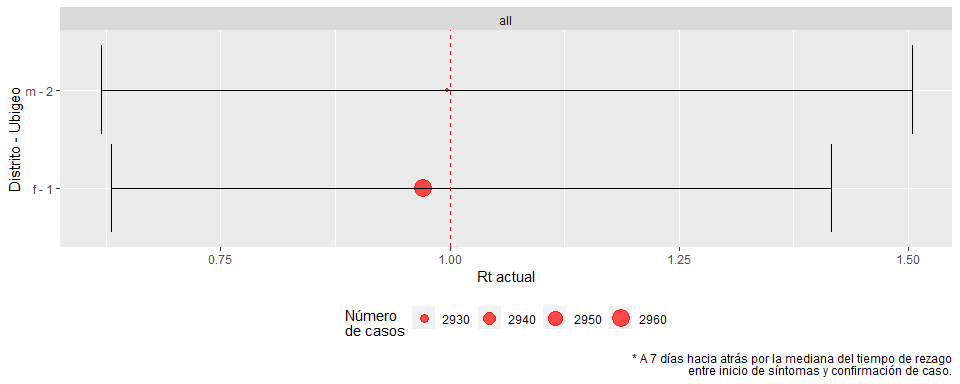
#> # A tibble: 2 x 6
#> strata_minor strata_minor_co~ date_rt rt_estimate rt_conf.lower
#> <fct> <chr> <date> <dbl> <dbl>
#> 1 f 1 2015-04-17 0.971 0.631
#> 2 m 2 2015-04-17 0.997 0.619
#> # ... with 1 more variable: rt_conf.upper <dbl>
nest_summary %>%
filter(strata_major==region_name) %>%
pull(tab04) %>% pluck(1)
#> # A tibble: 2 x 7
#> strata_minor strata_minor_co~ `2015-W11` `2015-W12` `2015-W13` `2015-W14`
#> <fct> <chr> <chr> <chr> <chr> <chr>
#> 1 f 1 1.03(0.71~ 0.99(0.68~ 0.93(0.62~ 0.97(0.62~
#> 2 m 2 0.95(0.65~ 0.88(0.55~ 1.04(0.69~ 0.97(0.62~
#> # ... with 1 more variable: `2015-W15` <chr>-
on incidence: https://github.com/reconhub/incidence2
-
on time-varying transmission: https://epiforecasts.io/EpiNow2/
- Document functions


