A very limited R package for mapping daily changes in the number of
COVID-19 cases. It uses daily data from the Johns Hopkins University
COVID-19 repository, and
adapts code from Rami Krispin’s
coronavirus package
(which has a very nice interactive, global dashboard) and from several
surrounding states. The focus of this is to highlight regional changes
around a focal point, in this case Worcester, MA, the home of Clark
University. It also tries to show county-level detail available in state
datasets.
Last update: 2020-11-12 06:58:12
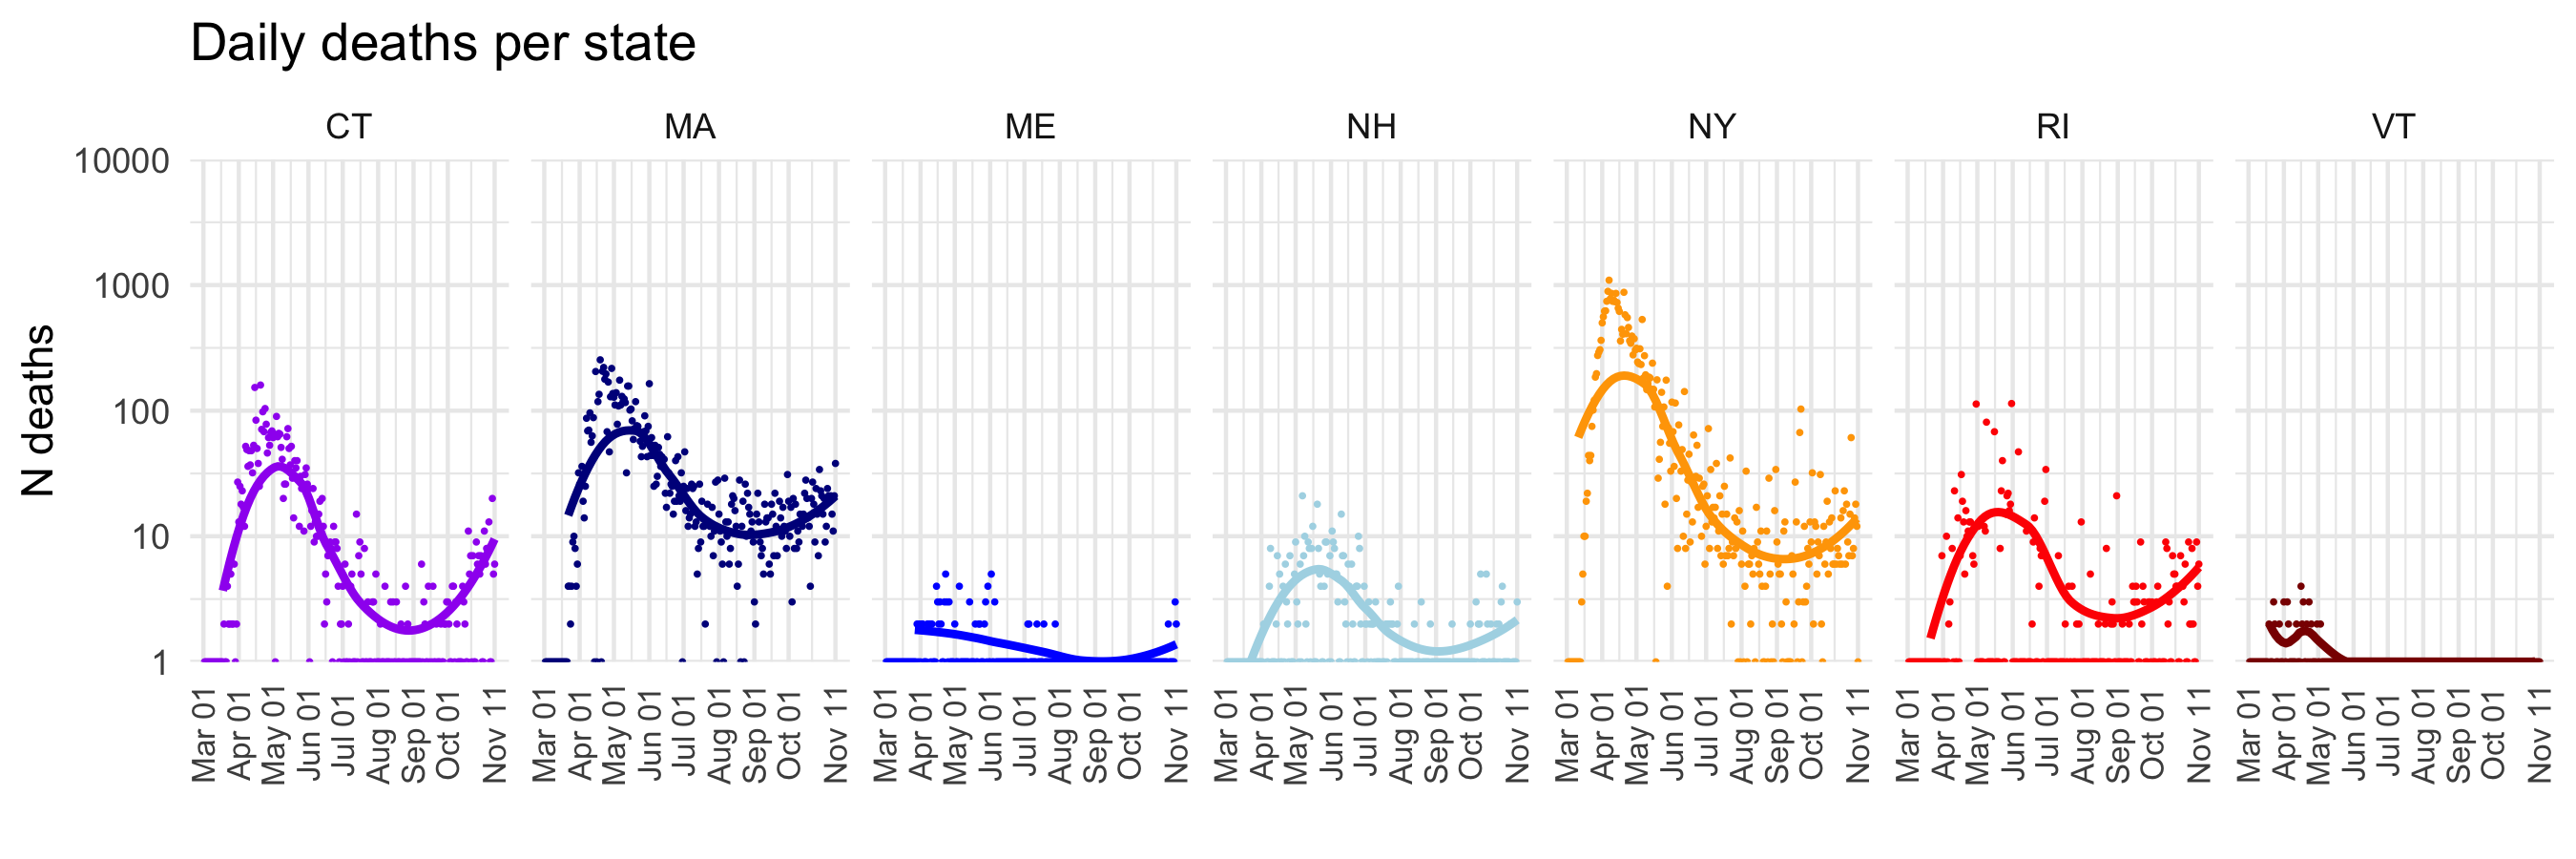
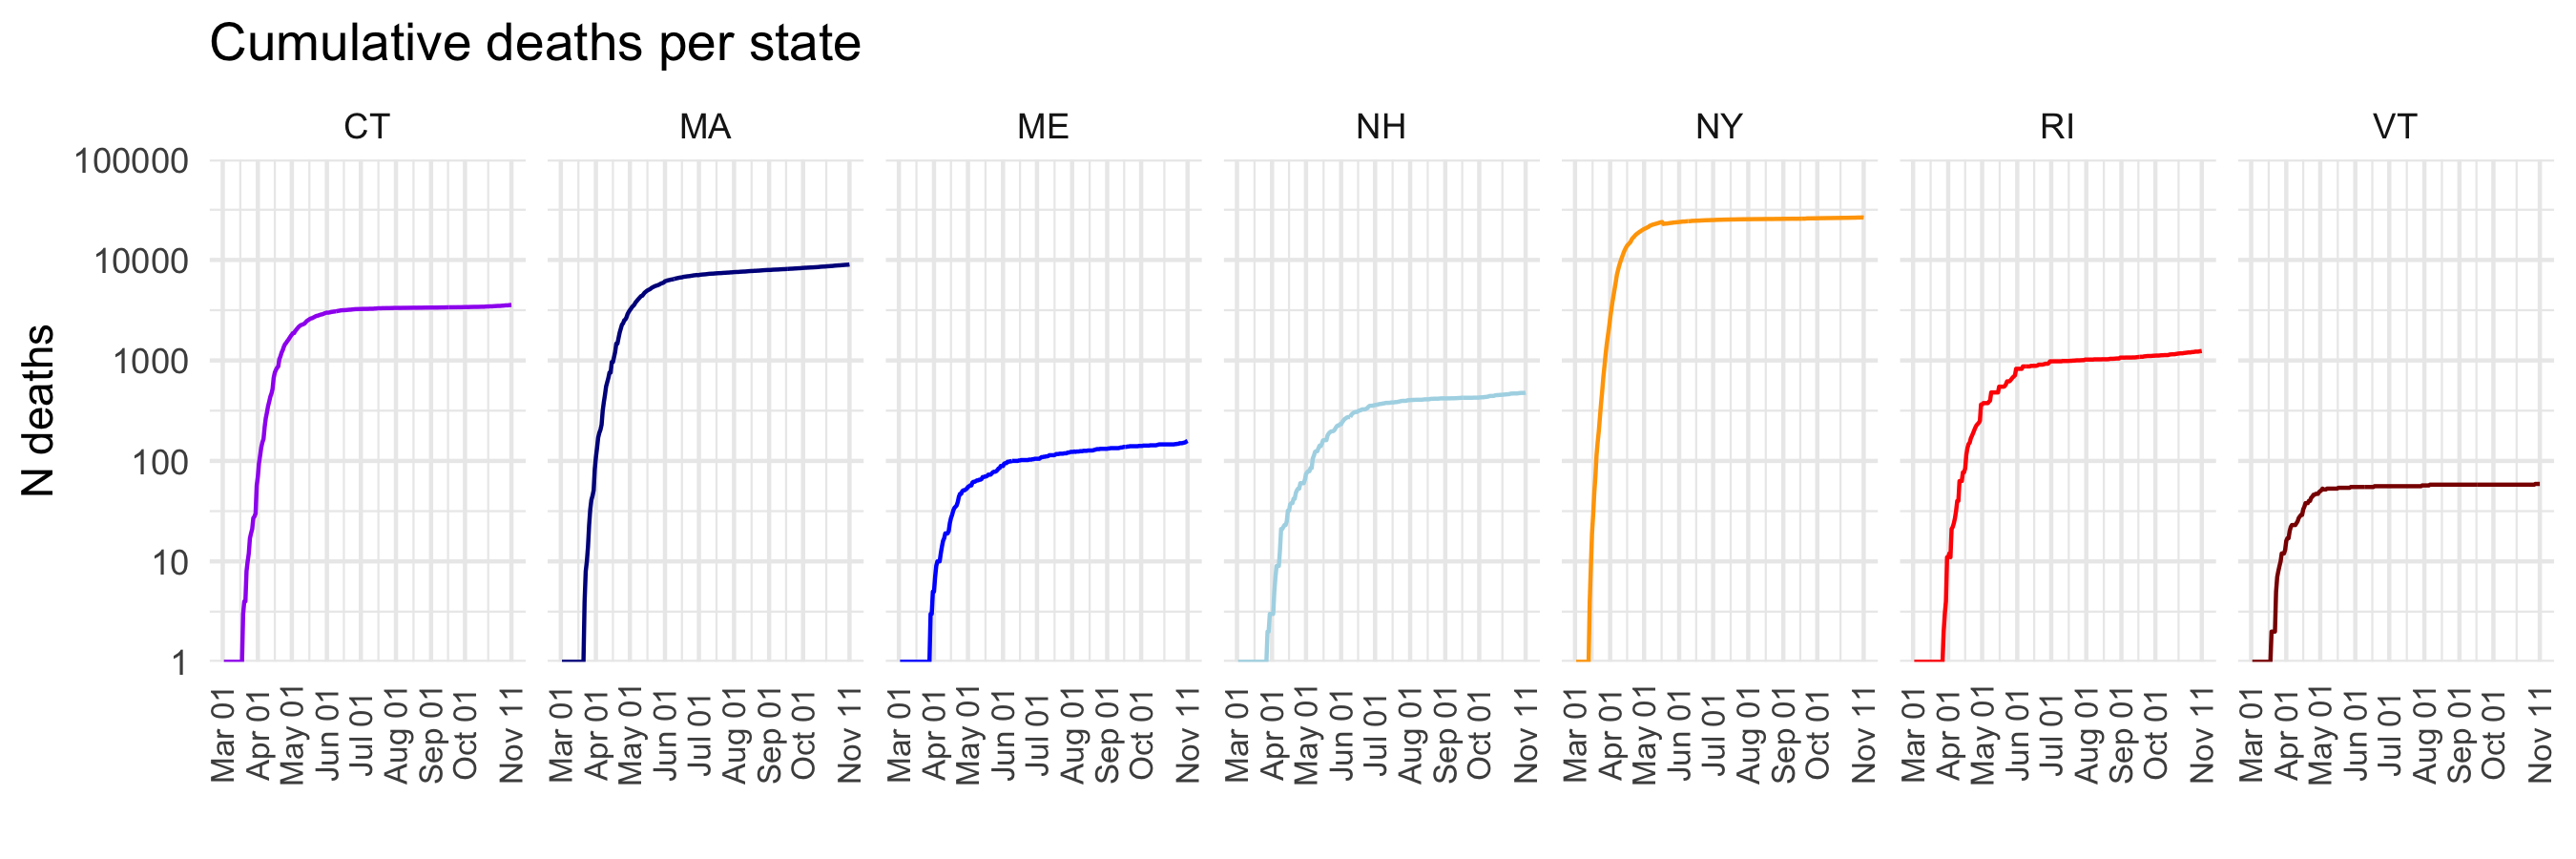
Update 6 July 2020:
- Switched back to using JHU daily time series data for US, which now includes counties
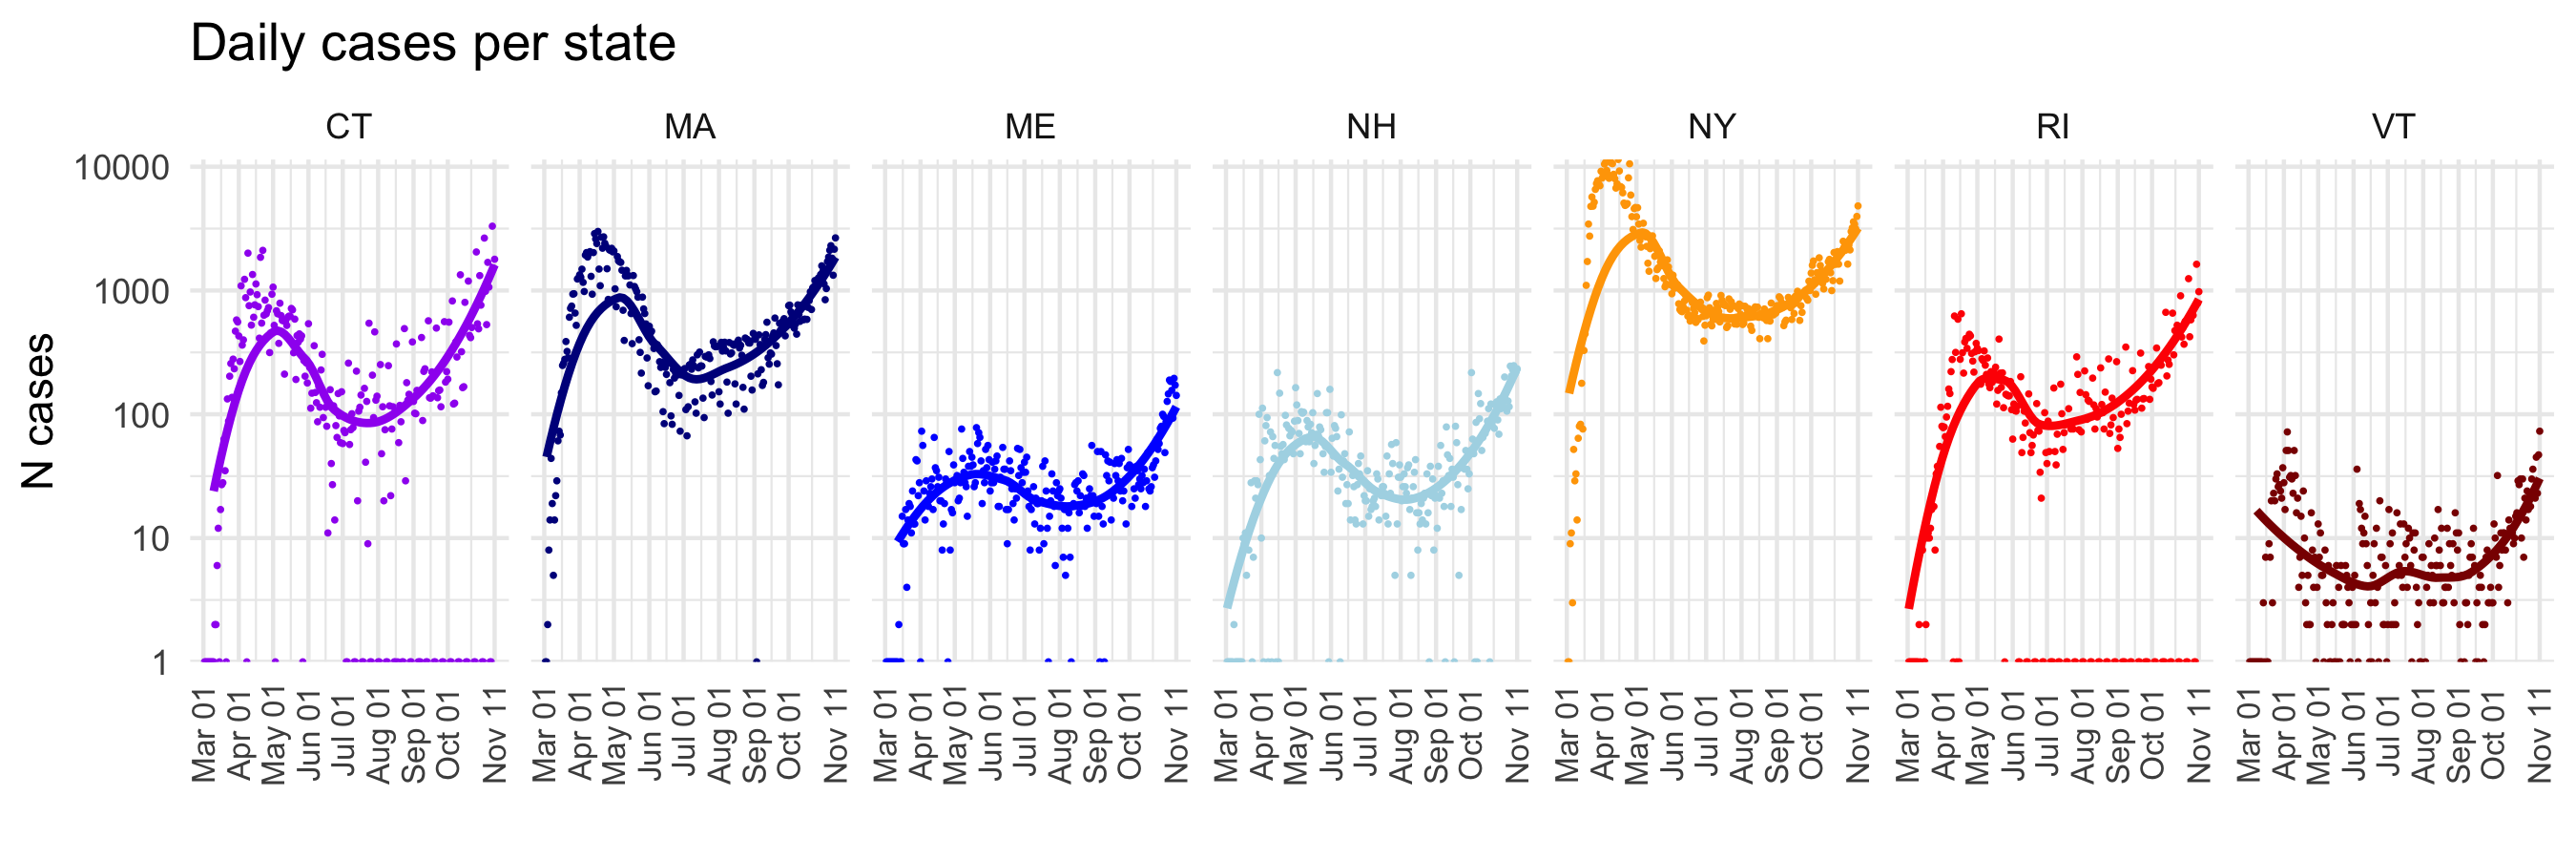
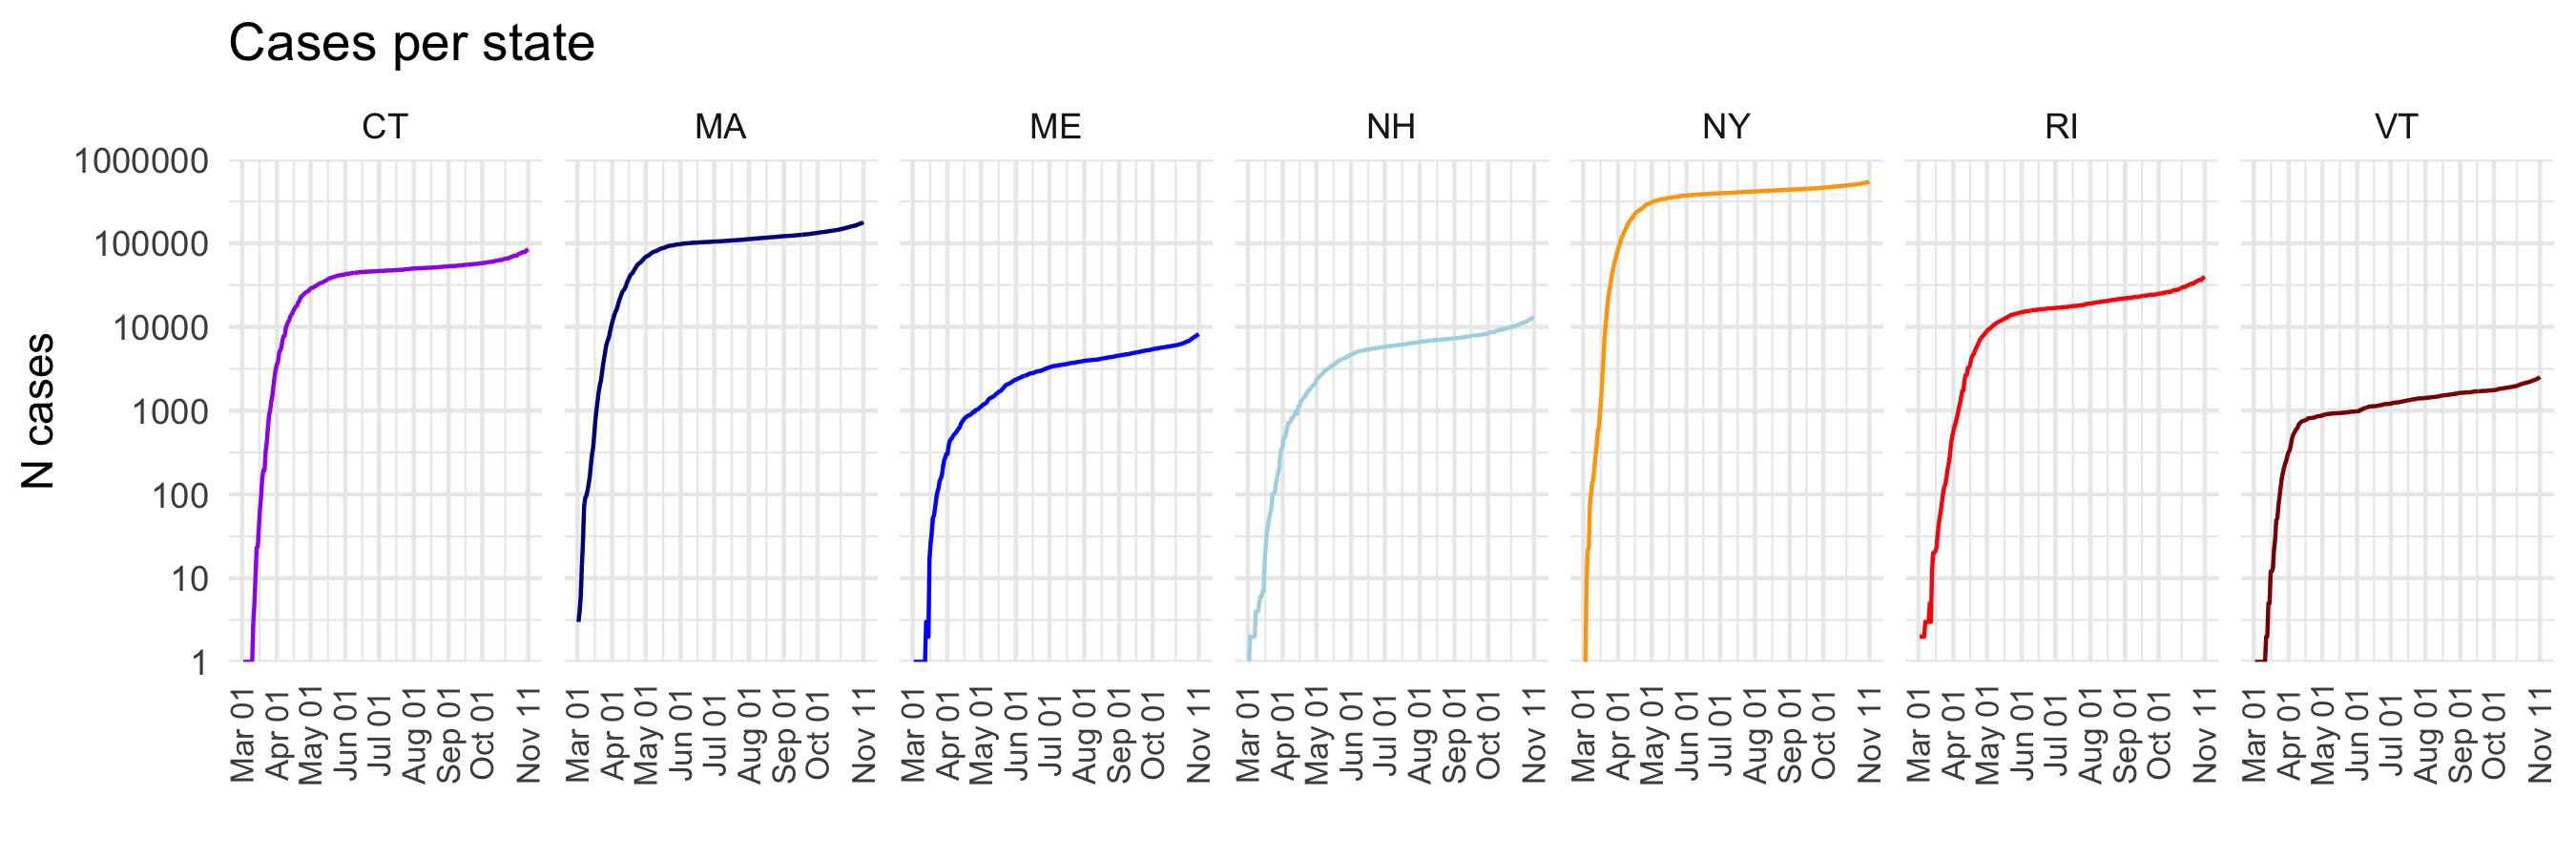
- Time series plots now separate out states into individual panels
- Daily cases added alongside cumulative cases, albeit with some noise
Updates 6 April 2020:
- Function added to process US cases and merge with US census data
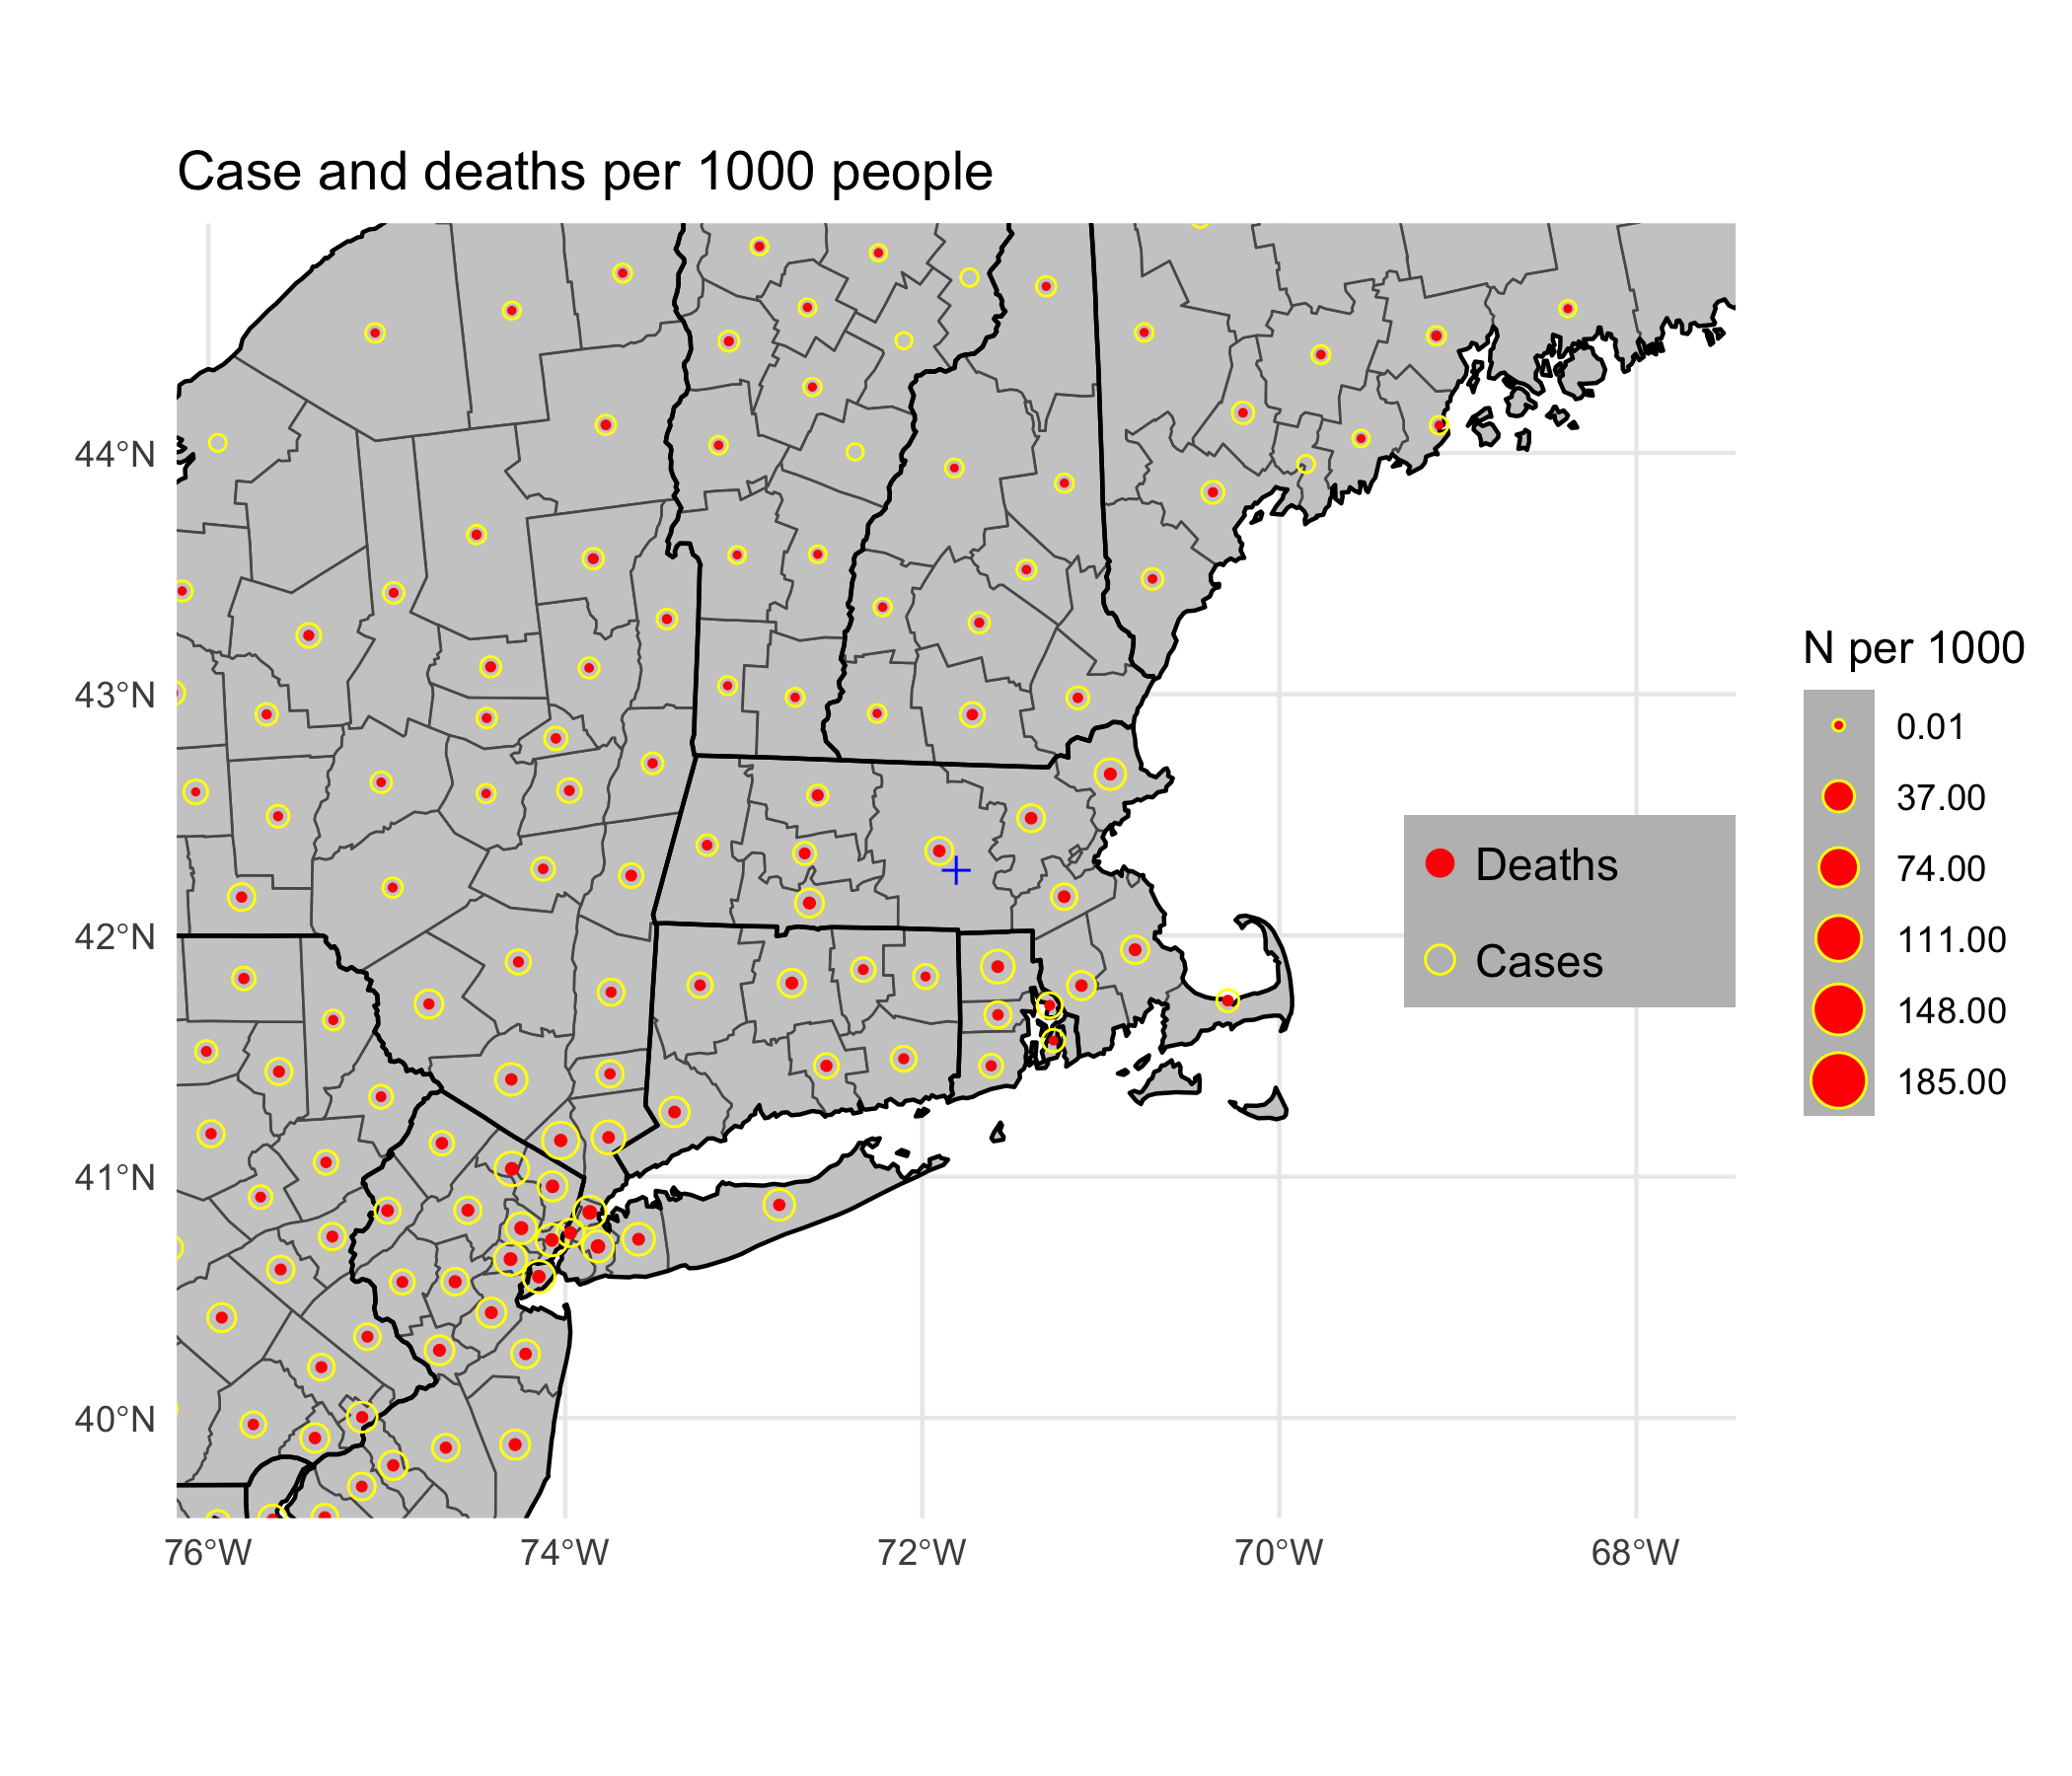
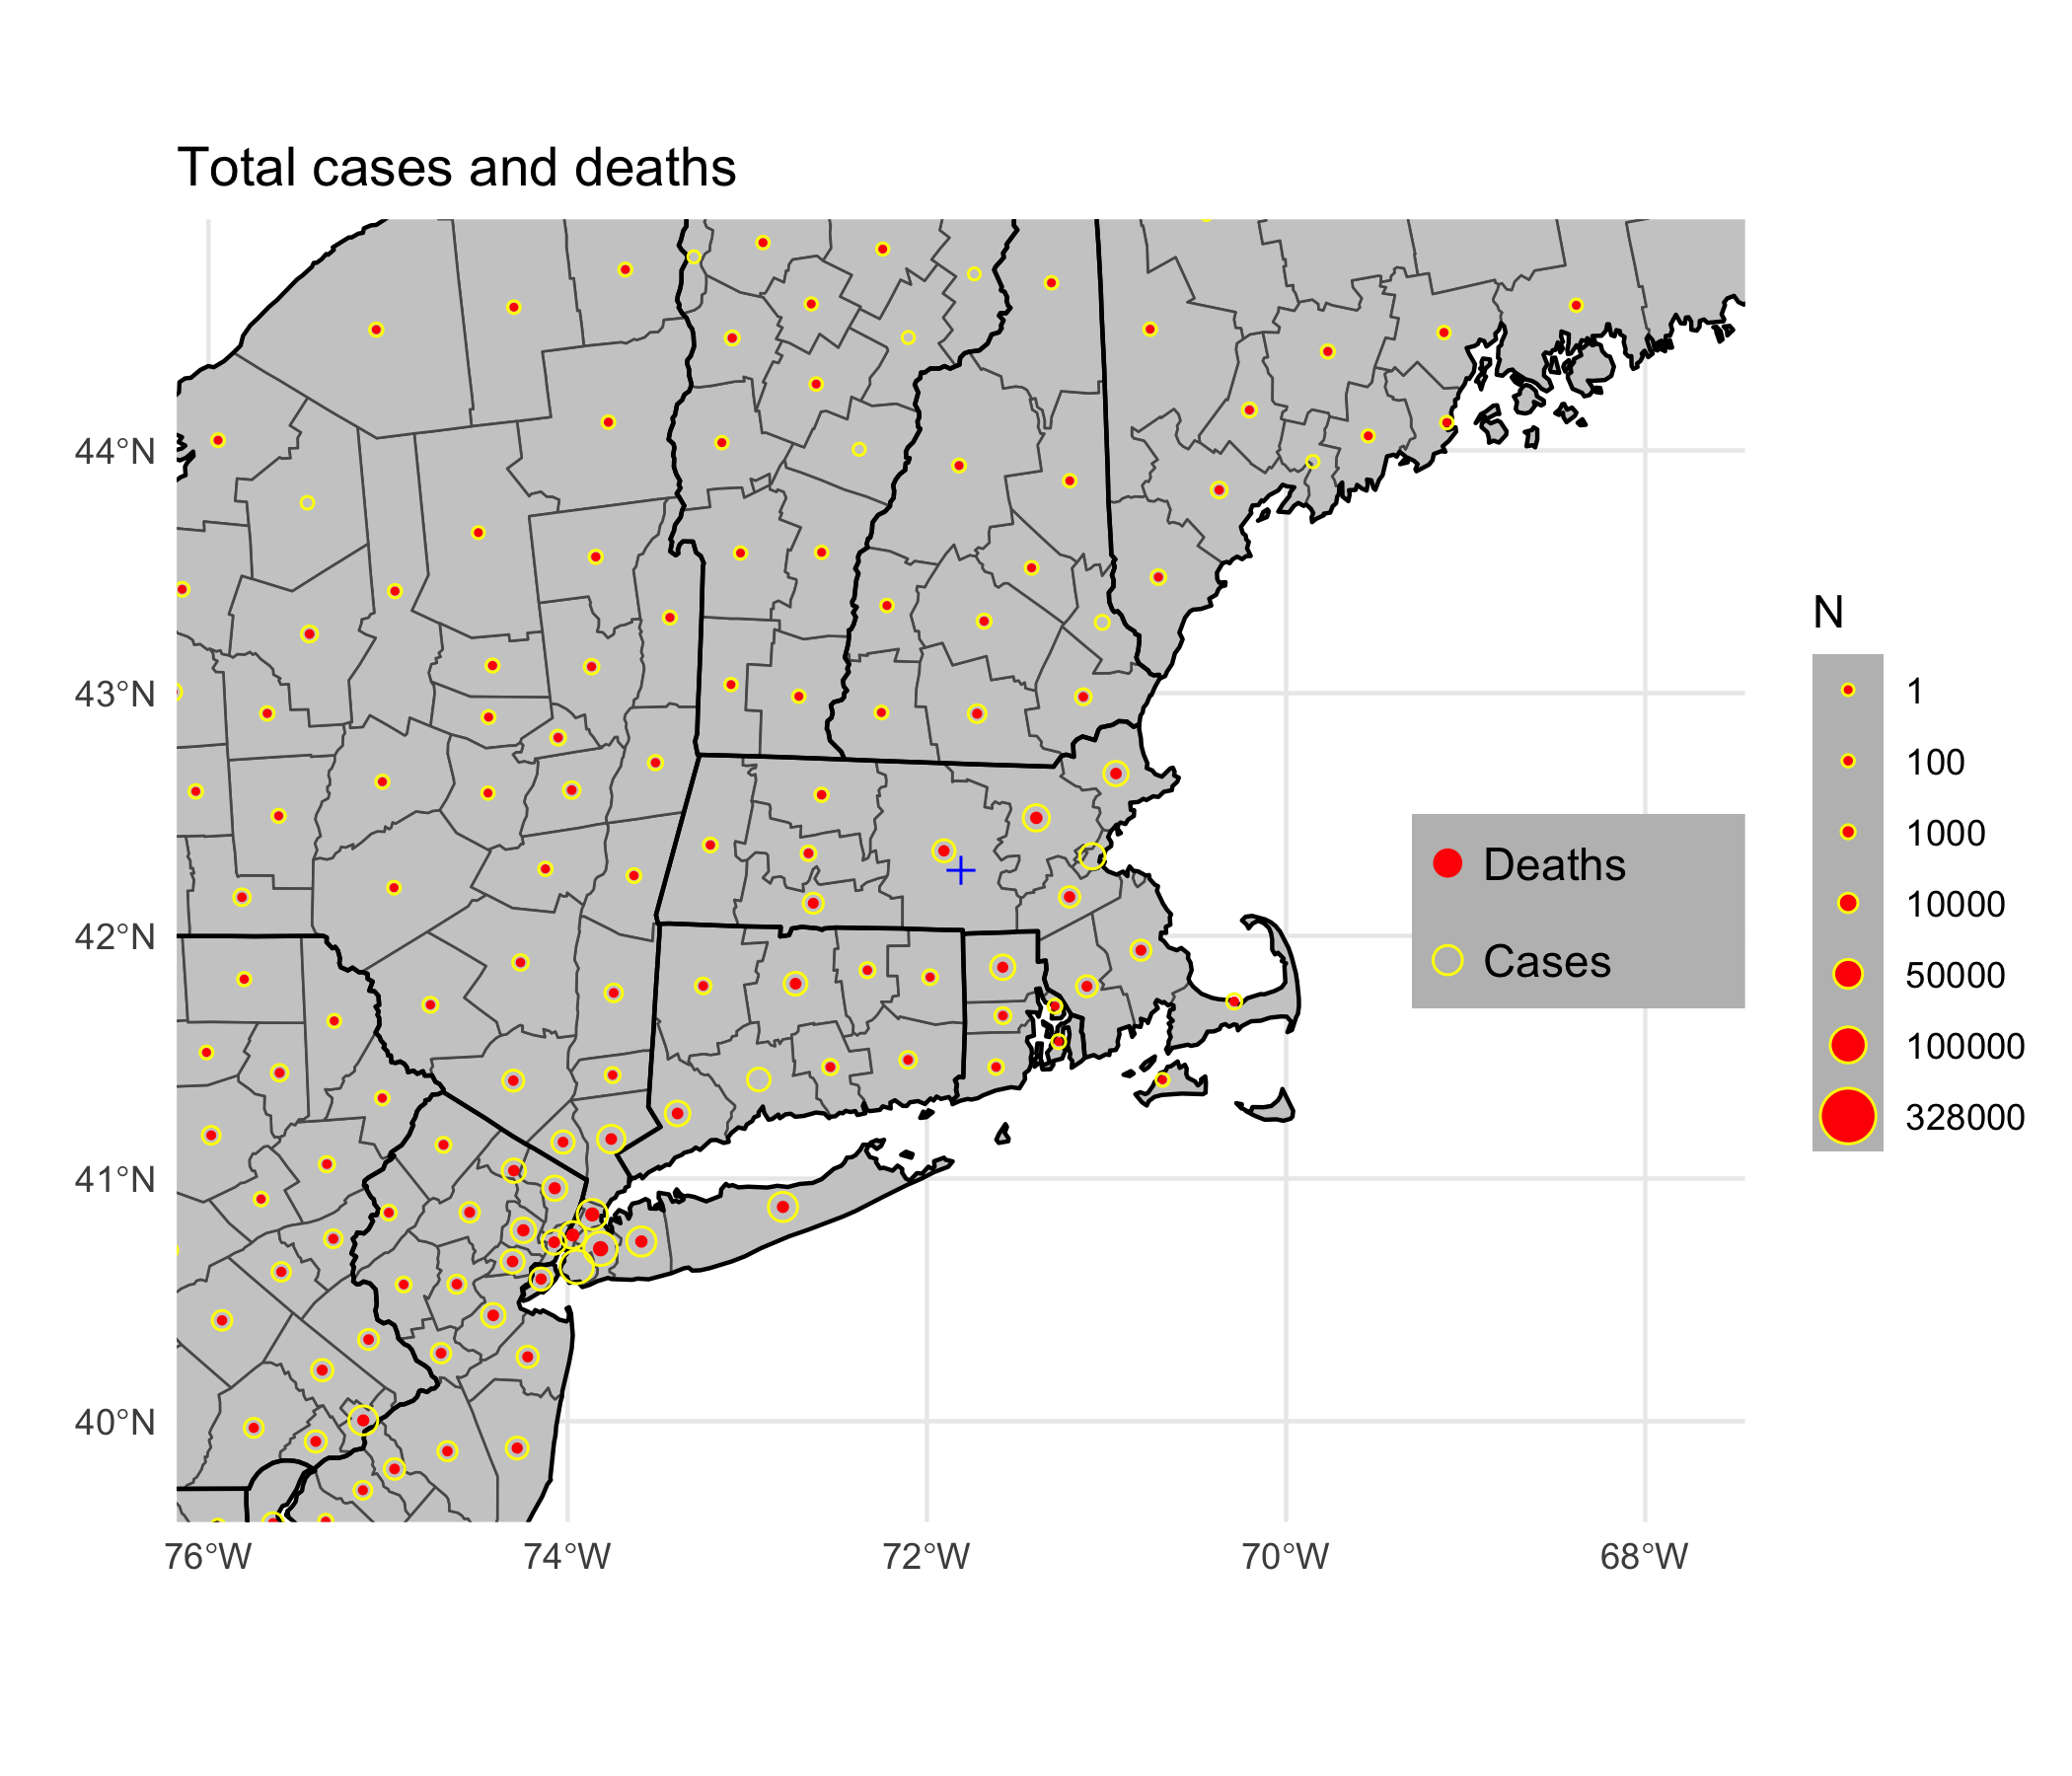
- Maps now presented for cases and deaths, as N per 1000 people and total numbers
- State-wise cases and deaths presented on log 10 scale
Updates 26 March 2020:
- Switched to read JHU daily reports exclusively. JHU time series now only summarizes for country level as of 22/3, per notice. These data are in a different format prior to 22/3. The earlier parts of the time series jump around more than in previous versions.
- New function added to read data from daily reports
- Dropped plot of regionalized rates of increases. Added plot of deaths per state.
Updates 23 March 2020:
- Daily city/county/admin 2 level are now being read in from the web-data branch of the JHU repo.
- Time series data are now processed from the state-level JHU data only. County-level data are used only for mapping.
- I am not an epidemiologist, so this information should not be taken as authoritative. There may be flaws in the code or data handling that give rise to misleading results.
- If the map is correct, it is nevertheless misleading in that the number of cases is almost certainly an underestimate, as US testing has been very limited. This statement should be uncontroversial. To support that claim, here is the CDC’s page on testing rates. Here is a comparison of the US testing rate relative to other countries.
If you want to see the vignette and plot using data from the most recent commit:
devtools::install_github(build_vignettes = TRUE)