Upcoming changes in time series tables
CSSEGISandData opened this issue · comments

We will update the time series tables in the following days, aiming to provide a cleaner and more organized dataset consistent with our new/current naming convention. We will also be reporting a new variable (i.e, testing), as well as data at the county level for the US. All files will continue to be updated daily around 11:59PM UTC.
The followiing specific changes will be made:
-
Three new time series tables will be added for the US. The first two will be the confirmed cases and deaths, reported at the county level. The third, number of tests conducted, will be reported at the state level. These new tables will be named
time_series_covid19_confirmed_US.csv,time_series_covid19_deaths_US.csv,time_series_covid19_testing_US.csv, respectively. -
Changes to the current time series include the removal of the US state and county-level entries, which will be replaced with a new single country level entry for the US. The tables will be renamed
time_series_covid19_confirmed_global.csvandtime_series_covid19_deaths_global.csv, andtime_series_covid19_testing_global.csv, respectively. -
The ISO code will be added in the global time series tables.
-
The FIPS code will be added in the new US time series tables.
-
We will no longer provide recovered cases.
-
The current set of time series files will be moved to our archive folder, and the new files will be added to the current folder.
Thanks!
Update: time_series_covid19_recovered_global.csv is added.

Will recovered cases still be reported on the daily CSV files? Will they reflect the daily recovered or aggregated?
@DataChant No recovered cases will be reported in the daily reports and the time series tables.
Update: we newly added recovered time series table for most countries. Thanks!

Woah, major news. Let’s do this. Bummed about no recovered but seems to be difficult to collect. County level data is going to be massive. Thank you

Thanks for your work. I'd like to know why you won't report or provide recovered cases.
No reliable data source reporting recovered cases for many countries, such as the US.

Can you please provide us a date/time for that cutover?
Can we place these new files into a different folder and leave the old files in place?
This way current dashboards that we may have running won't be full of errors when the cutover happens?
Thank you,
Ryan

Thanks so much! I'm making a Power BI Report now, so it's good to know about these upcoming changes!

Thanks @CSSEGISandData
With respect to your second bullet point, will Province/State remain for countries (excluding US) where you can source the data?
Changes look good - thanks for all the hard work - this is a very important data set!
Bevan

How do you count actice cases without having recovered available?
You don’t, just confirmed, deaths, and testing.
How do you count actice cases without having recovered available?
I'm just grouping the difference together into a group called "Active or Recovered". Like @paolinic03 said , it's the best we can do for the moment.

THANK YOU!!! :)

Will there be a release for those mentioned tables today? I don't see US tables yet.

Thank you for this. This really is an amazing resource, and I'm excited for these changes. I recommend pinning this issue so that folks don't miss it. https://help.github.com/en/github/managing-your-work-on-github/pinning-an-issue-to-your-repository

US states data is being removed. Will the us states confirmed cases and deaths be obtained by aggregating over the counties? If so, are you going to provide the state as a separate column or as part of the county name? Thanks
US states data is being removed. Will the us states confirmed cases and deaths be obtained by aggregating over the counties? If so, are you going to provide the state as a separate column or as part of the county name? Thanks
You can parse state from the county name with some quick data transformation...

In the course of the hackathon "https://wirvsvirushackathon.org/ " we are implementing a RESTful Webservice which scrapes data from various places. We have developed a landing page to make it easier for many interested people to implement a scraper or/and use our API
Maybe you can help to make the API stable and reusable! So we have to fix breaking changes only once ;-)
check it out:
https://corona-api-landingpage.netlify.com/
Thank for this. This API's output is 2 days before. I tried this "https://corona.ndo.dev/api/daily" and it showed results until March 20th. It is good as backup.

Thanks for giving us a heads up so we may prepare for the changes. And thank you for all the work you're doing!

Can you please provide us a date/time for that cutover?
Can we place these new files into a different folder and leave the old files in place?
This way current dashboards that we may have running won't be full of errors when the cutover happens?
This ☝️. Please @CSSEGISandData, help us minimize the breaking changes.

The ISO code will be added in the global time series tables.
I think this is also to be added yet so the format of the global time series will change yet again.
Trying to answer my own question, this ticket mentions FIPS code will be added. Those could be county codes or state codes, I hope both, but in either case should support aggregation without unsavory brittle regex tricks.

Are you planning to include Canadian provincial data in one of the data sets?
Thanks

@rtroha it's already in there, no? Working on email reports right now, using worldwide data, but also Canadian data by provinces (I'm in Canada).
@jipiboily It's there now, but when the format changes they said they're getting rid of state data, so if that's true i'm not sure how they're going to handle Canada (I'm in the US but we have reporting needs for Canada as well).
Changes to the current time series include the removal of the US state and county-level entries, which will be replaced with a new single country level entry for the US.
I'm assuming getting rid of only US state data. Canada provincial data is still there in the 'global' file as of now at least.

@CSSEGISandData Thanks for continuing to make better and being transparent. I look forward to having the counts at the county level in the US.

The Living Atlas US Cases feature layer is listed as deprecated, but I believe it is still being updated and now has county level data.


Instead of changing only the time series, you broke the consitency of the data format in the daily reports. #1326

@CSSEGISandData please KEEP and UPDATE a recovered cases file. As you've consolidated all states into one "US" row, your argument no longer applies. Unbreak your repository.
@CSSEGISandData keen to understand where the change process is at?
It does not seem that the changes planned are what have been made here and as others are mentioning seems less clear as to how to make a clean data set for fine grained time series data which is what we all want.
If we want a fine grained data set do we have to mash the daily with time series - replacing the country+county/state, etc in the time series each day?
It does not seem to make sense the way this repository is progressing.
Could you please explain to us how to compile this data based on the current change and future planned.
Thanks

It does NOT make any sense to me why removed US states but still keep state-level entries in other countries (e.g., provinces in China, Canada, etc) in the "time_series_covid19_confirmed_global.csv".
@yystat Separate US time-series with county level details is coming...
Not sure why it's not there yet before deprecation of old one starts. Ideally there should be some overlap.
@yystat Separate US time-series with county level details is coming...
Not sure why it's not there yet before deprecation of old one starts. Ideally there should be some overlap.
I'm not sure why they want to keep US data in a separate file. Previously I only need to download one file, and if I want to focus on US, then I only select region==US. Now I have to deal with 2 separate files.

What time are you planning on uploading the US time series files such as time_series_covid19_confirmed_US.csv?

@yystat Separate US time-series with county level details is coming...
Not sure why it's not there yet before deprecation of old one starts. Ideally there should be some overlap.I'm not sure why they want to keep US data in a separate file. Previously I only need to download one file, and if I want to focus on US, then I only select
region==US. Now I have to deal with 2 separate files.
This is a deal breaker for me. I can't believe they did this in the middle of the pandemic. I built something in a code sprint in my spare time that worked great and now it is broken and I do not have time to fix this. Please put back the US states!
And they put this in issues, not on the front page of the repo, or the readme pages for the different csv folders. I mean...my site just got up and running on Saturday and now it's basically useless.

No reliable data source reporting recovered cases for many countries, such as the US.
Just because US doesn't report recovery, does that mean the rest of the world must follow?
I really would hope the team would reconsider this, as I'm sure a lot of other folks around the world would appreciate this as well. There's no reliable recovery data for some countries (namely US), but most countries provide this valuable information. Are you also going to remove this from the interactive map too?
They said "many countries". As big as it is, the US is just one.

We all know that data out of the US is scarcely reliable due to their lack of a centralised system of reporting, so why deprive us of more reliable data from the rest of the world that has coordinated health care reporting? If this data set is now just going to be tailored to the needs of the US administration, then it is not reliable for the rest of the world.
So I see the deprecation notice in the readme and asking everyone to use the new "global" data but where is this:
The ISO code will be added in the global time series tables.
When that's added later, things will break again...

For US data, will longitude/latitude coordinates still be provided, or do I have to find a way to map FIPS to longitude/latitude?

Please keep state level data for the US. Provinces for other countries are still reported, not sure why US wouldn't be, especially considering JHU is in the US 😆

The number of recovered cases is VERY important data as with exponential growth like this the measure to look for is the growth RELATIVE to number of acrive cases. Without that knowledge, the data is I would say useless.

It's not acceptable to publish some of the data in different formats in the same commit. For example, cse_covid_19_daily_reports/03-23-2020.csv is a different format from cse_covid_19_daily_reports/03-22-2020.csv which is a different format from cse_covid_19_daily_reports/02-01-2020.csv.
I can understand the schema changing over time (e.g. recovered counts). If that happens, then
- Ensure all the data in the previous commit is using the previous schema.
- Ensure all the data in the current commit is using the new schema.
That way, any code that reads the data can be consistent for each version of your repo, instead of being different for various date ranges. (And if you don't expect code to read your data, then why are you publishing it?)
Even better, publish all the data in all versions of the schema in every commit. That way the code that reads the data can remain consistent across multiple versions of your repo.

It's not acceptable to publish some of the data in different formats in the same commit. For example,
cse_covid_19_daily_reports/03-23-2020.csvis a different format fromcse_covid_19_daily_reports/03-22-2020.csvwhich is a different format fromcse_covid_19_daily_reports/02-01-2020.csv.I can understand the schema changing over time (e.g. recovered counts). If that happens, then
- Ensure all the data in the previous commit is using the previous schema.
- Ensure all the data in the current commit is using the new schema.
That way, any code that reads the data can be consistent for each version of your repo, instead of being different for various date ranges. (And if you don't expect code to read your data, then why are you publishing it?)
Even better, publish all the data in all versions of the schema in every commit. That way the code that reads the data can remain consistent across multiple versions of your repo.
I can't believe that the data is provided by Johns Hopkins :D

Why do you push the global data already if the US data is not published?
Thousands depend on this data set and you just change it the way you like from day to day without any consistency.
Please be more thoughtful. This is amazing data but it's worthless if people need hours every week to rework their scripts.
Additionally in 2 weeks this data is completely useless without data for recovered.
It's already useless in Chian i.e in Hubei, China there are about 60,000 recovered cases.

The number of recovered cases is VERY important data as with exponential growth like this the measure to look for is the growth RELATIVE to number of acrive cases. Without that knowledge, the data is I would say useless.
I agree with you. Without the recovered cases it's not possible to estimate the curve of the actual infected and this is a great lack for the analysis. Not possible to make predictions.....

I can understand the frustration, as another person who also keeps having to tweak code to adapt to these changes, but I'm shocked by all the complaining. The fact that we even have access to this data that they are putting days and nights of effort into gathering is an absolute gift. Just being provided access to their hard work is wonderful. Let's practice a little gratitude during these times. 🙏

No reliable data source reporting recovered cases for many countries, such as the US.
Wouldn't it be possible to provide recoveries for the countries with reliable sources and keep the rest NA ?

I've removed recovered cases from our feeds as per these changes, but I'm curious as to why recovered cases are still showing on the ArcGIS dashboard? Many thanks for all your hard work.
Folks, with the new structure, track confirmed cases and deaths and just create a variable called “Active or Recovered” to track the difference.
Confirmed - Deaths = “Active or Recovered”
The testing group is probably a subset of this category but not sure how this is defined.
Also, think about the logistics and capability of tracking confirmed recovered cases accurately across the globe in a healthcare perspective for a second. Even confirmed cases is only limited to who has been confirmed or presumed to have COVID. Actual cases are likely hundreds of thousands more than confirmed. More people have likely recovered from COVID than we are even able to confirm have ever had it because they were either asymptomatic or showing mild symptoms so they never touched the system. So take confirmed cases with a grain of salt too.
All of these counts are those that are seen/ flown through the global healthcare system.
If anything, an accurate death count is the most important because the goal of all of this is to save lives so thankfully we can likely say with 90% confidence (even deaths aren’t 100% accurate because of comorbidities and other factors), these counts are fairly reliable. So, I am happy with confirmed and death counts to calculate death rate of confirmed cases because we want this to be as low as possible.

@CSSEGISandData so where are the US files like time_series_covid19_confirmed_US.csv that you mention?
As mentioned, the relevant number for modeling the spreading is the number of active cases. Not the active or recovered, but active. I understand that this data can not be collected if it is too inaccurate. It is not fault of JHU, but that data would really be valuable.
I think It is still possible to measure relevant information based on the available statistics. I will convert my "Active"-category to moving average of cases over last 15 days. That 15 to be re-evaluated by curve fitting to availabe still "recovered" data. I think it'll have to od.
And no this is not critics against JHU, actually it seems they are one of the very few who undestand the value of accurate information. Thank you for the great job.
I like the way you think @mkosunen

@mkosunen -- yes, sadly, i guess, realistically, things like Active will need to be done by surveys, rather than "reported to the health authorities". after all, if really 80% aren't worse than the flu, it's unlikely an overloaded healthcare system is going to follow up every day to determine if the patient is still "sick". (too bad for us modelers, but there you have it!)
as from all of us, thanks to JHU!
(ah, this is my chance to say that i'm looking forward to ISO 3166-1 country codes (iso3c? 2c?). it would be work, but nice, for Province_State != "", to have ISO 3166-2 -- where available -- for the country subdivisions. thanks so much for the cleanup.)

It'd be great if you could provide a data dictionary for the new formats of the files.
Secondly, the recovered cases could be outsourced or rather crowdsourced to whoever would like to update the recoveries for their respective countries with a caveat of mentioning that this data cannot be relied on as it is the work on individual, self-motivated individuals who will do so as long as they are motivated to do so. Thanks!

Also, think about the logistics and capability of tracking confirmed recovered cases accurately across the globe in a healthcare perspective for a second.
Thank you @paolinic03. That's a point very well put. We should stop clamoring for "recovered data" and become real data scientists by thinking back to how and where the data is collected. Put yourself into the shoes of an overworked doctor or clinic and imagine how they could possibly count all their patients who recovered from COVID-19 infection. It's impossible. That count will always be partial and incomplete and therefore unreliable. For example, out of 59,138 confirmed cases, Italy could only report that 7,024 had recovered AND 5,476 had died. Does that mean 46,638 people are still sick? No way is that reasonable. Therefore, I'm definitely not passing recovered counts to my users.

The lack of Active data (recovered) renders all our independent work useless. What is worse though, is that it will enable the hysteria to grow. Recovered data, especially from China and South Korea, are the models that allowed people to see the light at the end of the tunnel. Now all we have is the high confirmed n and the deaths.
Even if the updates were slow, I am sad that they are not being continued.
The best we can do now is a projection model of suspected recoveries. We will need to judge everything off the growth rate.

Maybe I missed it but when exactly is this change happening?
the changes are already applied
@SimonHausdorf oh dear - ok thanks :)

@SimonHausdorf @mwargan clarification - the changes are only somewhat applied. There is still no time series data specific to the US, as mentioned in the issue initially (e.g. no time_series_covid19_confirmed_US.csv.csv etc yet). Not sure when @CSSEGISandData will be adding those files - hopefully soon.
The lack of Active data (recovered) renders all our independent work useless. What is worse though, is that it will enable the hysteria to grow. Recovered data, especially from China and South Korea, are the models that allowed people to see the light at the end of the tunnel. Now all we have is the high confirmed n and the deaths.
Active data has been incomplete and partial from the very beginning, especially recovered. It is just being noticed now to where it is a major issue to keep reporting those figures. Your independent work is not useless, keep on adjusting. If you trust that China and South Korea figures are accurate (I am skeptical), then use them as benchmarks against other countries and be creative.
All, do not get frustrated, keep reporting and looking at things differently and outside the box. Data is data. We are all doing great work for our countries, companies, friends, family, etc.

Thank you! When parsing the US and China, being required to group individual states/provinces required quite a bit of work so I avoided it. Great to see it being reflected in the CSV files now!

Thank you for collecting and providing this collection of data sets.
It is unfortunate that the recovered category was dropped. I don't really follow the logic of the decision. We all understand that the reported data is not reliable. It was clear that the recovered category is (at the very best) related only to the pool reflected by the reported confirmed category. It still was an important figure to monitor how the situation evolves based at least on the cases which the local authorities (countries, states, provinces etc.) have in their views.
Regarding the three categories reported until now neither of them is more or less reliable than the other too, at least not in any quantifiable way. Most countries report at least these three as reliably as they can. Could you, please, reconsider keeping the recovered category. (If I am not mistaken it is "just" (?) keeping the old code for it.)
I am considering scraping Worldometers, which also is one of your data source listed. Unfortunately, I don't really have the resources to accumulate a time series and provide an online API. Not to mention that I would have to reinvent standardization work (ISO date, country code etc) what you and/or others based on your data-set have already done.
Many many online API-s based on your excellent work get fundamentally broken by this decision.

Like some posters above, at first I too was a bit flummoxed by the loss of the "Recovered" data for the purposes of computing an "active cases" number from "cases"-("recovered"+"deaths"). However I figured I could sidestep the issue by simply assuming any new case has an active life of 2 or 3 weeks or so.
For the purposes of charting active cases, the old way using the recovered data got me a plot like this (sorry, roundtripped through FB... and note that I didn't get the message that "recovered" data had been discontinued since the 17th):
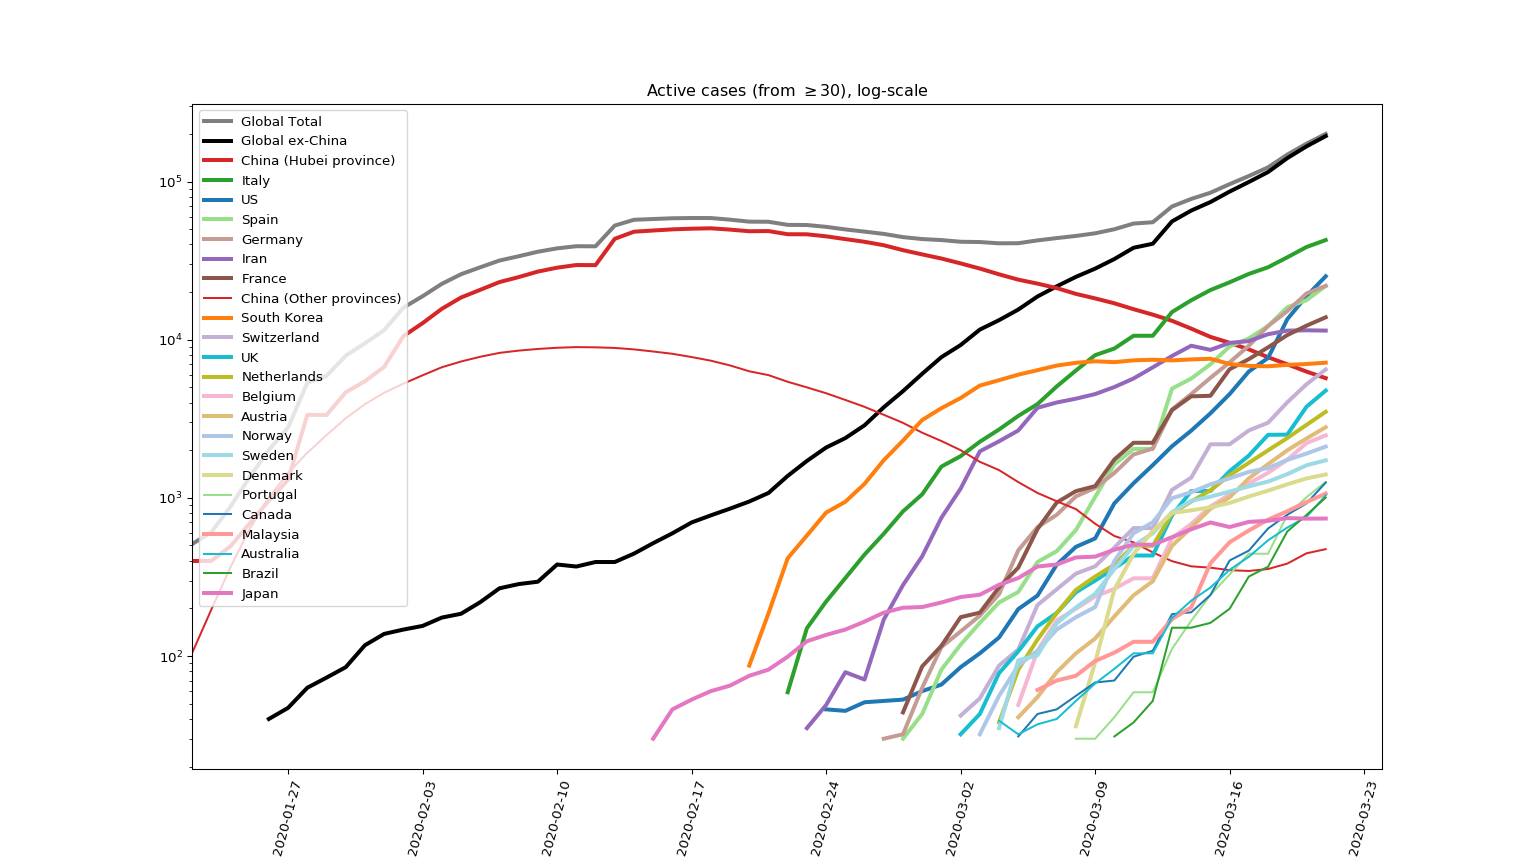
and the new way with a 21-day active period assumed looks like this:
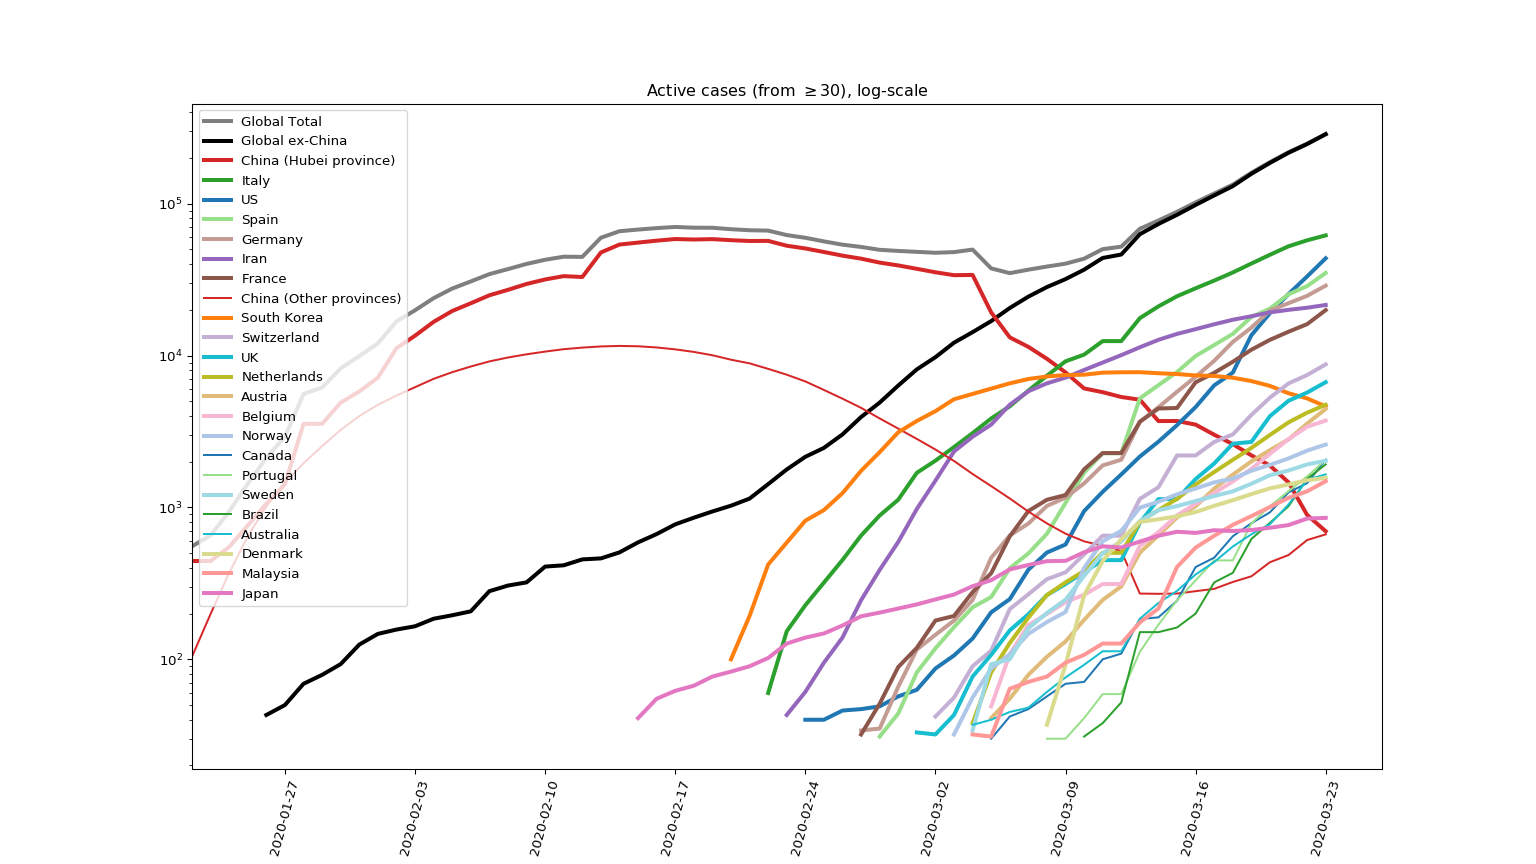
In python (numpy arrays)
    activeWindow=21
    casesActive=casesTotal-np.concatenate([np.zeros((activeWindow,)),casesTotal[:-activeWindow]])
replaces casesActive=casesTotal-(recoveredTotal+deathsTotal).
If I was really pedantic I'd do some sort of best-fit optimisation on the old data to work out what value of activeWindow fitted that best.
Thanks to everyone involved in making this data available to curious eyeballs.

For my own tracking, I created a table in which I track the last four days of confirmed cases by country. Then, I calculate the daily percentage change which allows me to see if the percentages are increasing or decreasing daily. If you don’t want the hysteria to grow, make this percentages the important number. Since February 19, the percentage increase of confirmed cases in China has been less than 1% and the number of confirmed cases has increase by less than 100 per day since March 7. It is scary to say that on March 21st there were 81,305 confirmed cases in China, but it is good news to say that in that day the percentage increase was 0.068% or that the number of new cases was 55.

Can someone post and tell us when the US time series files and the Global testing files will start to be posted? I've seen this question asked several times on this thread - but never answered.
thanks so much for this data!

Recovery data can be found at
https://github.com/ulklc/covid19-timeseries/blob/master/report/country/US.csv
#1426 does not answer the question about the time series datasets that have been mentioned. Everyone here is asking about those - not the daily csv files. We want them from this source at the county/day level...
Below is the link describing what I used the "Recovered" data for. Shorly "Relative growth" and changes in it is a measure of effectiveness of the actions by the govenrments. In China and South Korea, when relative daily growth was pushed below 0.1, the increase of the number of active cases stopped. Two weeks later they started to decline.
https://github.com/mkosunen/Covid19-Study/blob/master/pdffiles/Covid19-Study.pdf
There is a gauge for effectiveness of the actions, and we should be monitoring it. However, the gauge is valid also even if the Recovered are replaced with moving average.

I'm not sure how often comments are reviewed but in this crisis it's worth repeating verbatim a prior one:
Can someone post and tell us when the US time series files and the Global testing files will start to be posted? I've seen this question asked several times on this thread - but never answered.
thanks so much for this data!
I don't want to assume they will be posted tonight when the daily update occurs - looking for confidence someone is on this. Already major news outlets are showing messed up charts, and before long a politician will see flattening and claim success. This is a big deal.

Where will the FIPS and ISO code columns be inserted? What will their column names be? I built a global visualizer in Unity and will be modifying it to the new structures and file locations. The visualizer works on JSON versions of the CSV data (more in a separate post to come).
Hey folks, for those reporting on the US, I have put together a starting point given the new data structure. Published to Tableau Public here...
It isn't perfect so be nice!!!!!!!!!!!!!! But, open to suggestions on how others are reporting and maybe we can come to a conclusion on how we should be visualizing this information. Will be making edits as good suggestions roll in. Bad ones will be banished from existence :)
Happy Vizing.

Where are you getting county-level data from? We just hit 98.2% of the US population on our county-level scraper here, and we cite sources for every single row of data: https://coronadatascraper.com/
We are keen to collaborate. Could we serve as your source of county-level data to reduce the burden?

I'm a little confused on the first bullet: are time series confirmed/deaths no longer going to reported at a state level for US at all? If that's not the case, can someone kindly provide a URL to it. Thanks!
Mathematicians and epidemiologists use the R number, the basic reproductive number, to determine if an epidemic is spreading or receding. R indicates how many people a patient is likely to infect. If R is above one, each infected person, on average, is contaminating another person. If it’s less than one, then infected people are generating less infection. The aim of any government is to first get R below one, and then to zero.
To all people using JHU CSSE data for their tracking information, why don't you report the daily R number per country.
https://www.mmogollon.com/corona-virus-2
Try accessing the files on data.world that the kind folks at Tableau are publicizing.
https://data.world/covid-19-data-resource-hub/covid-19-case-counts/workspace/intro
@MirelesJ the daily file from 03-23-2020.csv has the FIPS column (labeled FIPS). that might be located at
csse_covid_19_data/csse_covid_19_daily_reports
cheers.

I don't really follow the logic of the decision. We all understand that the reported data is not reliable.
💯 What's mind blowing to me is that hospitals apparently aren't tracking the progress of patients with a deadly virus.
You mean that it's too complicated to ask a patient who's tested positive to follow up in 14 days if they experience worse symptoms, and at the end of 14 days if there hasn't been a follow up, to automatically mark them as recovered?
...and yes, I think all of the data should be taken with a grain of salt. I've been reinforcing that repeatedly with anyone viewing my data, and I think it's irresponsible if we don't all do the same. So I think it's illogical to say "oh all the stats are unreliable to an extent, but this stat is like 10% less reliable than that one, so we should give up".

For anyone having difficulty with the JHU data after all these changes, I've found a parallel project which seems to have high quality interfaces that are much more stable: https://coronadatascraper.com/
They also are fully transparent about their data sources - all reliable government or public health websites.

@NickSto I'm trying to switch to it in zbraniecki/covid19-timeseries#14 but found their data a bit less complete in several areas: No "China" as a country, USA data only for 4-5 days, etc. I think their data model is really good, so I hope they'll backlog the data!

We've been getting our county data from USA Facts comfirmed csv link deaths csv link. They claim to update from each state's source.
We were getting state level data from JHU until it broke today. I know the daily folder has the county level but we lose history. When can we expect the files mentioned in this issue (below) to be available with county level with full time series history? I'd like to just get my county level from JHU if possible:
time_series_covid19_confirmed_US.csv, time_series_covid19_deaths_US.csv

Disappointing that you won't be maintaining recoveries - this means we will no longer be able to calculate the number of active cases. Active cases are really the meaningful quantity to track. Is there an alternative source for recoveries?

I thought the recover issue was a problem too but if you read up above:
- Confirmed cases are "lossy" because they only come from working tests that actually occur
- Deaths are relatively concrete but are also "lossy" because of existing conditions and other factors
- Recoveries data is pretty spotty and not timely
I would love to know if the following holds:
if we assume people are not dead recoveryDays after the case is confirmed is that "close enough" for predicting active cases, which are already complicated because of under testing? (where something like 20 < recoveryDays < 25)?
(Also thanks to the CSSEGISandData team, this is not an easy thing to maintain 👍 )

We've been getting our county data from USA Facts comfirmed csv link deaths csv link. They claim to update from each state's source.
We were getting state level data from JHU until it broke today. I know the daily folder has the county level but we lose history. When can we expect the files mentioned in this issue (below) to be available with county level with full time series history? I'd like to just get my county level from JHU if possible:
time_series_covid19_confirmed_US.csv, time_series_covid19_deaths_US.csv
I get HTTP Error 403: Forbidden when using urllib.request to access. Is there a better way to automate access?

Where is the "time_series_covid19_testing_global.csv" file?

Could you please upload the Active Cases Data in Time Series?

@bennett000 I've been wondering the same thing, there seem to be some decent results for what the time ranges are for the various stages of having the virus. So perhaps while data is still being put together, we can provide estimations for how many confirmed cases are still recovering, maybe soon starting per county?
Also ❤️ the maintainers 🚀
We've been getting our county data from USA Facts comfirmed csv link deaths csv link. They claim to update from each state's source.
We were getting state level data from JHU until it broke today. I know the daily folder has the county level but we lose history. When can we expect the files mentioned in this issue (below) to be available with county level with full time series history? I'd like to just get my county level from JHU if possible:
time_series_covid19_confirmed_US.csv, time_series_covid19_deaths_US.csvI get HTTP Error 403: Forbidden when using urllib.request to access. Is there a better way to automate access?
We were using requests to automate. Perhaps I pasted the direct link incorrectly? What url are you using to grab it?
I am using these links from your post:
{'confirmed': 'https://static.usafacts.org/public/data/covid-19/covid_confirmed_usafacts.csv',
 'deaths': 'https://static.usafacts.org/public/data/covid-19/covid_deaths_usafacts.csv'}
and I am using this code to read:
with urllib.request.urlopen(link) as response, open(temp_file_name, 'wb') as out_file:
    shutil.copyfileobj(response, out_file)

Thank you for your work and for making these data available!
Do you have an estimated date for when the files for US county- and state- level data (filenames such as time_series_covid19_confirmed_US.csv that you described above) will begin to be posted on the repository?
I under stood that JHU is not willing to publish data on state level.
The remaining question is: why do you not publish this time-series information on github including? Which political advice is restricting a scientific source?
I under stood that JHU is not willing to publish data on state level.
The remaining question is: why do you not publish this time-series information on github including? Which political advice is restricting a scientific source?
"Three new time series tables will be added for the US. The first two will be the confirmed cases and deaths, reported at the county level. The third, number of tests conducted, will be reported at the state level. These new tables will be named time_series_covid19_confirmed_US.csv, time_series_covid19_deaths_US.csv, time_series_covid19_testing_US.csv, respectively."
We should be getting new files for US county level data (I assume we could back into the state level from this). For some reason these haven't been posted yet.

JHU states: "The FIPS code will be added in the new US time series tables."
FIPS codes are numbers which uniquely identify geographic areas. The number of digits in FIPS codes vary depending on the level of geography. State-level FIPS codes have two digits, county-level FIPS codes have five digits of which the first two are the FIPS code of the state to which the county belongs.

Hi! Great job with this information!
Will these files be updated??
- time_series_19-covid-Confirmed.csv
- time_series_19-covid-Deaths.csv
- time_series_19-covid-Recovered.csv
My whole work and educational purposes were based on those files.
Thank you!

Will these files be updated?
time_series_19-covid-Confirmed.csv
time_series_19-covid-Deaths.csv
time_series_19-covid-Recovered.csv
We've been getting our county data from USA Facts comfirmed csv link deaths csv link. They claim to update from each state's source.
We were getting state level data from JHU until it broke today. I know the daily folder has the county level but we lose history. When can we expect the files mentioned in this issue (below) to be available with county level with full time series history? I'd like to just get my county level from JHU if possible:
time_series_covid19_confirmed_US.csv, time_series_covid19_deaths_US.csvI get HTTP Error 403: Forbidden when using urllib.request to access. Is there a better way to automate access?
We were using requests to automate. Perhaps I pasted the direct link incorrectly? What url are you using to grab it?
I am using these links from your post:
{'confirmed': 'https://static.usafacts.org/public/data/covid-19/covid_confirmed_usafacts.csv',
 'deaths': 'https://static.usafacts.org/public/data/covid-19/covid_deaths_usafacts.csv'}
and I am using this code to read:
with urllib.request.urlopen(link) as response, open(temp_file_name, 'wb') as out_file:
    shutil.copyfileobj(response, out_file)
Here's our code to load these into BQ. By the way, Google just made the JHU data available in their public data as of yesterday afternoon. They are suffering from the same missing US state information as everyone else now, though.
`
import os
import re
import json
import pandas as pd
import requests
import io
from google.oauth2 import service_account
import pandas_gbq
credentials = service_account.Credentials.from_service_account_info(
json.loads( os.environ['GCP_CREDS_JSON'])
)
def load_url_to_bq(url, target):
csv_data=requests.get(url).content
df=pd.read_csv(io.StringIO(csv_data.decode('utf-8', errors='replace')))
df.columns = df.columns.str.strip().str.lower().str.replace(' ', '_').str.replace('(countyfip)s?', lambda m: m.group(1) + 's')
df = pd.melt(
df,
id_vars=["countyfips", "county_name", "state", "statefips"],
var_name="date",
value_name="count"
)
print("Fields: {}".format(df.columns))
df.to_gbq(
target,
project_id=os.environ['GCP_PROJECT_ID'],
credentials=credentials,
if_exists='replace'
)
if name == "main":
source_targets = [
{
"url": "https://static.usafacts.org/public/data/covid-19/covid_confirmed_usafacts.csv",
"target": "covid_19.daily_us_county_confirmed"
},
{
"url": "https://static.usafacts.org/public/data/covid-19/covid_deaths_usafacts.csv",
"target": "covid_19.daily_us_county_deaths"
}
]
for e in source_targets:
load_url_to_bq(e["url"], e["target"])
`

- Three new time series tables will be added for the US. The first two will be the confirmed cases and deaths, reported at the county level. The third, number of tests conducted, will be reported at the state level. These new tables will be named
time_series_covid19_confirmed_US.csv,time_series_covid19_deaths_US.csv,time_series_covid19_testing_US.csv, respectively.
=> Where is the USA data?

US data is available from other sources here: https://covidtracking.com/us-daily/