Statistics and visualization for amplicon data in microbiome
- Input feature (OTU/ASV/Taxonomic) tables, metadata;
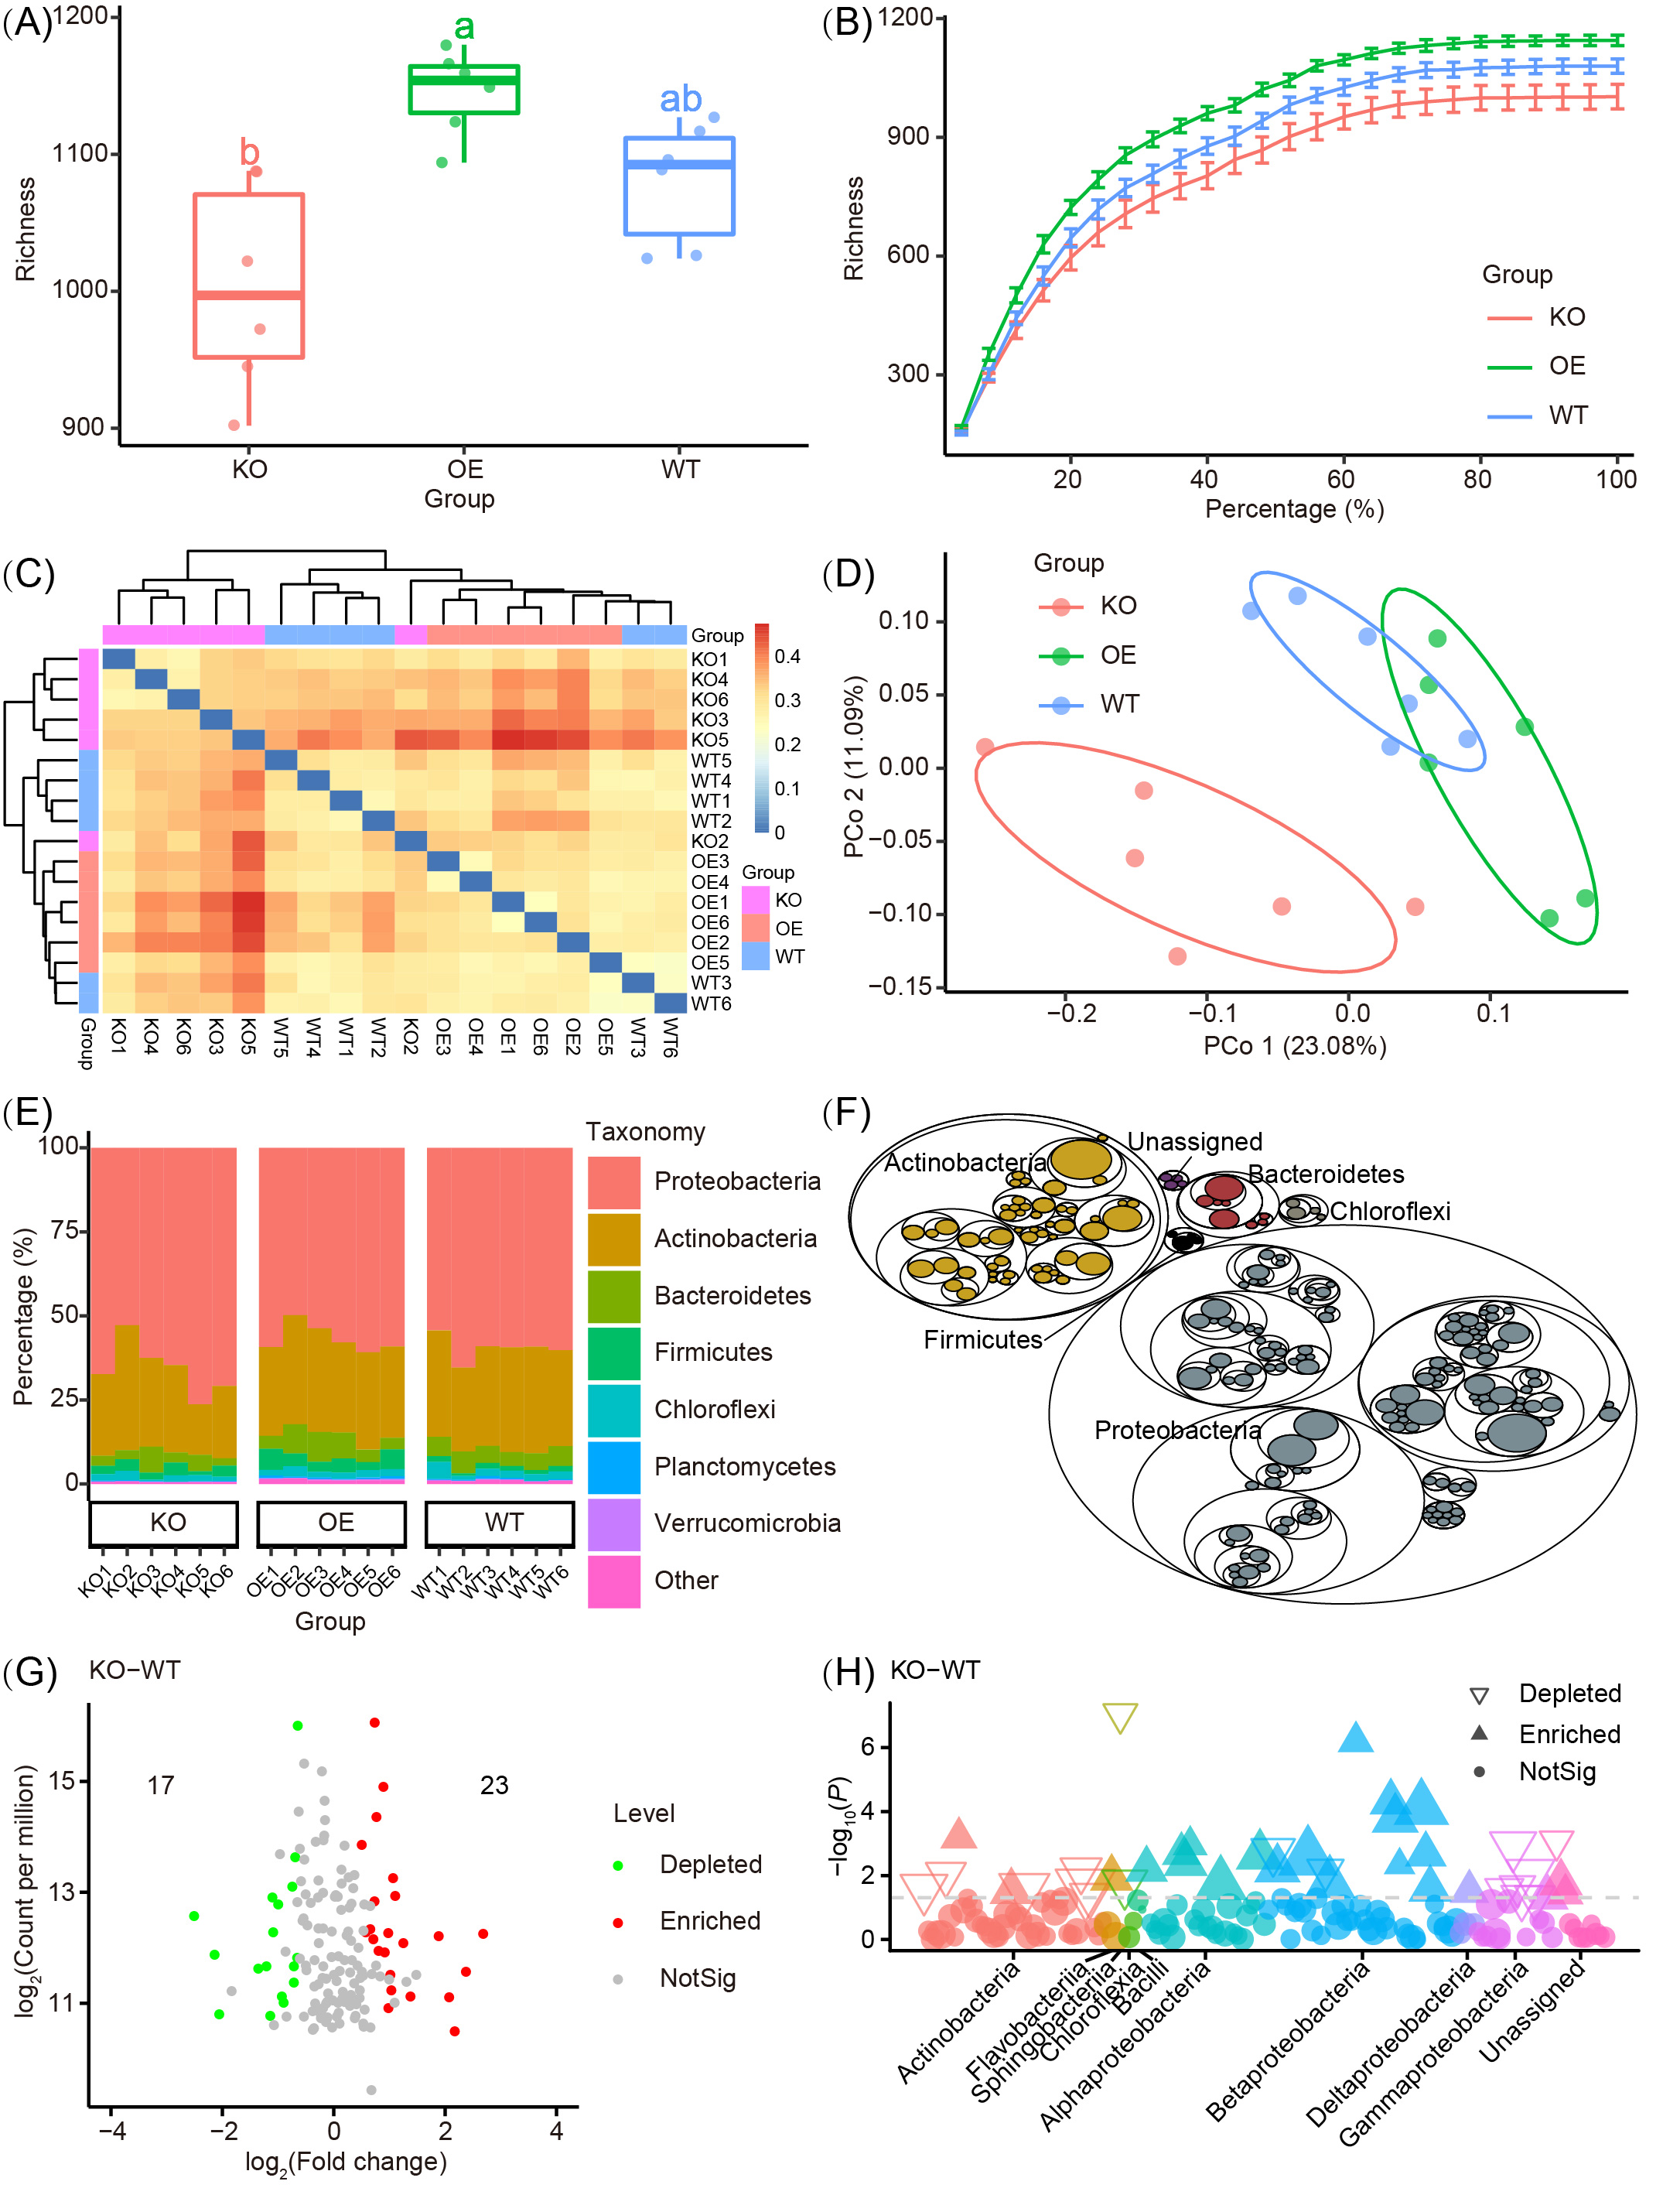
- Supports more than ten analysis methods, provides multiple visualization styles;
- Alpha diversity: index barplot, boxplot with stat label;
- Beta diveristy: Supported 47 distance * 8 ordination methods, output scatter plot with stat eclippse and sample label;
- Taxonomic composition: Stackplot in samples or groups, even support bubble plot.
- Published-ready figures and tables.
Please open RStudio, and run the following code for install.
library(devtools)
install_github("microbiota/amplicon")
You can used it following the vignettes, we recommended use it in EasyAmplicon
- EasyAmplicon: https://github.com/YongxinLiu/EasyAmplicon
If used this script, please cited:
Yong-Xin Liu, Lei Chen, Tengfei Ma, Xiaofang Li, Maosheng Zheng, Xin Zhou, Liang Chen, Xubo Qian, Jiao Xi, Hongye Lu, Huiluo Cao, Xiaoya Ma, Bian Bian, Pengfan Zhang, Jiqiu Wu, Ren-You Gan, Baolei Jia, Linyang Sun, Zhicheng Ju, Yunyun Gao, Tao Wen, Tong Chen. 2023. EasyAmplicon: An easy-to-use, open-source, reproducible, and community-based pipeline for amplicon data analysis in microbiome research. iMeta 2: e83. https://doi.org/10.1002/imt2.83
Copyright 2016-2023 Yong-Xin Liu liuyongxin@caas.cn, Tao Wen taowen@njau.edu.cn, Tong Chen chent@nrc.ac.cn