version 1.0
release date 2021/4/19
written by Ruix. Li
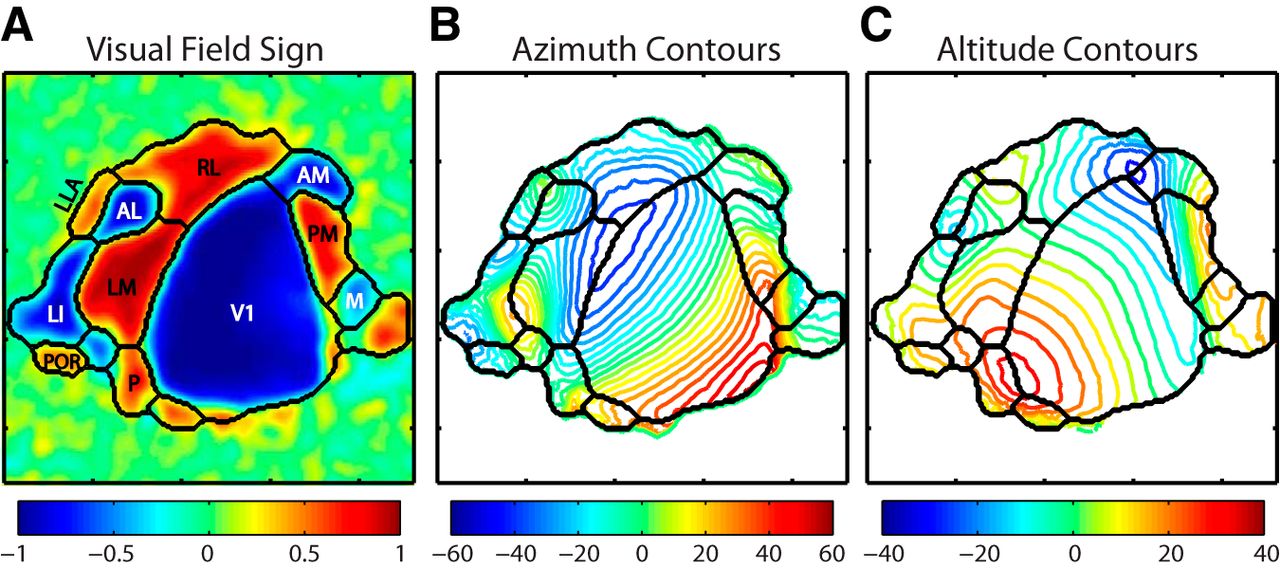
autoRM provides a fully automatic tool for mice retinotopic mapping. It can help you to locate the primary and several higher-order visual cortex of mice with calcium or optical imaging (figure from ref [1]).

- Psychopy3 (>=2020.1.3) to present visual stimulus
- NI-DAQ USB-6501 digital I/O Device and NI-DAQmx driver for synchronization
- MATLAB (>=2019a) with image processing toolbox
RetinotopicMappingv5.pyis a Python script to present visual stimulus for retinotopic mapping, a typical experiment last about 30 minutes.RMDegMap.mis a MATLAB function to calculate visual degree, naming azimuth and elevation.RMSetParam.mis a MATLAB app helps you to determine parameters used inRMAreaMAp.m.RMAreaMap.mis a MATLAB function to identify visual areas, see ref [2] for details.autoRM.mis the MATLAB function you use, it callsRMDegMapRMSetParamandRMAreaMap, usually you don't need to use other functions.
- MATLAB image processing toolbox is required.
- Run
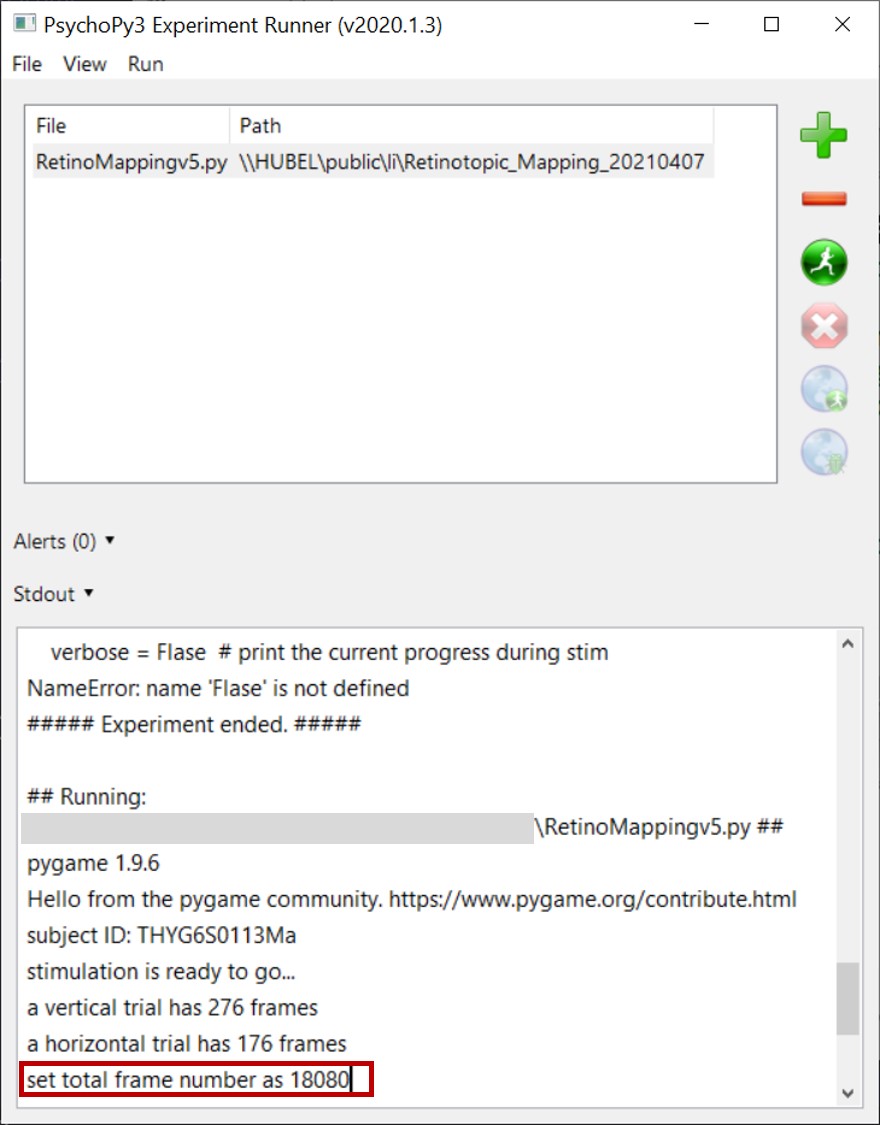
RetinotopicMappingv5.pywith psychopy3 before start recording. Recommend using a NI-DAQ digital I/O device to synchronize your camera with the visual stimulus. - The Python program will return the frame number required for recording. Set the frame number in your camera control interface.
- After stimulus finish,
RetinotopicMappingv5.pywill save a txt log file and a json configuration file. The json file is required in the following steps. - Convert your recording data into
.matdata. - Add
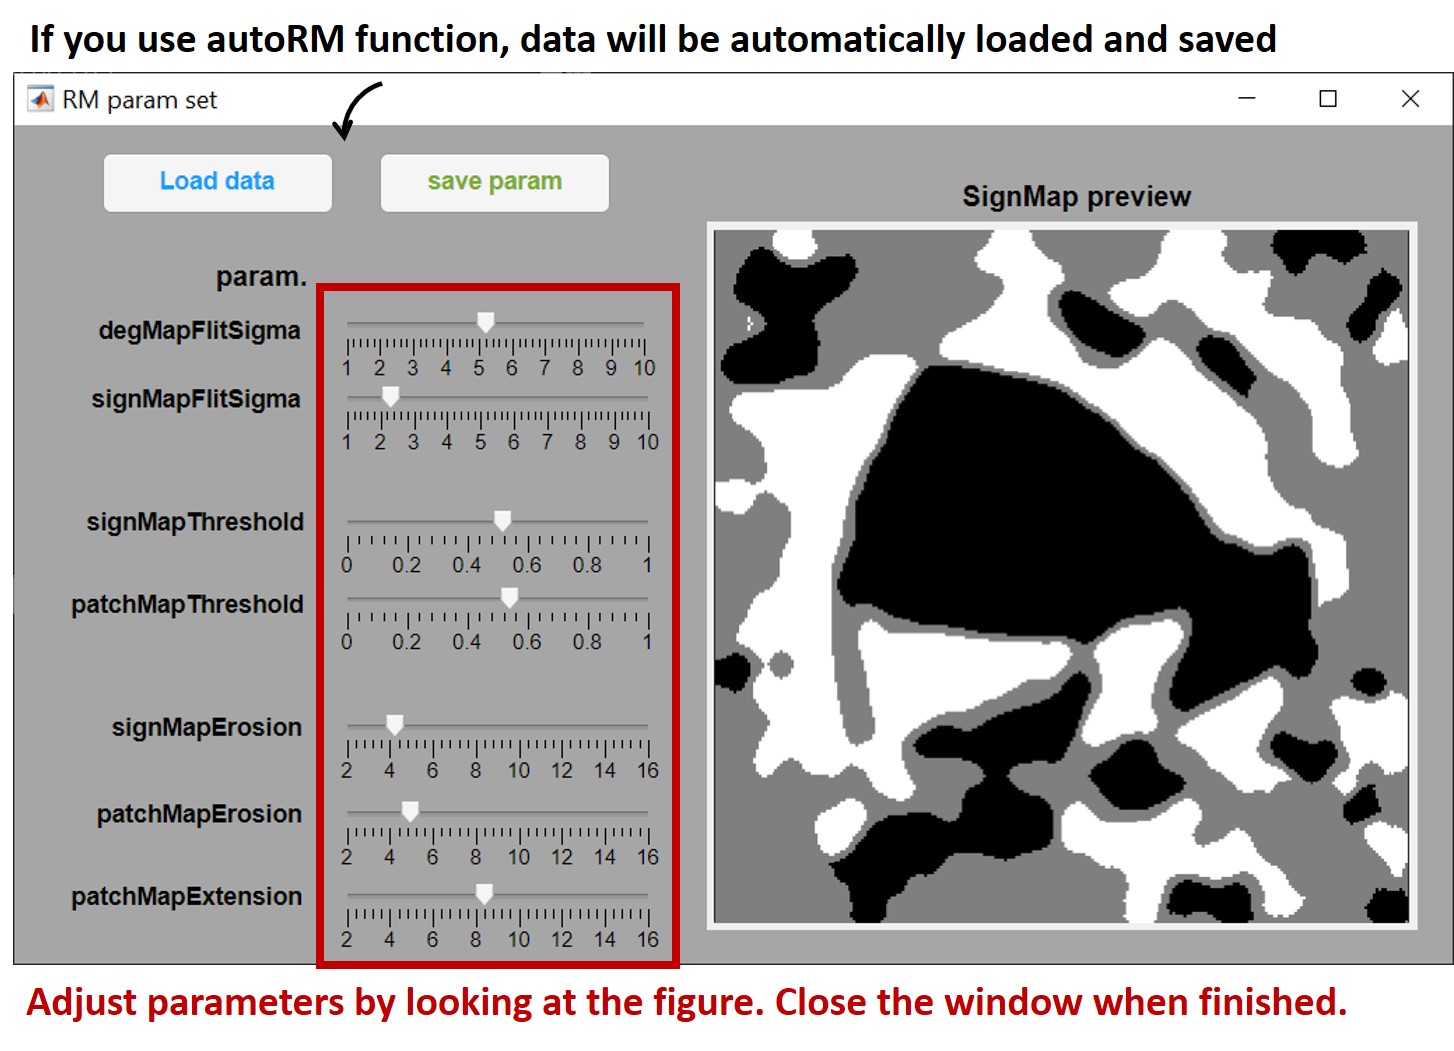
RMDegMap.m,RMSetParam.mandRMAreaMap.mto your MATLAB path, then callautoRMin MATLAB command window and follow the instructions to select recording data.matfile and.jsonconfigration files. - A GUI will pop-up for you to adjust parameters.
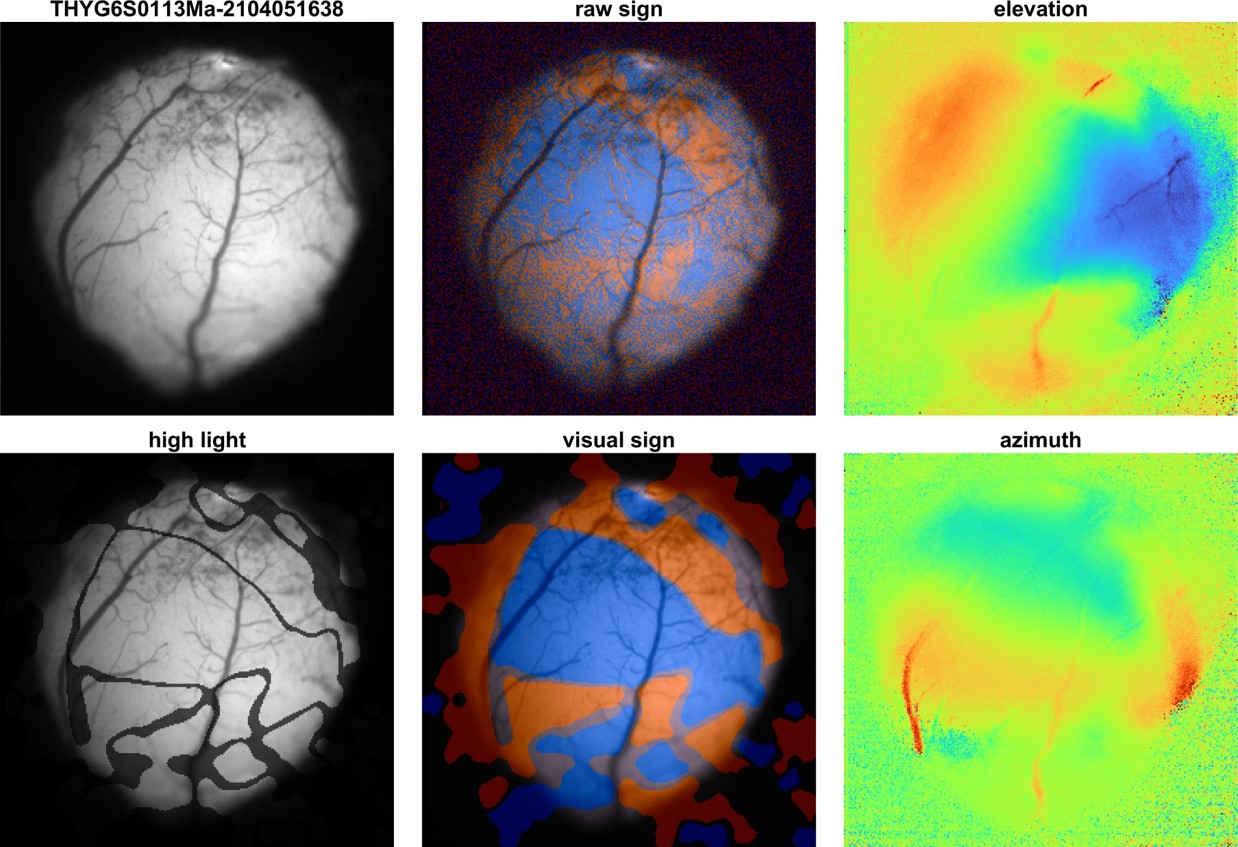
autoRMwill create a figure for you at the path of.jsonconfig file. This figure can be used as retinotopic mapping reference for your subsequential experiments.
-
XYT image data: the image data for analysis
-
configuration json file: the json file generated by
RetinotopicMappingv5.py, which contains experiment configurations for data process.
-
FOV: a image of field of view -
dataL2R,dataR2L: trial average data of left to right and right to left -
dataD2U,dataU2D: trial average data of down to up and up to down -
phaseMaps: phase maps of trial average data obtained from FFT. -
degMaps: degree maps connect visual areas with visual field. -
degMapAzi: azimuth map. Here assume the azimuth at front of mouse is 0. Azimuth usually ranges from 0 to 120 degree. -
degMapElv: elevation map. Here assume the elevation at front of mouse is 0. Elevation ususally ranges from -40 to 40 degree.
-
rSignMap: raw sign map calculated fromdegMapAzianddegMapElv -
signMap: sign map after image process to reduce noise and artifacts. -
areaMap: a bit map indicate visal areas. -
signFOV: align sign map to FOV. -
hltFOV: high light visual areas in FOV.
autoRM save 2 figures
References:
[1] Marshel, James H., et al. "Functional specialization of seven mouse visual cortical areas." Neuron 72.6 (2011): 1040-1054.
[2] Juavinett, Ashley L., et al. "Automated identification of mouse visual areas with intrinsic signal imaging." Nature protocols 12.1 (2017): 32.
[3] Zhuang, Jun, et al. "An extended retinotopic map of mouse cortex." Elife 6 (2017): e18372.


