Codebasics Resume Project Challenge – Data Analytics Project
The Codebasics Resume Project Challenge is an engaging initiative hosted by Codebasics. Drawing participants from around the globe, this challenge showcases the skills and talents of aspiring data analysts. Submissions are reviewed by the Codebasics team and shared with a global audience on LinkedIn, offering participants valuable exposure and recognition.
Table of Contents
- About The Project
- Live Interactive Dashboard
- Presentation of Key Insights
- Video Presentation Of The Project
- Analysis and Insights
- Dataset Provided by Codebasics
- Project Execution
The project is about an imaginary retail giant called AtliQ Mart.
AtliQ Mart is a retail giant with over 50 supermarkets in the southern region of India. All their 50 stores ran a massive promotion during the Diwali 2023 and Sankranti 2024 (festive time in India) on their AtliQ branded products.
Through this exercise the sales director wants to understand which promotions did well and which did not so that they can make informed decisions for their next promotional period.
Checkout the live interactive dashboard here. Made in Power BI.
<iframe title="AtliQ_Mart_Festival_Sales_Promotional_Analysis" width="854" height="480" src="https://app.powerbi.com/view?r=eyJrIjoiMzAxMDYyMDUtMzZmYS00ODdiLWEwYjQtMDg0MWM1Mjg4Y2E5IiwidCI6ImRmODY3OWNkLWE4MGUtNDVkOC05OWFjLWM4M2VkN2ZmOTVhMCJ9&pageName=ReportSection52cd1bc4e9fbeb1610fb" frameborder="0" allowFullScreen="true"></iframe>In this presentation, I'll walk you through the insights and findings from my analysis of AtliQ Mart's promotional campaigns we will look at the sales performance, promotion effectiveness, and key trends observed during these promotional periods.
Here's the video presentation of the insights. Please have a look.
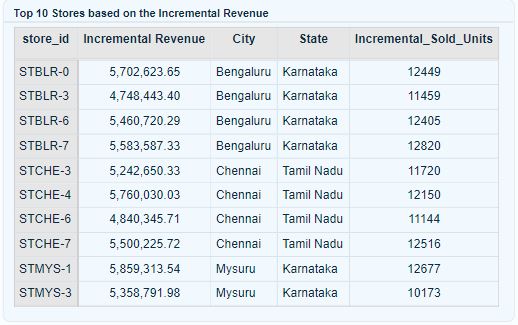
1. Which are the top 10 stores in terms of Incremental Revenue(IR) generated from the promotions?
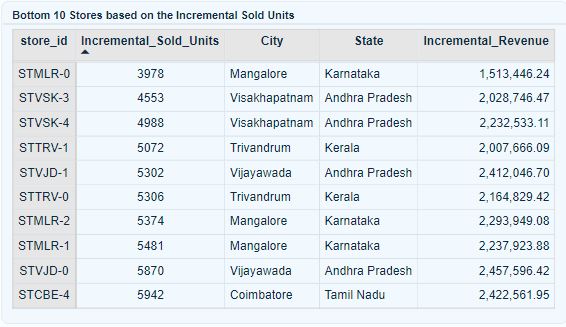
2. Which are the bottom 10 store when it comes to Incremental Sold Units (ISU)?
3. How does the performance of stores vary by city? Are there any common characteristics among the top-performing stores that could be leverages across other stores?
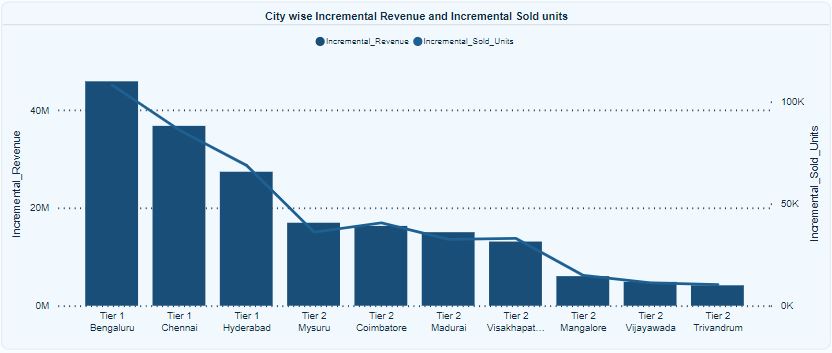
Stores located in Tier 1 cities like Bengaluru and Chennai exhibit superior performance. Additionally, there's a notable correlation between the number of stores and revenue generation, suggesting that a higher store count contributes to increased revenue. Furthermore, selling a greater quantity of products also positively impacts revenue generation.
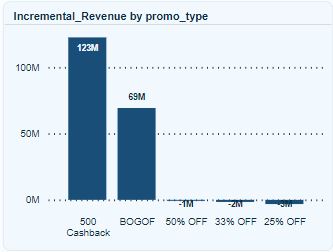
1. What are the top 2 promotion types that resulted in the highest Incremental Revenue?
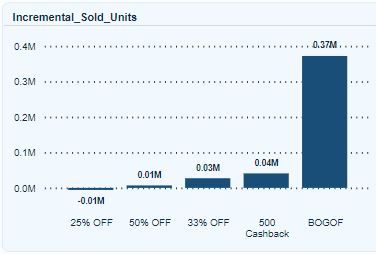
2. What are the bottom 2 promotion types in terms of their impact on Incremental Sold Units?
3. Is there any significance difference in the performance of discount -based promotions versus BOGOF (Buy One Get One Free) or cashback promotions?
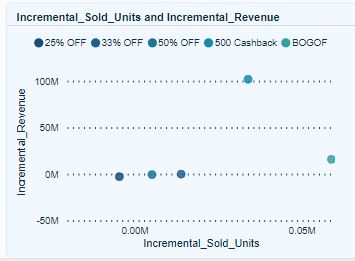
4. Which promotions strike the best balance between Incremental Sold Units and maintaining healthy margins?
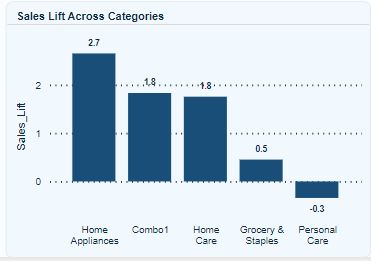
1. Which product categories saw the most significant lift in sales from the promotions?
2. Are there specific products that respond exceptionally well or poorly to promotions?
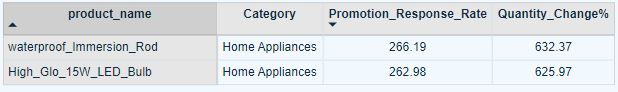
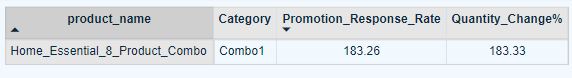
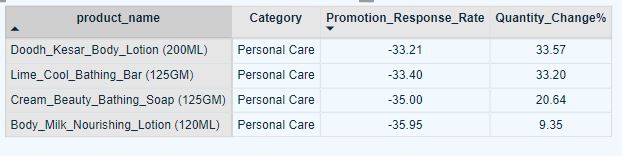
Yes, certain products respond exceptionally well or poorly to promotions. For example, products like the waterproof immersion rod, high glo 15w LED bulb, and home essentials 8-product combo performed exceptionally well during the promotions. On the other hand, products belonging to the personal care category did not perform that well. This indicates that the effectiveness of promotions can vary significantly depending on the product category and the specific products being promoted.
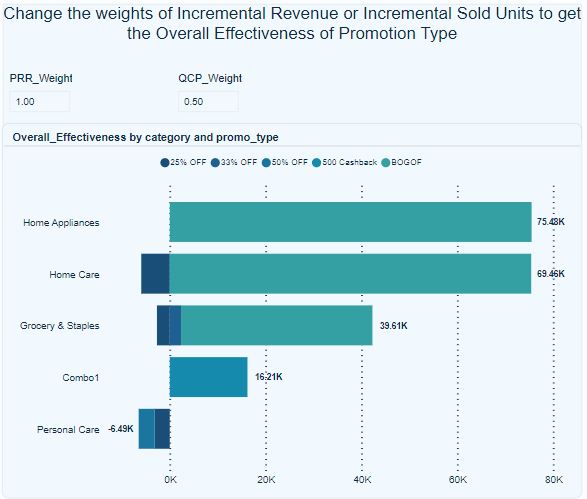
3. What is the correlation between product categoy and promotion type effectiveness?
1. Provide a list of products with base price greater than 500 and that are featured in promo type of 'BOGOF' (Buy One Get One Free).
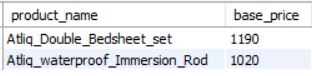
Atliq_Double_Bedsheet_set and Atliq_waterproof_Immersion_Rod are the two products with base price greater than 500 which are featured under BOGOF (Buy One Get One Free) promo type.
SELECT DISTINCT(p.product_name), e.base_price
 FROM fact_events e
JOIN dim_products p
ON p.product_code = e.product_code
WHERE e.base_price >500
AND e.promo_type = 'BOGOF';
2. Generate a report that provides an overview of the number of stores in each city.
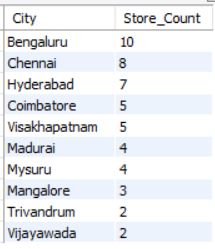
In terms of store count, Bengaluru leads with 10 stores, followed by Chennai with 8 stores, and Hyderabad with 7 stores.
SELECT city AS City, COUNT(DISTINCT(store_id)) AS Store_Count
FROM dim_stores
GROUP BY city
ORDER BY  COUNT(DISTINCT(store_id)) DESC;
3. Generate a report that displays each campaign alogn with the total revenue generated before and after the campaign?

Diwali campaign generated the highest incremental revenue at 114.25 million, while the Sankranthi campaign yielded 72.20 million.
-- For the purpose of convenience I have changed the column names as below.
ALTER TABLE fact_events
RENAME COLUMN `quantity_sold(before_promo)` TO quantity_sold_before_promo;

ALTER TABLE fact_events
RENAME COLUMN `quantity_sold(after_promo)` TO quantity_sold_after_promo;
-- Add a new column Total_Quantity_After_promo to the fact_events table.
-- Populate it with the calculated values based on the given condition.
ALTER TABLE fact_events
ADD Total_Quantity_After_promo INT; -- Assuming Total_Quantity_After_promo is an integer value
UPDATE fact_events
SET Total_Quantity_After_promo =
CASE
WHEN promo_type = 'BOGOF' THEN quantity_sold_after_promo * 2
ELSE quantity_sold_after_promo
END;-- Get the report that displays each campaign alogn with the total revenue generated before, after the campaign and incremental revenue.
WITH REVENUE AS(
SELECT
c.campaign_name,
ROUND(SUM(e.base_price * e.quantity_sold_before_promo) / 1000000,2) AS 'Before_Campaign_Total_Revenue_Million',
ROUND(
SUM(
CASE
WHEN e.promo_type = '25% OFF' THEN (e.base_price * e.Total_Quantity_After_promo) * 0.75
WHEN e.promo_type = '33% OFF' THEN (e.base_price * e.Total_Quantity_After_promo) * 0.67
WHEN e.promo_type = '50% OFF' THEN (e.base_price * e.Total_Quantity_After_promo) * 0.50
WHEN e.promo_type = '500 Cashback' THEN (e.base_price * e.Total_Quantity_After_promo) - 500
WHEN e.promo_type = 'BOGOF' THEN (e.base_price * (e.Total_Quantity_After_promo)) * 0.5
ELSE 0
END
) / 1000000,2) AS 'After_Campaign_Total_Revenue_Million'
FROM fact_events e
JOIN dim_campaigns c
ON e.campaign_id = c.campaign_id
GROUP BY c.campaign_name
)
SELECT *, After_Campaign_Total_Revenue_Million - Before_Campaign_Total_Revenue_Million AS Incremental_Revenue_Million
FROM REVENUE;4. Produce a Report that calculates the Incremental Sold Quantity (ISU%) for each category during the diwali campaign. Additionally, provide rankings for the categories based on their ISU%.
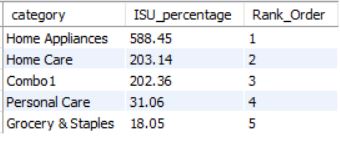
Home Appliances category exhibits the highest ISU% increase, followed by the Home Care and Combo1 categories. Notably, there is a remarkable 588% ISU% surge in the Home Appliances category, while Home Care is at 203.14%, Combo1 follows closely behind with a 202.36% increase.
WITH Diwali_Campaign AS (
    SELECT
        p.category,
        SUM(e.Total_Quantity_After_promo) AS total_quantity_sold_after_promo
    FROM fact_events e
    JOIN dim_campaigns c
    ON e.campaign_id = c.campaign_id
    JOIN dim_products p
    ON e.product_code = p.product_code
    WHERE c.campaign_name = 'Diwali'
    GROUP BY p.category
),
Total_Sold_Before AS (
    SELECT
        p.category,
        SUM(e.quantity_sold_before_promo) AS total_quantity_sold_before_promo
    FROM fact_events e
    JOIN dim_campaigns c
    ON e.campaign_id = c.campaign_id
	JOIN dim_products p
    ON e.product_code = p.product_code
	WHERE c.campaign_name = 'Diwali'
    GROUP BY p.category
)
SELECT
    tsb.category,
    ROUND(((dc.total_quantity_sold_after_promo - tsb.total_quantity_sold_before_promo) * 100) / tsb.total_quantity_sold_before_promo,2) AS ISU_percentage,
    RANK() OVER (ORDER BY
					ROUND(((dc.total_quantity_sold_after_promo - tsb.total_quantity_sold_before_promo) * 100) / tsb.total_quantity_sold_before_promo,2)
				DESC) AS Rank_Order
FROM Diwali_Campaign dc
JOIN Total_Sold_Before tsb
ON dc.category = tsb.category;
5. Create a report featuring the Top 5 products, ranked by Incremental Revenue Percentage (IR%), across all campaigns.
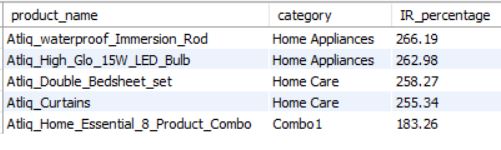
Atlique_waterproof_Immersion_Rod leads with an IR% of 266.19%, closely followed by Atliq_High_Glo_15W_LED_Bulb with an IR% of 262.98%.
Atliq_Double_Bedsheet_Set, Atliq_Curtains, Atliq_Home_Essential_8_Product_Combo made significant contribution to revenue generation.
WITH Total_Revenue AS (
    SELECT
        p.product_name,
        p.category,
        SUM(e.base_price * e.quantity_sold_before_promo) AS 'Before_Campaign_Total_Revenue',
		SUM(
			CASE
				WHEN e.promo_type = '25% OFF' THEN (e.base_price * e.Total_Quantity_After_promo) * 0.75
				WHEN e.promo_type = '33% OFF' THEN (e.base_price * e.Total_Quantity_After_promo) * 0.67
				WHEN e.promo_type = '50% OFF' THEN (e.base_price * e.Total_Quantity_After_promo) * 0.50
				WHEN e.promo_type = '500 Cashback' THEN (e.base_price * e.Total_Quantity_After_promo) - 500
				WHEN e.promo_type = 'BOGOF' THEN (e.base_price * (e.Total_Quantity_After_promo)) * 0.5
				ELSE 0
			END
		) AS 'After_Campaign_Total_Revenue'
    FROM fact_events e
	JOIN dim_products p
    ON e.product_code = p.product_code
    GROUP BY p.product_name, p.category
)
SELECT
    product_name,
    category,
    ROUND(((After_Campaign_Total_Revenue - Before_Campaign_Total_Revenue)* 100 / Before_Campaign_Total_Revenue) ,2) AS IR_percentage
FROM Total_Revenue
ORDER BY ROUND(((After_Campaign_Total_Revenue - Before_Campaign_Total_Revenue)* 100 / Before_Campaign_Total_Revenue) ,2) DESC
LIMIT 5;Thanks to Codebasics for providing this wonderful challenge.
Here is the link to this challenge: CodeBasics Resume Project Challenge
Team provided 4 CSV files. Below is information regarding the columns described in the CSV files:
- dim_campaigns
- dim_products
- dim_stores
- fact_events
- campaign_id: Unique identifier for each promotional campaign.
- campaign_name: Descriptive name of the campaign (e.g., Diwali, Sankranti).
- start_date: The date on which the campaign begins, formatted as DD-MM-YYYY.
- end_date: The date on which the campaign ends, formatted as DD-MM-YYYY.
- product_code: Unique code assigned to each product for identification.
- product_name: The full name of the product, including brand and specifics (e.g., quantity, size).
- category: The classification of the product into broader categories such as Grocery & Staples, Home Care, Personal Care, Home Appliances, etc.
- store_id: Unique code identifying each store location.
- city: The city where the store is located, indicating the geographical market.
- event_id: Unique identifier for each sales event.
- store_id: Refers to the store where the event took place, linked to the dim_stores table.
- campaign_id: Indicates the campaign under which the event was recorded, linked to the dim_campaigns table.
- product_code: The code of the product involved in the sales event, linked to the dim_products table.
- base_price: The standard price of the product before any promotional discount.
- promo_type: The type of promotion applied (e.g., percentage discount, BOGOF(Buy One Get One Free), cashback).
- quantity_sold(before_promo): The number of units sold in the week immediately preceding the start of the campaign, serving as a baseline for comparison with promotional sales.
- quantity_sold(after_promo): The quantity of the product sold after the promotion was applied.
MySQL to find answers to business questions. Power BI for data visualization and dashboard creation. Excel for data preprocessing and transformation.
- Imported the extracted data (csv file) into Excel for initial preprocessing.
- Cleaned and transformed the data as needed, ensuring consistency and accuracy.
- Added Tier column to cities for extra input.
Note: A database named retail_events_db includes all the tables mentioned above. This was used while writing SQL queries to find answers to business questions.
Click image to view pdf
- Designed the data model in Power BI, ensuring the relationships between tables is correct.
- Performed required transformations of data.
- Changed the Removed Atliq_from products for better visualization.
- Utilized Power BI's visualization tools to create interactive and insightful dashboards.
- Incorporated relevant charts, graphs, and slicers to analyze sales performance, campaign effectiveness, and product trends.
- Extracted data from the MySQL database by crafting SQL queries tailored to the specific data requirements.
- Formulated SQL queries to retrieve essential information for fulfilling Business Requests effectively.
- Ensured data accuracy by cross-referencing and validating the query results with visualizations generated in Power BI.
Created a presentation and video using Canva to provide a visually appealing and comprehensive submission.
By leveraging MySQL, Power BI, and Excel, I was able to build a comprehensive dashboard that provides valuable insights into sales performance and marketing campaign effectiveness, facilitating data-driven decision-making.