A tool for producing virtualplant.org style genesect analyses in R
Genesect analyses are a useful technique for comparing the overlap of sets of genes. These analyses can perform pairwise comparisons between sets, giving the direction, magnitude, and statistical significance of these overlaps. This package uses one-tailed Fisher Exact Tests to calculate the odds-ratio and p-value for set overlaps and plot locations to indicate enrichment or depletion.
Similar analyses are available in the web-based utilities virtualplant.org and connectf.org.
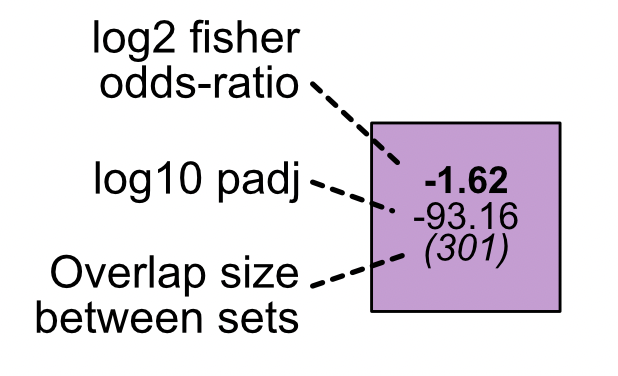
Magnitude is shown through the log2 transformed Fisher odds-ratio. Significance is shown as the log10 transformed adjusted p-value. Gene overlap between sets is shown in parentheses.
Data are plotted as a square matrix, with the lower left and upper right sections showing depleted and enriched overlaps, respectively. Interactions are only plotted in one of these sections, so an overlap with an odd ratio > 1 would only shown in the upper triangle with the equivalent comparison left blank in the lower triangle
This tools is simply installed using the devtools libraries in R.
if(!require(devtools)) install.packages("devtools")
library(devtools)

install_github("NateyJay/genesectR")
Function inputs include a list of vectors comprised of the gene-sets that you want to compare. The second input is a master set of all genes in the transcriptome, provided as a vector.
Note: any gene names in your sets that are not contained in the master list will be filtered.
Here is a simple example of the syntax for a basic run:
require(stringr)

# formatting fake input data
master_set <- c(str_glue("Gene_{1:1000}"))

# The set list is composed of character vectors of items found in the master set. Vector names will shown as labels.
ls <- list(Set_A= sample(master_set, 300),
         Set_B= sample(master_set, 27),
         Set_C= sample(master_set, 99))

str(ls) # this should show a list with 3 lines, each named by the set names above

# performing analysis and plotting
gs <- gs_import(ls, master_set)
gs <- gs_compute_matricies(gs)
gs_plot_fischer(gs, breaks=3) # breaks is a vector which inserts spaces before the indexed boxes
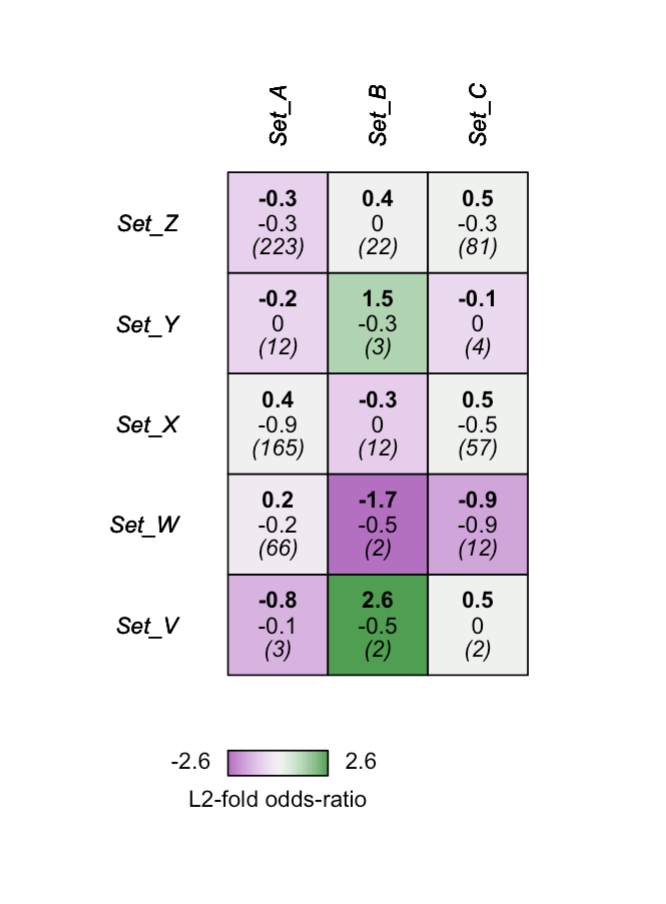
While the standard genesect is useful for uniformly comparing several sets, it can become unwieldy when comparing a large number of sets. Additionally, in some experiments you may not be interested in an all by all comparison, and may just want to compare two groups of sets.
# making trivial test data.
# ABC will be compared against WXYZ
master_set <- str_glue("Gene_{1:1000}")

ls <- list(Set_A= sample(master_set, 300),
           Set_B= sample(master_set[1:100], 27),
           Set_C= sample(master_set, 99),
           Set_V= sample(master_set[1:100], 15),
           Set_W= sample(master_set, 201),
           Set_X= sample(master_set, 500),
           Set_Y= sample(master_set, 44),
           Set_Z= sample(master_set, 766))

# imports are performed as normal
gs <- gs_import(ls, master_set)
gs <- gs_compute_matricies(gs)

# here we supply a vector of lists showing which sets should be plotted along the y-axis.
gs_multi_plot(gs, c("Set_V","Set_W","Set_X","Set_Y","Set_Z"))


