A new set of tools that will allow users to visualize United States Geological Survey (USGS) earthquake data.
Welcome to the United States Geological Survey, or USGS for short! The USGS is responsible for providing scientific data about natural hazards, the health of our ecosystems and environment; and the impacts of climate and land-use change. Their scientists develop new methods and tools to supply timely, relevant, and useful information about the Earth and its processes.
Your first task is to visualize an earthquake data set.
Dats Source
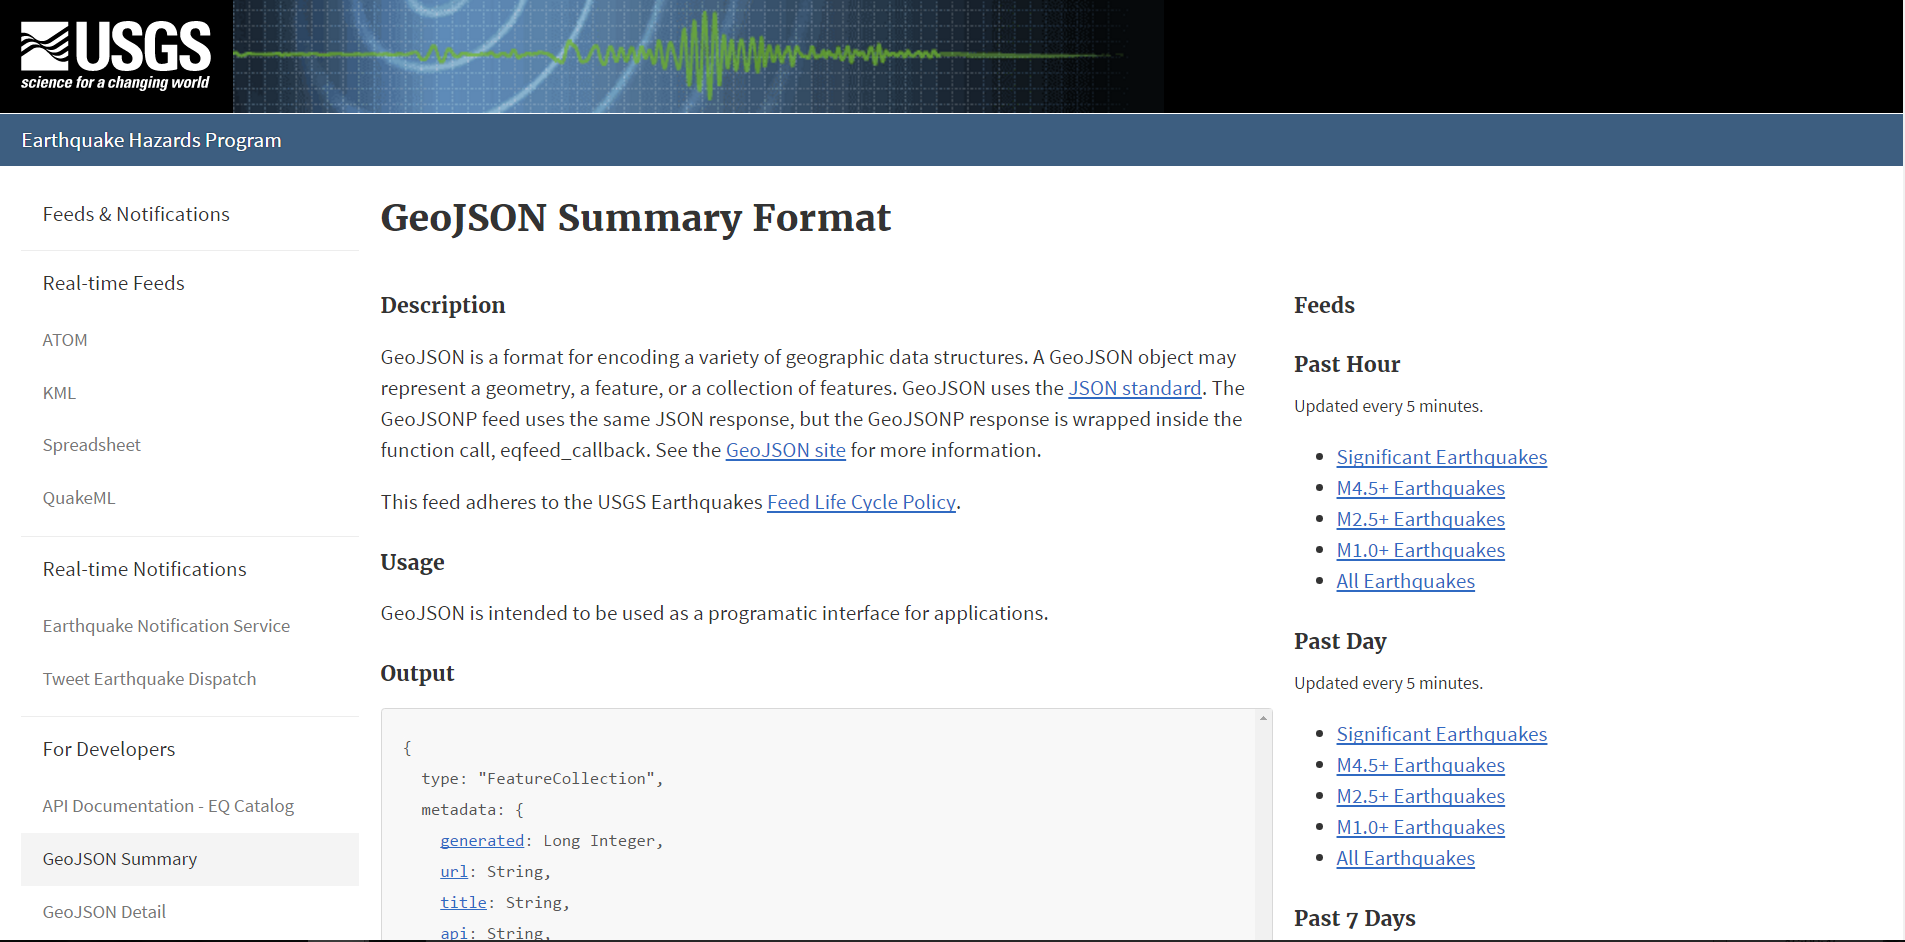
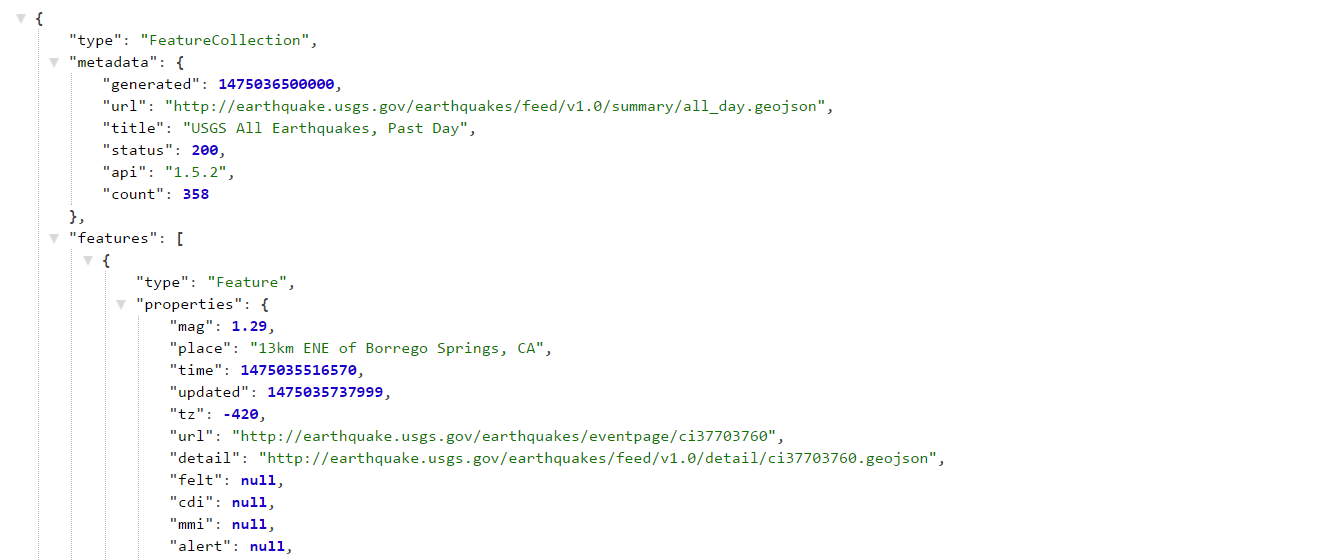
The USGS provides earthquake data in a number of different formats, updated every 5 minutes. Visit the USGS GeoJSON Feed page and pick a data set to visualize. When you click on a data set, for example 'All Earthquakes from the Past 7 Days', you will be given a JSON representation of that data. You will be using the URL of this JSON to pull in the data for our visualization.
-
Import & Visualize the Data
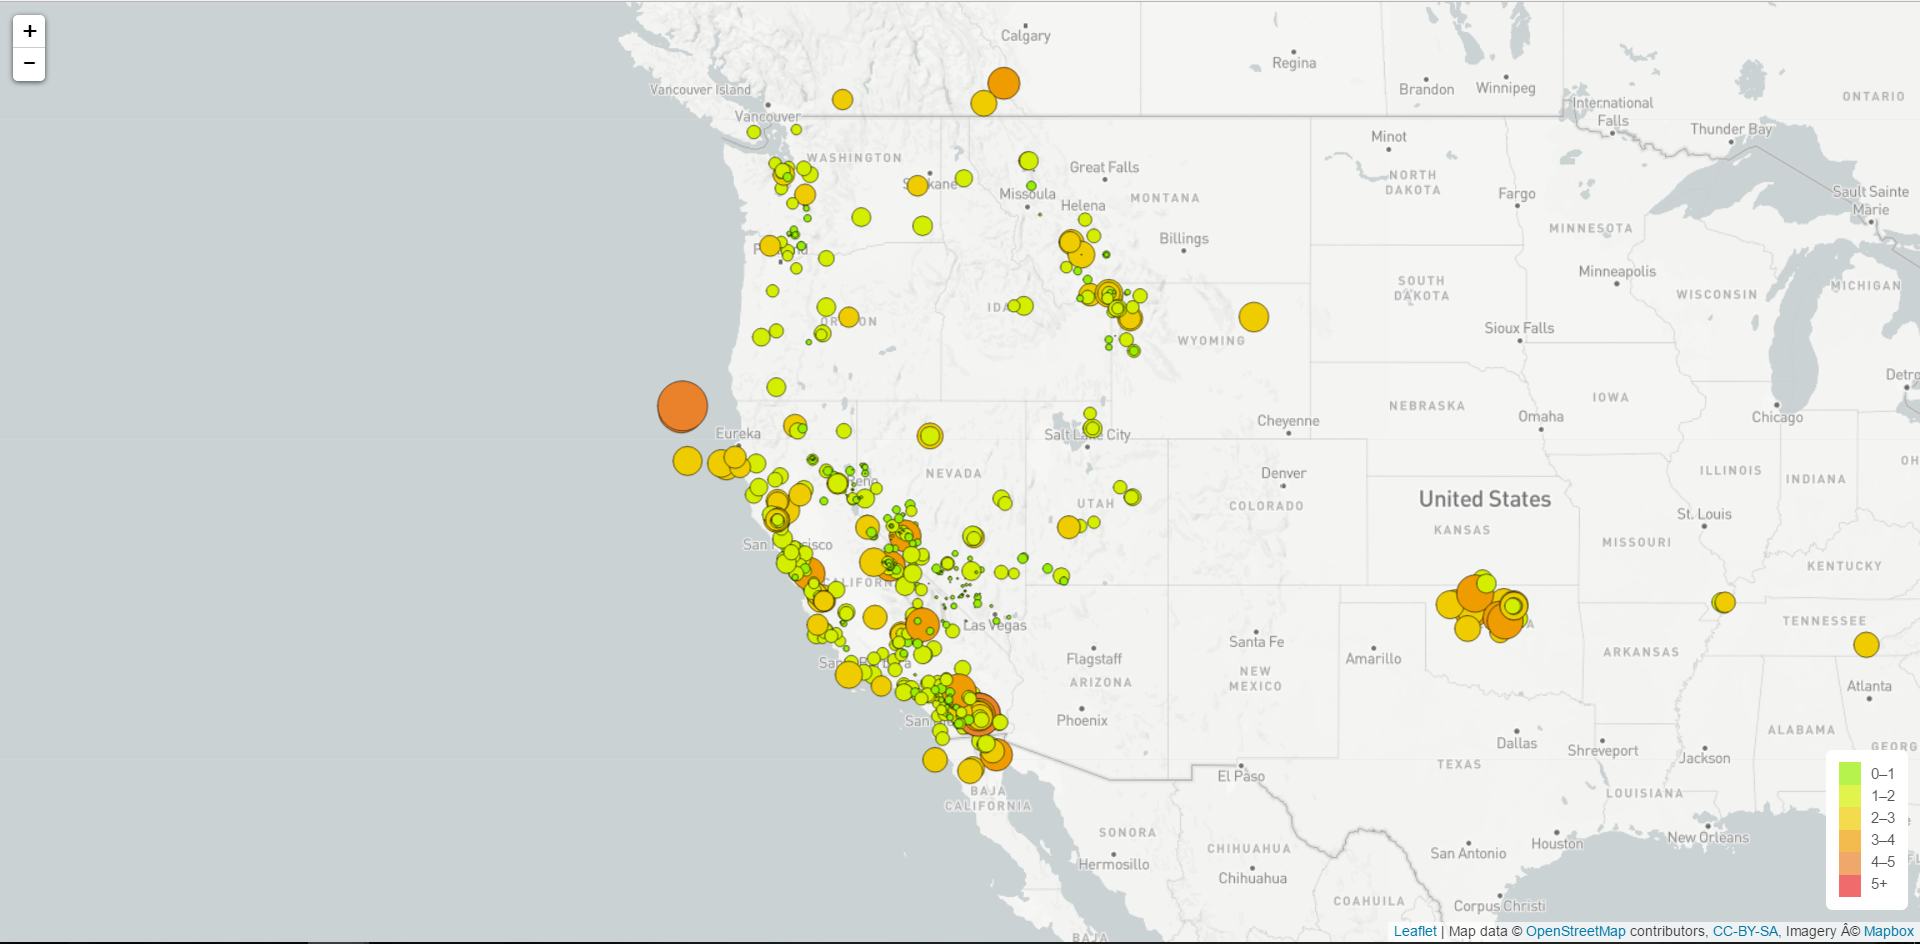
Create a map using Leaflet that plots all of the earthquakes from your data set based on their longitude and latitude.
-
Data markers should reflect the magnitude of the earthquake in their size and color. Earthquakes with higher magnitudes should appear larger and darker in color.
-
Include popups that provide additional information about the earthquake when a marker is clicked.
-
Create a legend that will provide context for your map data.
-
Visualization should look something like the map above.
-
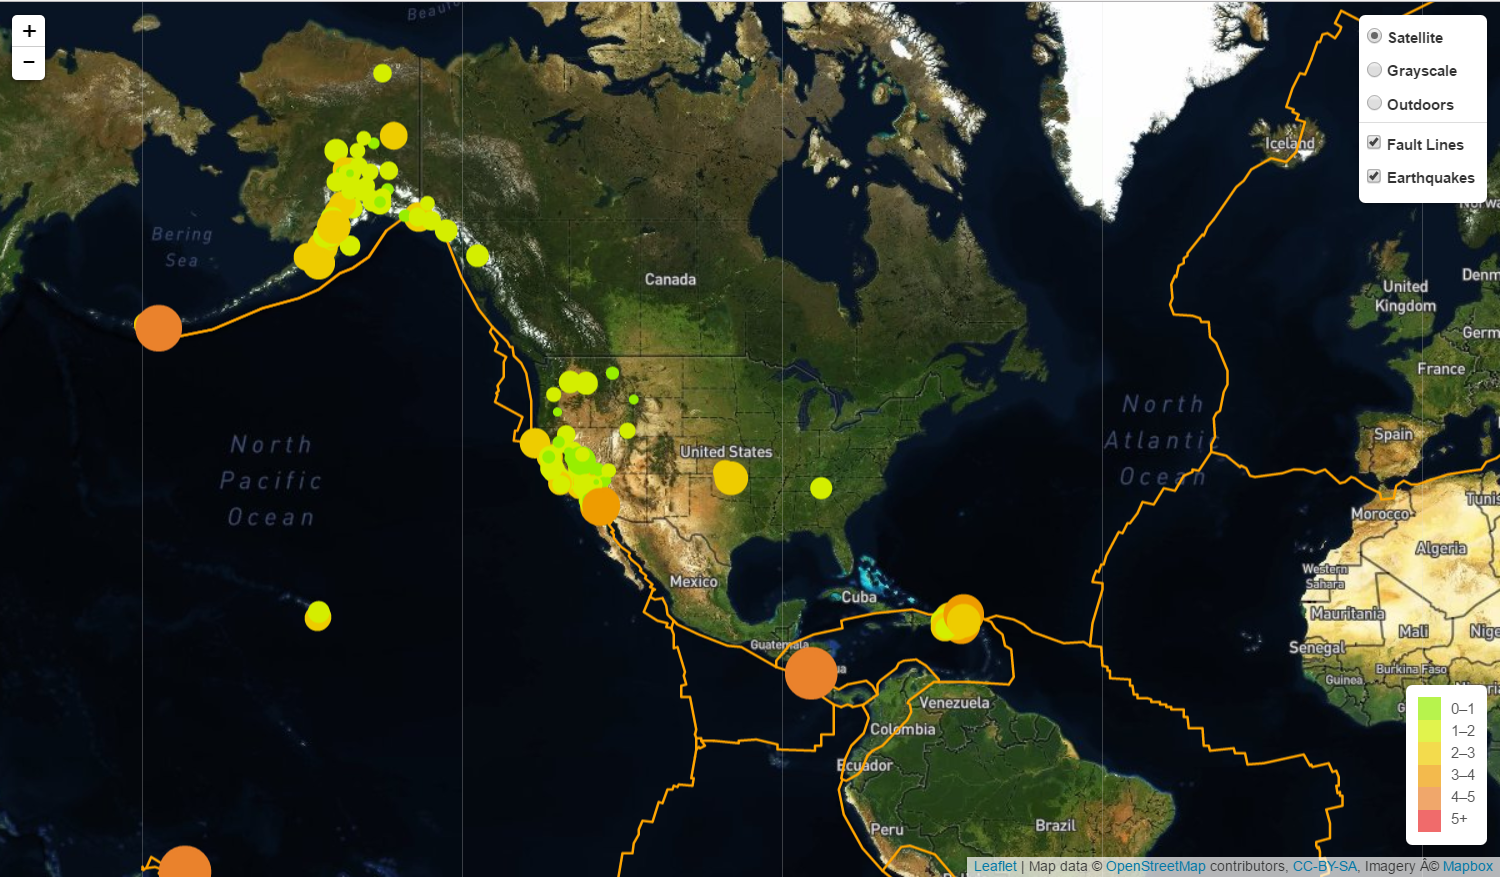
Plot a second data set on your map to illustrate the relationship between tectonic plates and seismic activity. We will need to pull in a second data set and visualize it along side your original set of data. Data on tectonic plates can be found at https://github.com/fraxen/tectonicplates.
In this step we are going to..
-
Plot a second data set on our map.
-
Add a number of base maps to choose from as well as separate out our two different data sets into overlays that can be turned on and off independently.
-
Add layer controls to our map.


