Discriminating Bacterial Phenotypes at the Population and Single-Cell Level: A Comparison of Flow Cytometry and Raman Spectroscopy Fingerprinting
This repository accompanies the manscript "Discriminating Bacterial Phenotypes at the Population and Single-Cell Level: A Comparison of Flow Cytometry and Raman Spectroscopy Fingerprinting" by C. Garcia-Timermans, P. Rubbens, R. Props, F.-M. Kerckhof, J. Heyse, A. Skirtach, W. Waegeman and N. Boon.
Investigating phenotypic heterogeneity can help to better understand and manage microbial communities. However, characterizing phenotypic heterogeneity remains a challenge, as there is no standardized analysis framework. Several optical tools are available, such as flow cytometry and Raman spectroscopy, which describe optical properties of the individual cell. In this work, we compare Raman spectroscopy and flow cytometry to study phenotypic heterogeneity in bacterial populations. The growth stages of three replicate Escherichia coli populations were characterized using both technologies. Our findings show that flow cytometry detects and quantifies shifts in phenotypic heterogeneity at the population level due to its high-throughput nature. Raman spectroscopy, on the other hand, offers a much higher resolution at the singlecell level (i.e., more biochemical information is recorded). Therefore, it can identify distinct phenotypic populations when coupled with analyses tailored toward single-cell data. In addition, it provides information about biomolecules that are present, which can be linked to cell functionality. We propose a computational workflow to distinguish between bacterial phenotypic populations using Raman spectroscopy and validated this approach with an external data set. We recommend using flow cytometry to quantify phenotypic heterogeneity at the population level, and Raman spectroscopy to perform a more in-depth analysis of heterogeneity at the single-cell level.
- Analysis performed in R can be found here.
- Analysis in Python (PhenoGraph and t-SNE) can be found in the file
phenograph.pyandplot_tsne_density.py. Results were stored in the directoryClustering_PhenoGraph_k. - Gated flow cytometry data can be found in the directory
FCSfiles_Ecoli2092or on Flowrepository(ID: FR-FCM-ZYV6). - Raw Raman spectra can be found in the directory
Raman_Ecoli2092. Processed Raman data, in .CSV format, can be found in the filehsNorm_RamanSpectra.csv). - Additional validation of PhenoGraph and t-SNE using an external dataset can be found directory
Ramanome_analysis. Data was originally published by Teng et al., 2016.
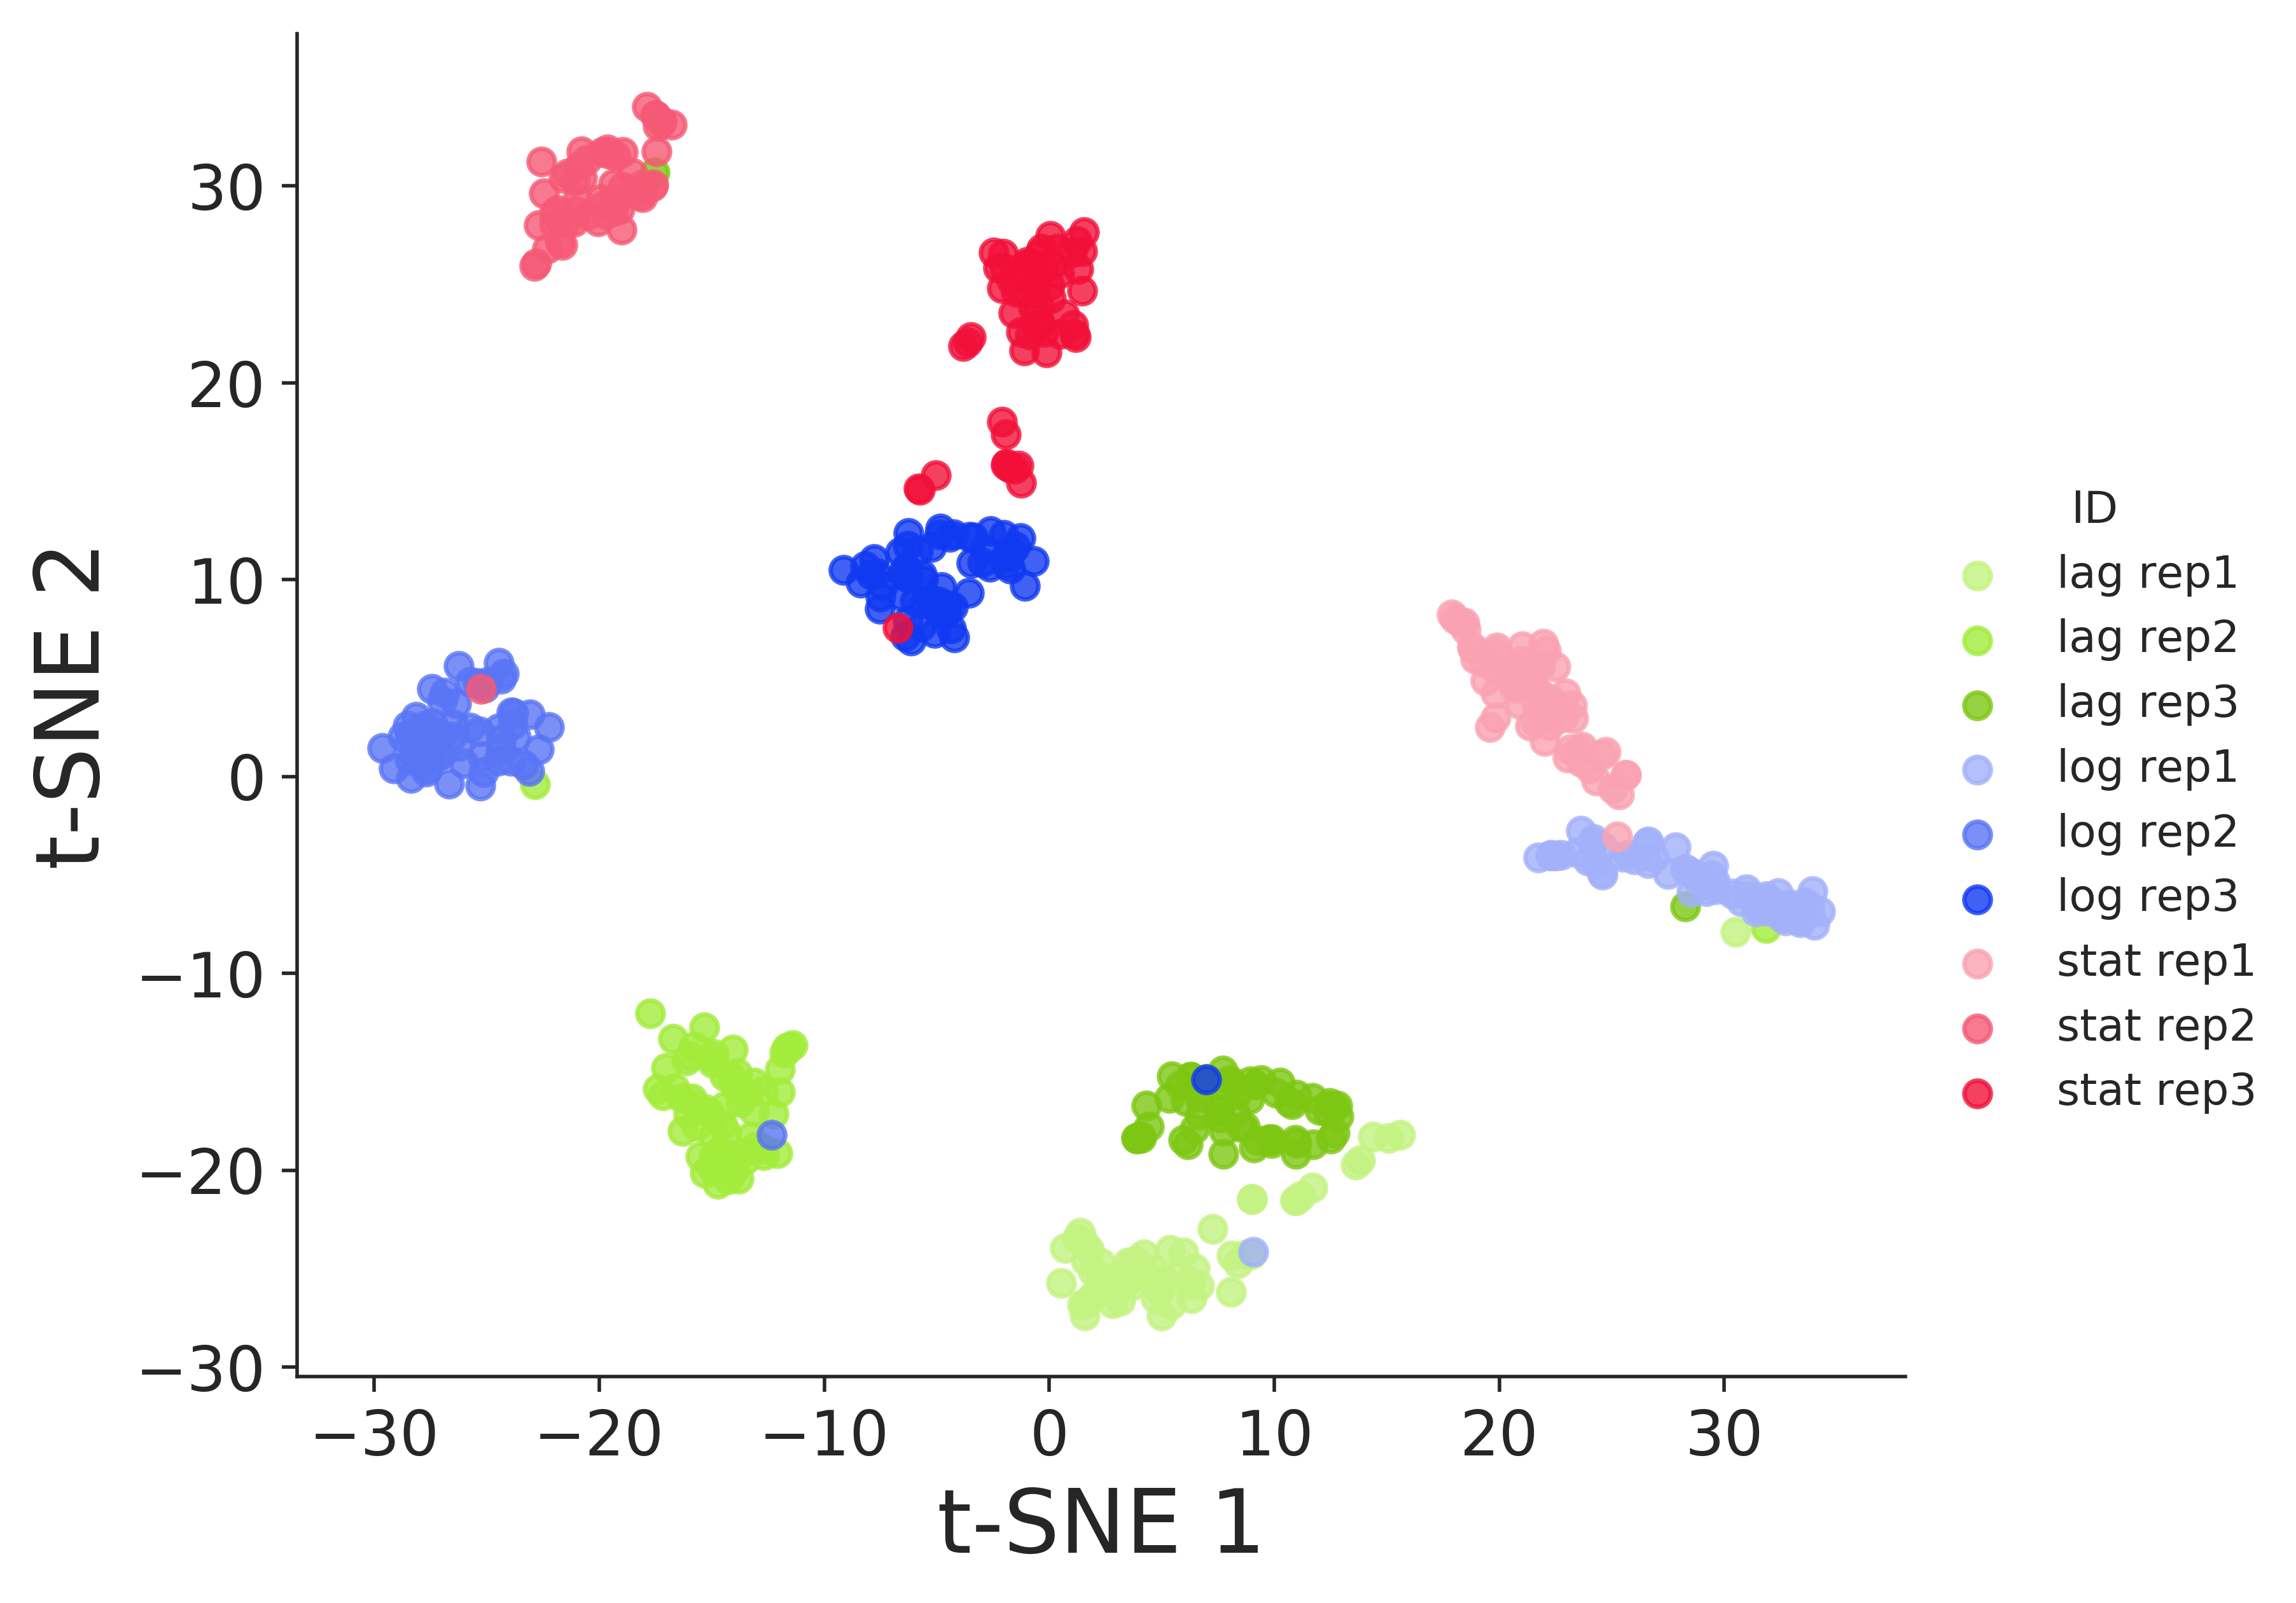
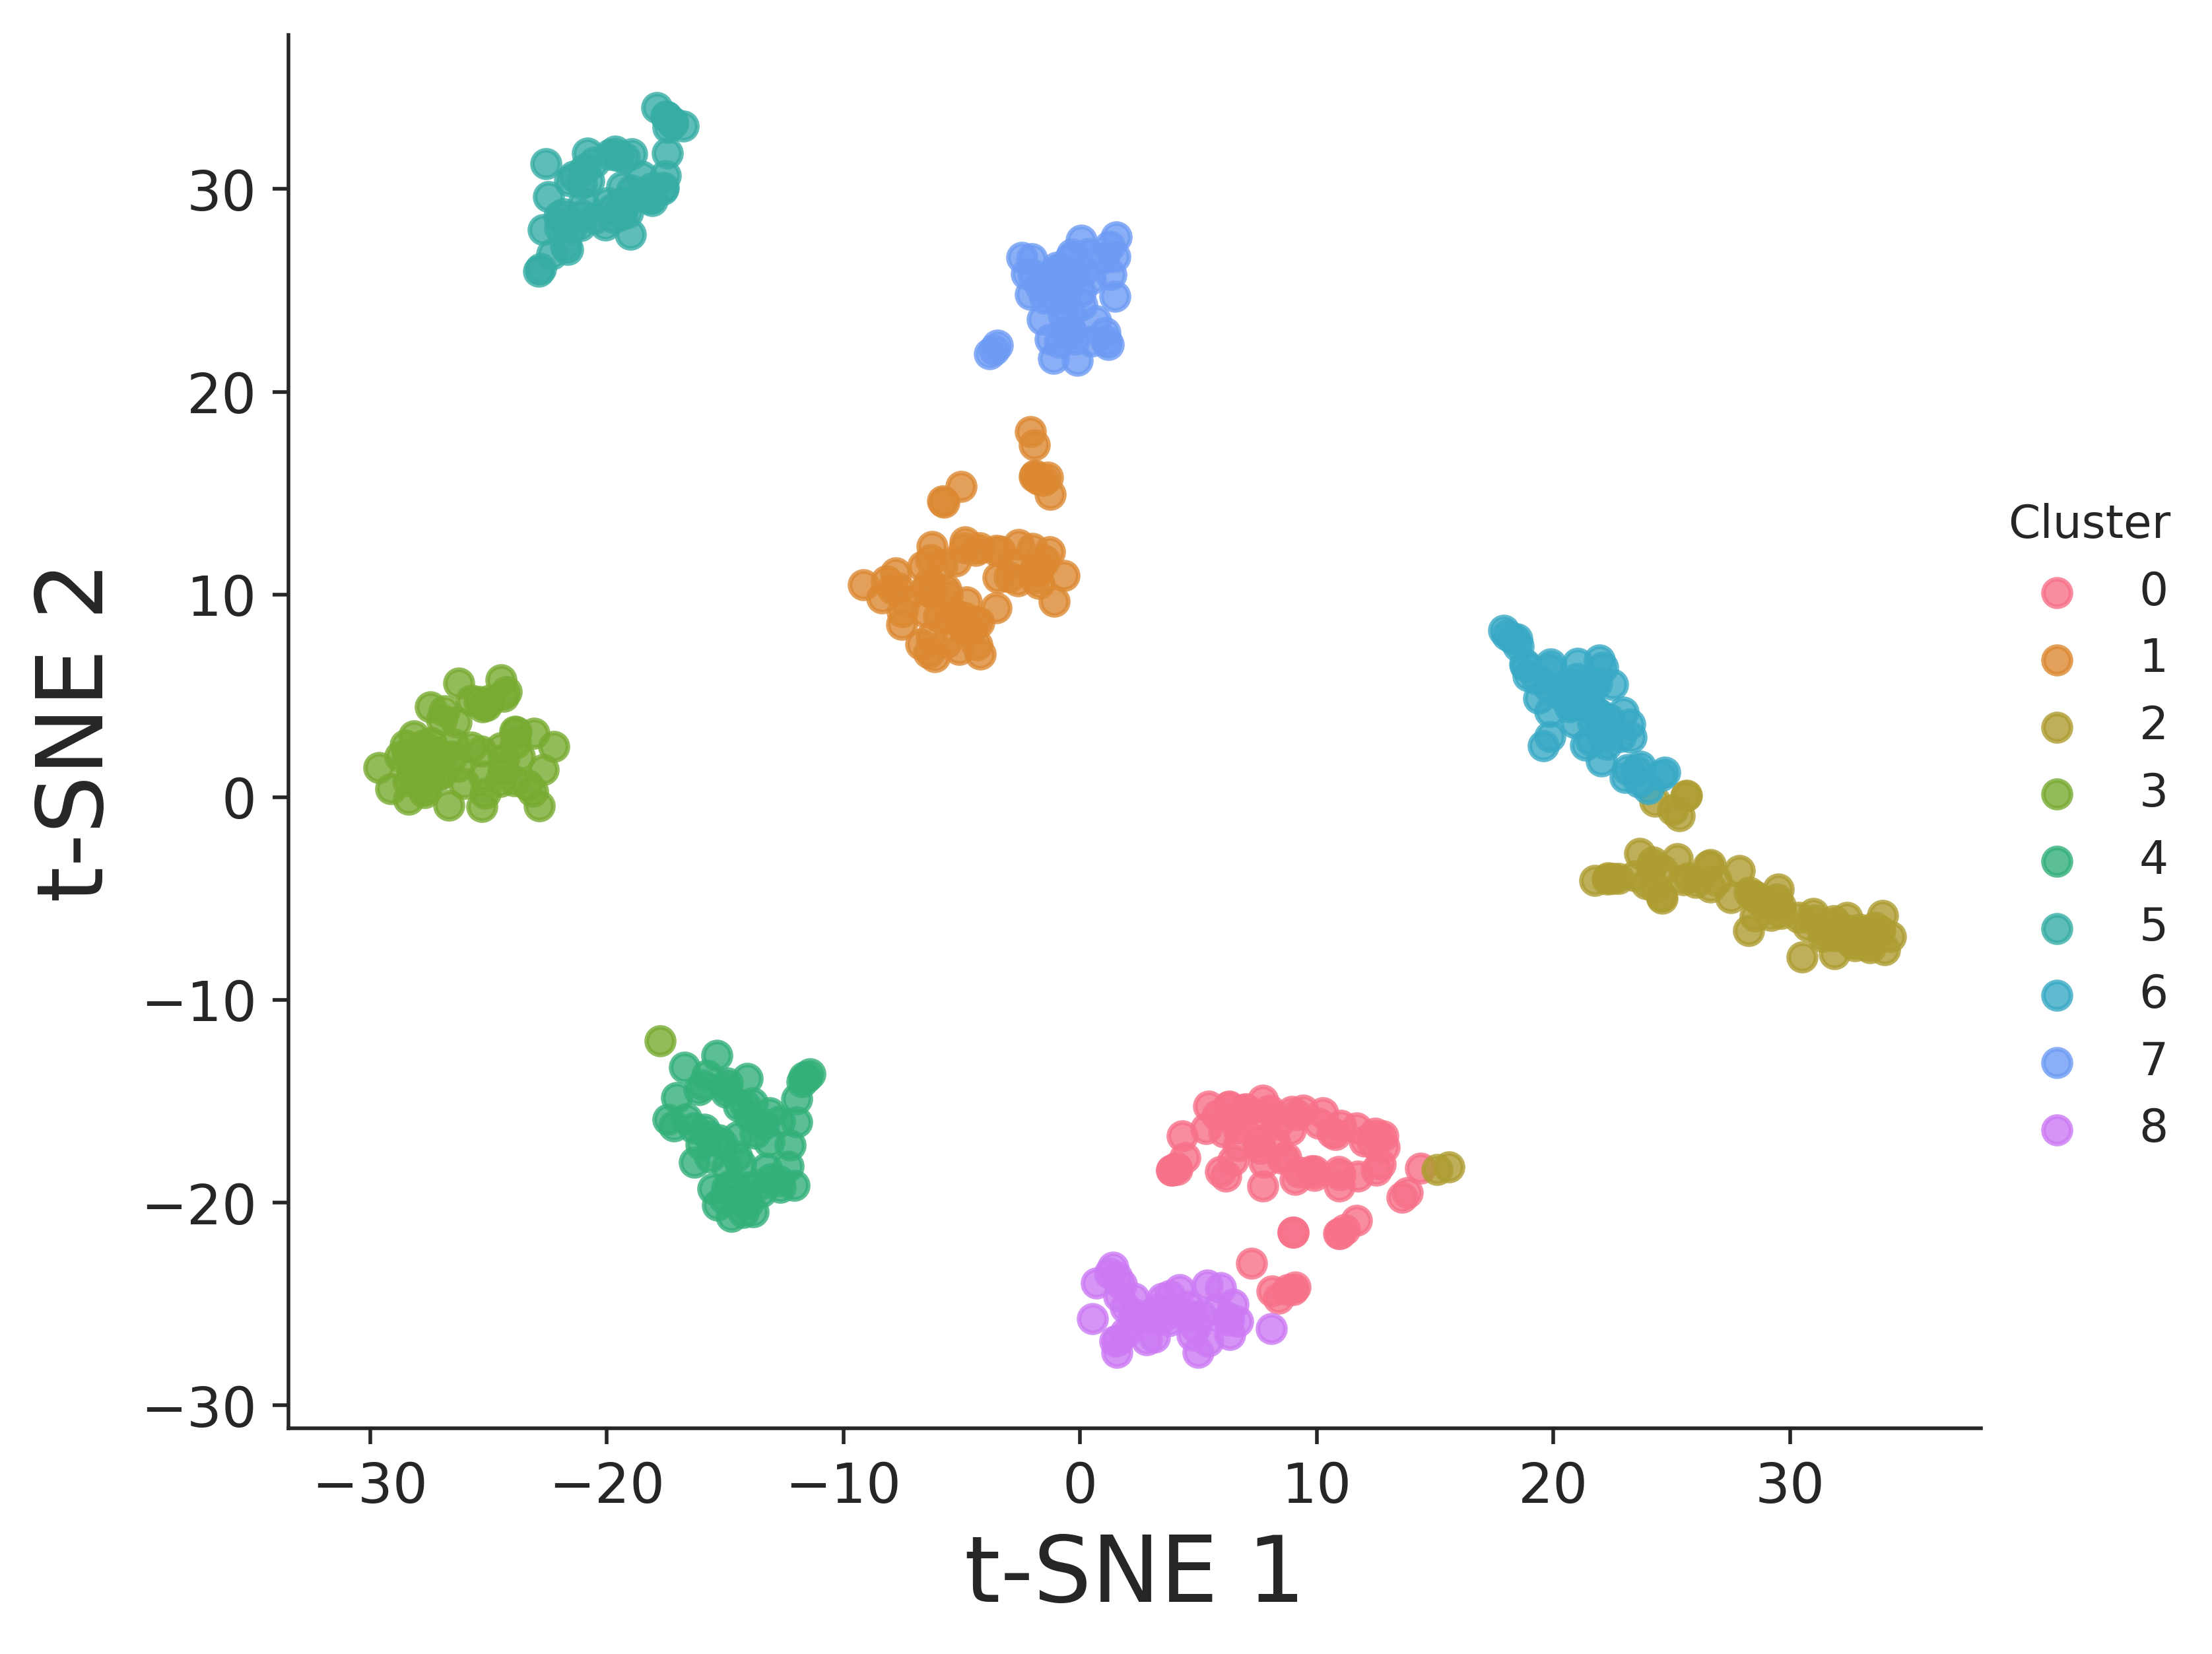
Raman spectroscopy offers a high-resolution characterization of bacterial cells, which can be analyzed with automated algorithms, developed for single-cell data. Here you see an example of a visualization using t-SNE, along with an automated clustering according to the PhenoGraph algorithm:
If you find our study useful, please consider citing:
@Article{García-Timermans2019,
  Title       = {Discriminating Bacterial Phenotypes at the Population and Single-Cell Level: A Comparison of Flow Cytometry and Raman Spectroscopy Fingerprinting},
  Author      = {García-Timermans, C. and Rubbens, P. and Props, R. and Kerckhof, F.-M. and Heyse, J. and Skirtach, A. and Boon, N. and Waegeman, W. },
  Journal     = {Cytometry Part A},
  Year        = {2019},
}
