Dashboards to monitor various metrics with the [CGAT][http://www.cgat.org] programme.
The dashboard has several sections:
- Software - github issues and pull requests, travis build status
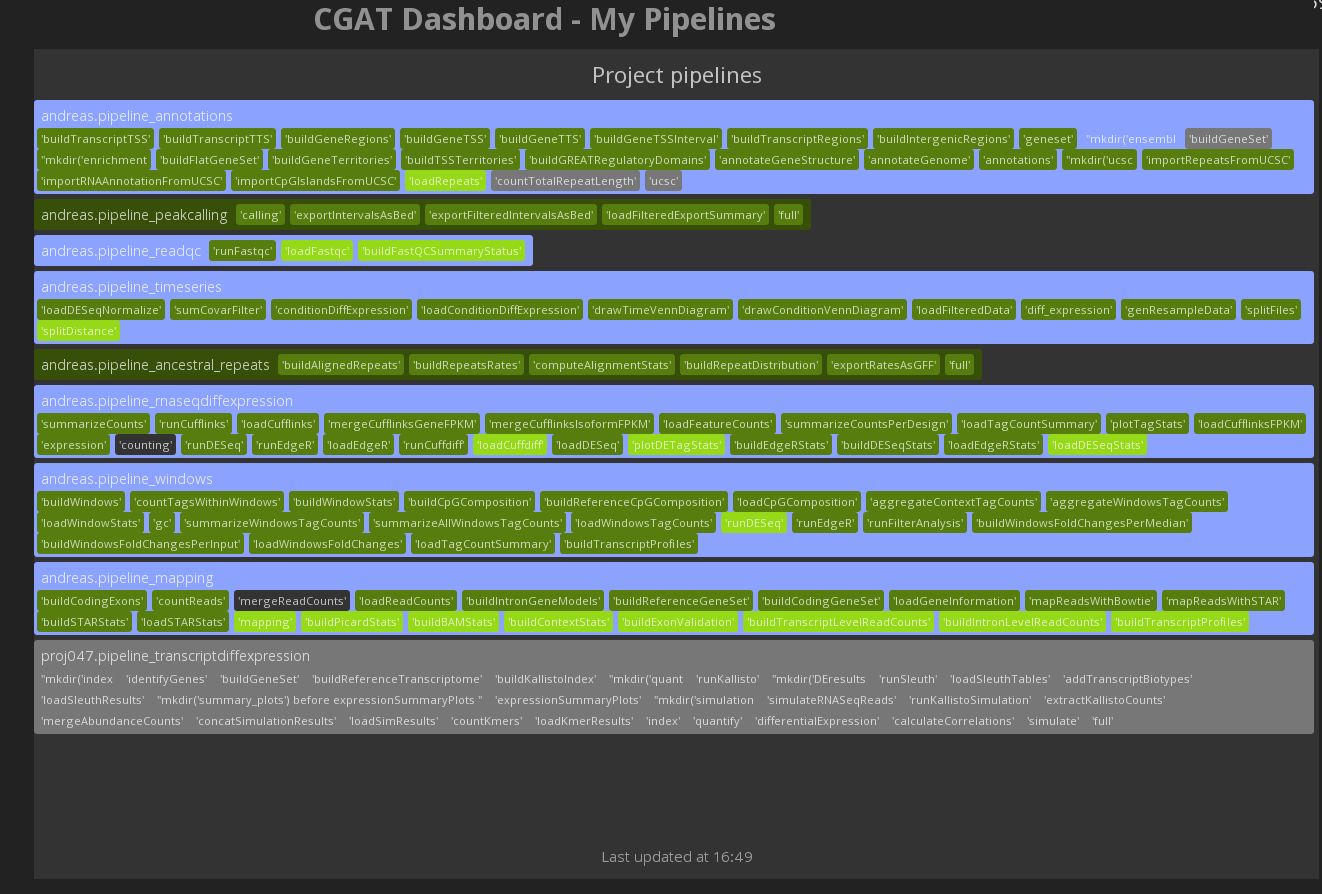
- Pipelines - overview of running CGAT Pipelines
- Projects - monitoring of project email lists and locations
- Cluster - monitoring cluster and disk health
- Science - monitoring publication metrics, twitter, etc.
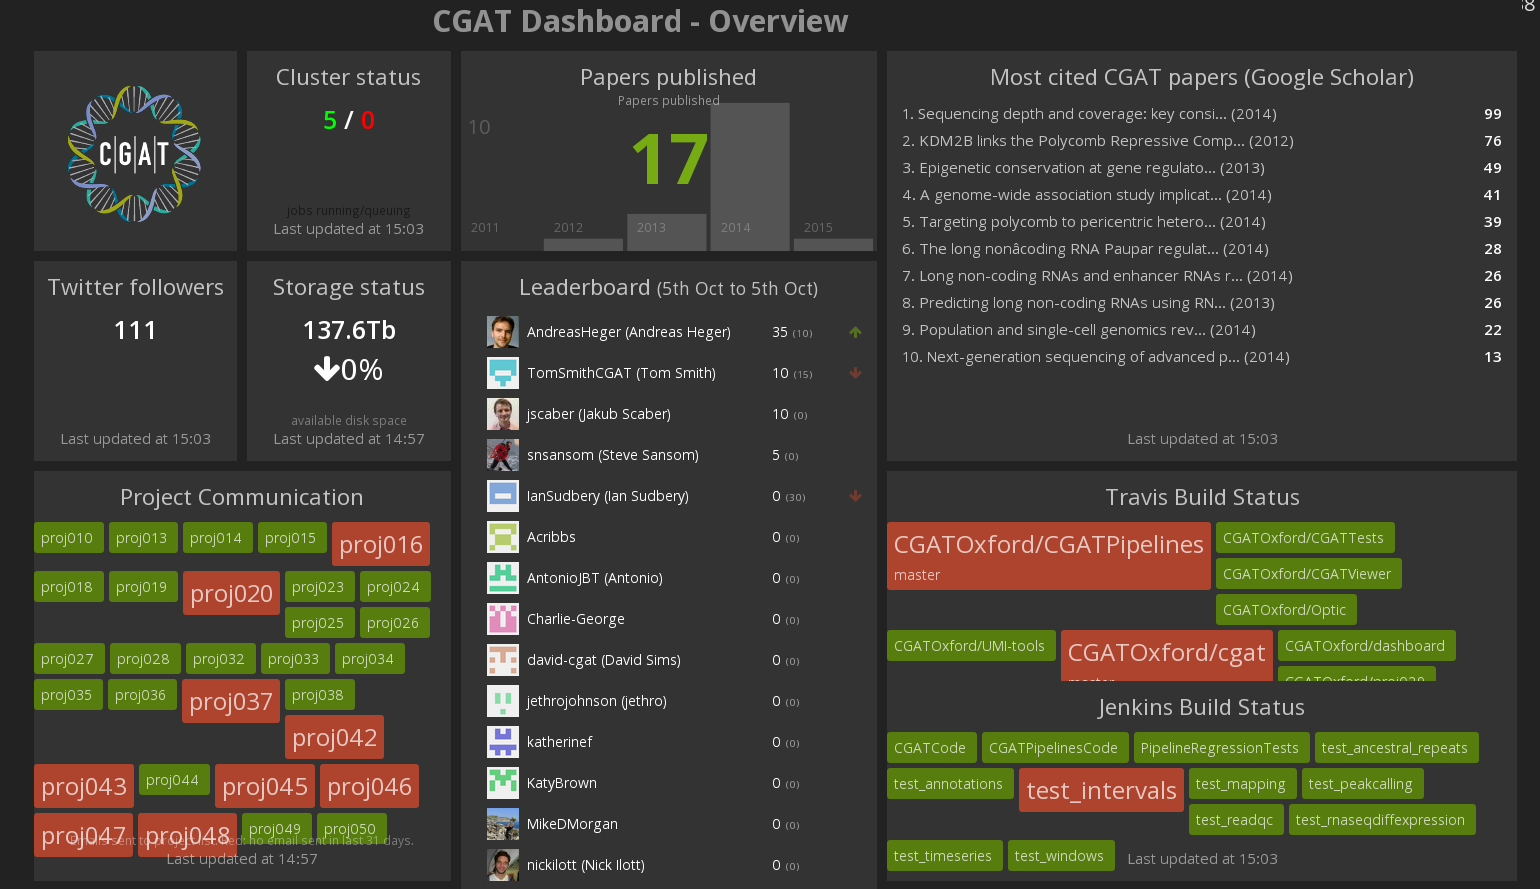
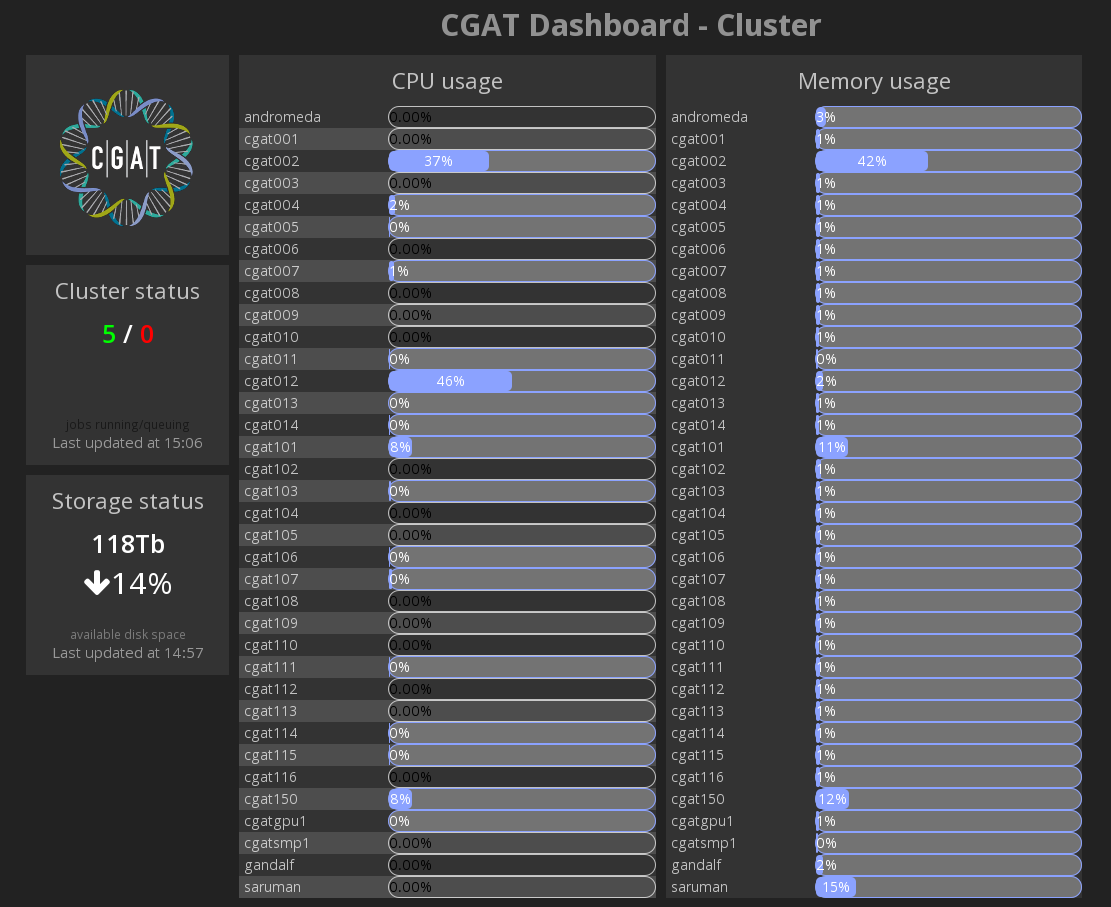
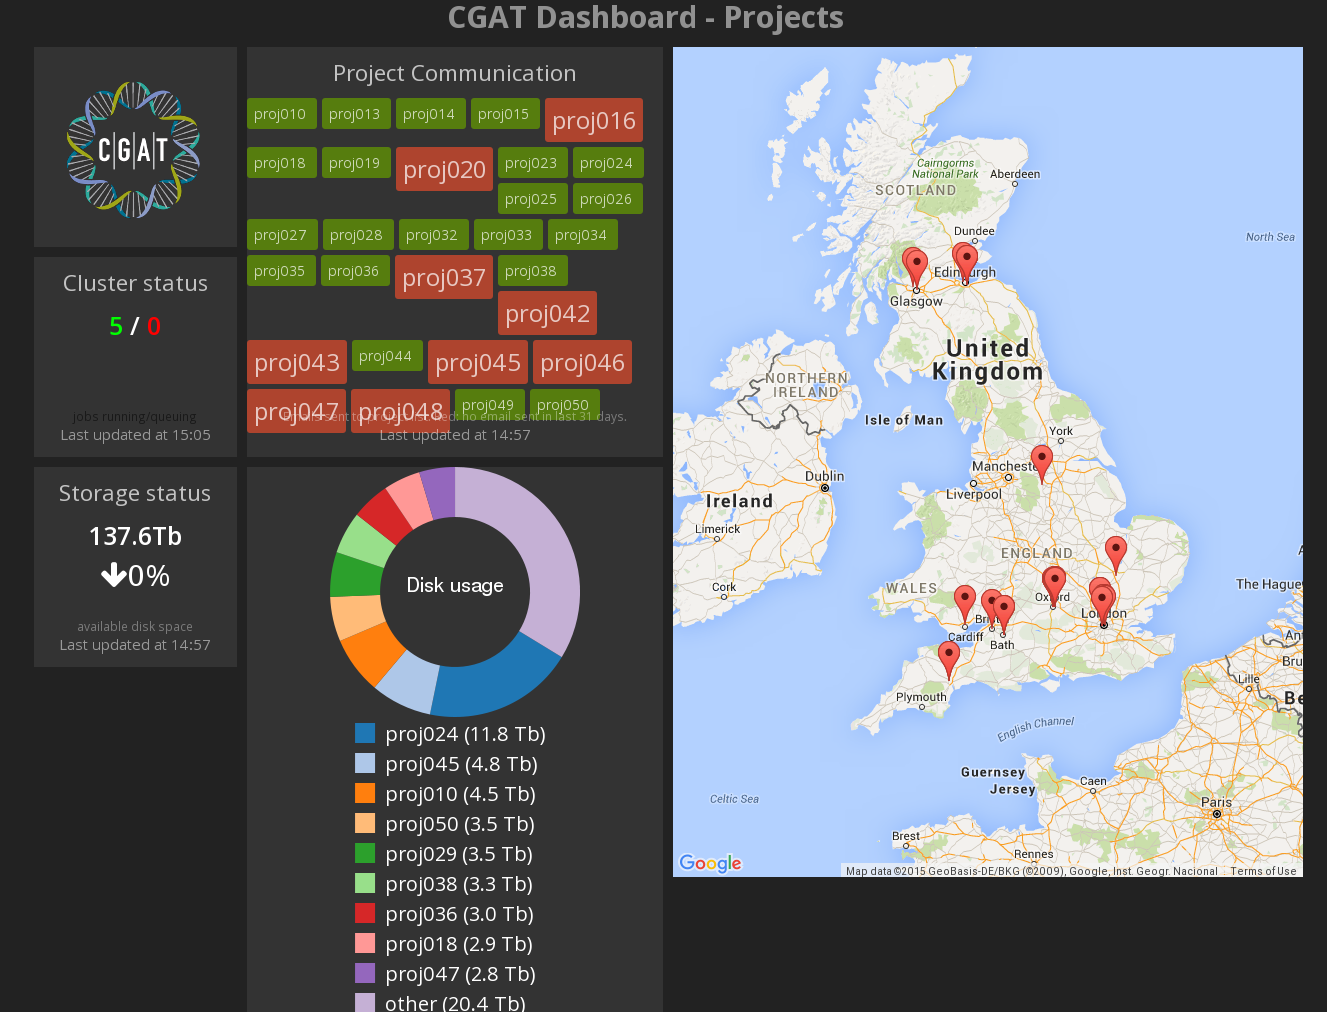
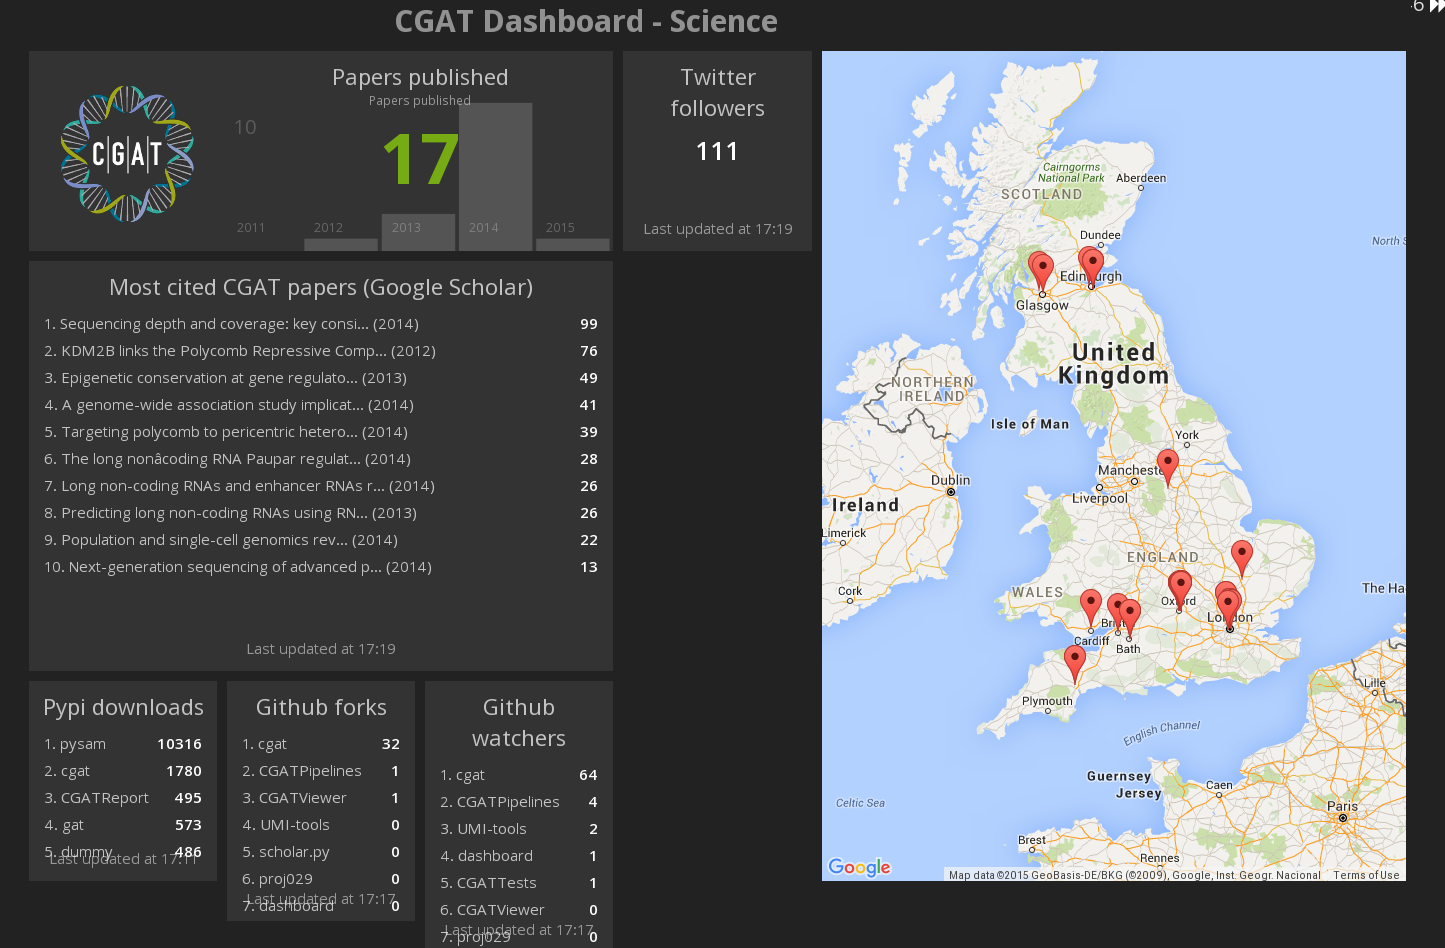
Some screenshots are below:
First install the required dependencies through bundle install.
The current version is tested with ruby 2.1.5. Version 2.2 failed due to some incompatabilities with the json gem.
The project is configured through environment variables set in the .env
file.
All configuration is optional, apart from either ORGAS or REPOS.
-
ORGAS: Github organizations. Separate multiple by comma. Will use all repos for an organization. Example:silverstripe,silverstripe-labs. -
REPOS: Github repository identifiers. Separate multiple by comma. If used alongsideORGAS, the logic will add all mentioned repos to the ones retrieved fromORGAS. Example:silverstripe/silverstripe-framework,silverstripe/silverstripe-cms -
SINCE: Date string, or relative time parsed through http://guides.rubyonrails.org/active_support_core_extensions.html. Example:12.months.ago.beginning_of_month,2012-01-01 -
LEADERBOARD_WEIGHTING: Comma-separated weighting pairs influencing the multiplication of values used for the leaderboard widget score. Example:commits_additions_max=200,commits_additions_loc_threshold=1000,commits_deletions_max=100,commits_deletions_loc_threshold=1000 -
LEADERBOARD_EDITS_WEIGHTING: Comma-separated weighting pairs influencing the leaderboard widget scores based on lines of code added and deleted. Themaxandthresholdvalues ensure the scores stay in reasonable bounds, and don't bias massive edits or additions of third party libraries to the codebase over other metrics. Note that the metrics are collected from the "default branch" in Github only. Example:issues_opened=5,issues_closed=5,pull_requests_opened=10,pull_requests_closed=5,pull_request_comments=1,issue_comments=1,commit_comments=1,commits=20 -
LEADERBOARD_SKIP_ORGA_MEMBERS: Exclude organization members from leaderboard. Useful to track "external" contributions. Comma-separated list oforganization names. -
TRAVIS_BRANCH_BLACKLIST: A blacklist of branches ignored by repo, as a JSON string. This is useful to ignore old branches which no longer have active builds. Example:{"silverstripe-labs/silverstripe-newsletter":["0.3","0.4"]} -
TRAVIS_REPOSITORY_BLACKLIST: A blacklist of repositories to ignore. Example:["pysam"]
The dashboard scans logs from our storage system to check disk usage per project.
PROJECT_IFS_STATS_GLOB, glob expression for Isilon summary files. The most recent report is used.
The dashboard looks up the status of the regression tests on jenkins.
JENKINS_HOST, IP address of jenkins host.
To track the number of citations, we download manually the number of citations from Google Scholar (as html page).
SCHOLAR_GLOB, glob expression for citation lists from Google Scholar. The most recent report is used.
The dashboard uses the public github API, which doesn't require authentication. Depending on how many repositories you're showing, hundreds of API calls might be necessary, which can quickly exhaust the API limitations for unauthenticated use.
In order to authenticate, create a new
API Access Token on your
github.com account, and add it to the .env configuration:
GITHUB_LOGIN=your_login
GITHUB_OAUTH_TOKEN=2b0ff00...................
The dashboard uses the official Github API client for Ruby (Octokit), and respects HTTP cache headers where appropriate to avoid making unnecessary API calls.
Finally, start the dashboard server:
dashing start
Now you can browse the dashboard at http://localhost:3030/default.
Alternatively, type:
rackup -p 3030 -s webrick
The Dashing jobs query for their data whenever the server is started, and then with a frequency of 1h by default.
Pull requests are very welcome! Please make sure that the code you're fixing is actually part of this project, and not just generated from the upstream Dashing library templates.
The original dashboard has been derived from https://github.com/chillu/github-dashing from the SilverStripe CMS.
Distributed under the MIT license
Running dashing in linux but displaying under windows failed. The widgets were displayed, but did not present any data (only on closing). The solution was to use a different server (see Shopify/dashing#235).
To use this, type:
gem install sentry-raven rackup -p 3030 -s webrick

