This notebook uses redshift and maximum apparent magnitude measurements of type Ia Supernovae from the Open Supernova Catalog to estimate the Age of the Universe at 14.1 billion years (within 3% of the generally accepted value: 13.8 billion years).
A type Ia Supernova is a type of supernova which results from the accretion of material by a white dwarf from its companion in binary systems. As the white dwarf gains mass, its temperature increases until it reaches a critical temperature at which runaway Carbon fusion starts. Type Ia supernovae can be distinguished from other types of supernovae by looking at their lightcurve (i.e. apparent magnitude as a function of time).
Because their trigger mechanism always occur in the approximately same conditions, they all have a similar intensity. For this reason, they are known as standard candles and are very useful for measuring the distance to their host galaxy because their apparent magnitude as seen from earth is directly linked to their distance from us.
Thanks to this property and their extreme luminosity, type Ia supernovae can be used to determine the age of the universe by measuring their apparent magnitude and redshift (linked to their velocity away from us caused by the expansion of the universe).
The data is obtained from this Open Supernova Database link.
The first step in this analysis is to convert redshift and apparent magnitude measurements into velocity and distance, respectively. Redshift measurements are converted into velocity using the following special relativity formula: , which can be rewritten as:
, where
is the redshift,
is the velocity of the redshifted object from the observer, and
is the speed of light.
Maximum apparent magnitude measurements are converted into distance from the observer by applying the following definition: , or
, where
and
are the apparent and absolute maximum magnitude of the supernova, respectively,
is its extinction in the visible band and
is its distance in Parsec (pc).
The extinction coefficient, is estimated with the following experimental relationship:
, where
is the color excess defined as the difference between the observed and intrinsic color index B-V (the extinction caused by interstellar dust leads to a decrease in apparent magnitude and a reddening of luminous objects unrelated to redshift).
The typical maximum absolute magnitude () of type Ia supernovae can be known by estimating the distance of relatively close supernovae, which distance are known thanks to other standard candles (e.g. Ceipheid variable stars). In practice, the average absolute magnitude of close (redshift < 0.1) type Ia supernovae from the Open Supernova Database is considered in this analysis (M = -18.8).
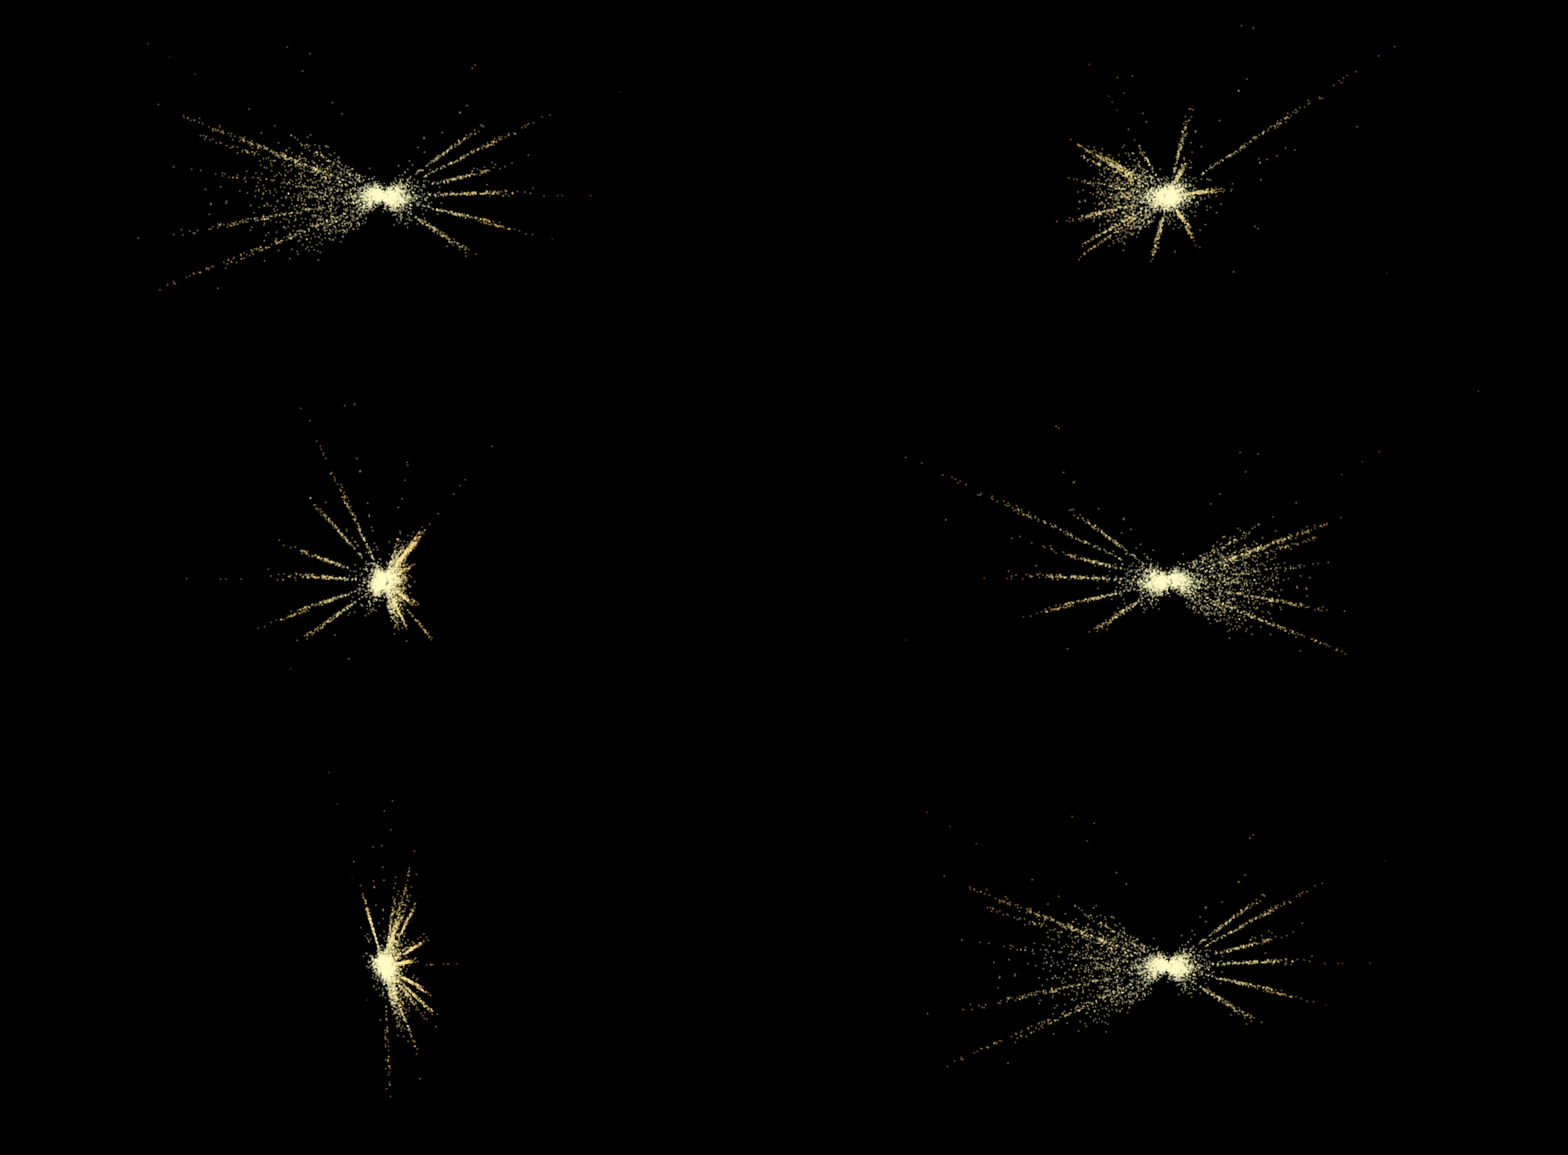
Combined with the coordinates of each event (declination and right ascension), this data allows creating the 3D plot shown at the top of this page, which represents all type Ia supernovae in the Open Supernova Catalog (a dynamic version of this 3D plot created with Plotly is available here). It shows that the further a type Ia supernova is from the Milky Way, the more redshifted it tends to be (represented with a red tint) . This 3D graph also shows that most distant type Ia supernovae are detected in very narrow beams. This is due to the fact that the search for distant supernovae is concentrated in very small regions of the sky (it would be impractical to monitor supernovae in every direction because the search for distant supernovae requires powerful telescopes over long periods of time). In particular, a large fraction of the supernovae have been detected during the Sloan Supernova Survey (2005 - 2007) in a narrow fan beam with a declination centered on the terrestrial equator. Furthermore, this plot clearly shows that few supernovae are detected in the galactic plane due to the strong extinction caused by dust in the Milky Way. This 3D plot required the conversion of declination and right ascension from sexagesimal (i.e. hour:minute:second) to decimal, and then the conversion to carthesian coordinates using the following equations (where is the distance,
is the declination, and
is the right ascension):
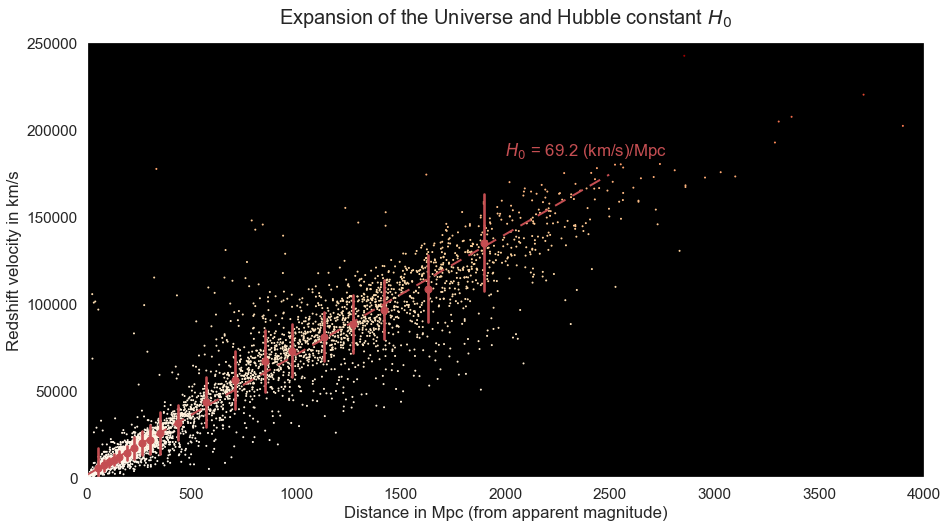
In the graph below, the velocity inferred from redshift is plotted as a function of the distance to the type Ia supernova
Then, the linear relationship between distance and velocity of type Ia supernova is determined using a random sample consensus (RANSAC) algorithm in order to exclude clear outliers from the linear fit. This relationship which corresponds to the expansion rate of the universe per unit distance, is known as the Hubble constant () and is expressed in (km/s)/Mpc. This calculation resulted in an estimate for the Hubble constant of 69.2 (km/s)/MPc, which is very close to the commonly accepted values of this parameter (between 67 and 74 (km/s)/MPc).
The lookback time (i.e. the time since the light was emitted from a luminous object) as a function of redshift is expressed as follows:
, where is the lookback time for a redshift of
,
is the Hubble constant,
is the mass density of the universe,
is the cosmological constant (term caused by the dark energy) and
is the curvature of space.
This equation can be simplified by assuming that the universe is flat () and empty (
), meaning that the universe has been expanding at the constant rate
since the Big Bang and that the observed redshift is not caused by the attraction between massive objects or by dark energy. The equation then becomes:
By integrating the redshift over infinity, we obtain the Age of the Universe according to this simplified model:
This value is within only 3% of the commonly accepted value of 13.8 billion years derived using the Lambda CDM model.
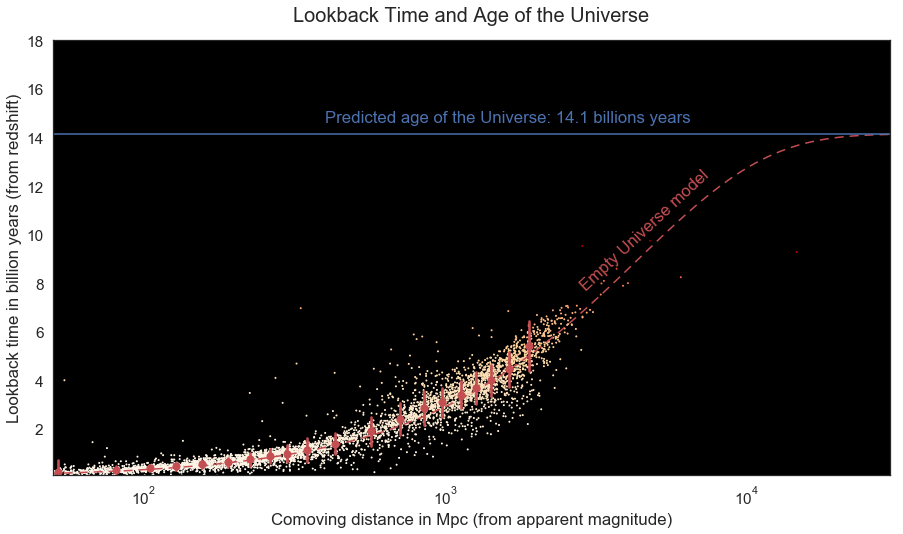
The graph below shows the lookback time of type Ia supernova (calculated using the above simplified equation for based and redshift measurements) as a function of the comoving distance (obtained using maximum apparent magnitude measurements). This graph also displays the lookback time vs distance, predicted by the empty universe model taking into account the following relationship between comoving distance and redshift:
In this graph, when the redshift becomes infinitely large (i.e. for "light" emitted immediately after the Big Bang, when the Universe was infinitely small), the lookback time converges to the predicted age of the Universe (14.1 billion years).
This simplified model is surprisingly accurate to find the lookback time up to now and ultimately, the age of the universe, when compared to the generally accepted Lambda CDM model (,
and
). This is due to the fact that, on average, phases of accelerating expansion of the universe have been canceled out by the action of gravity between massive objects). However, the empty universe model is expected to diverge from the Lambda CDM model in the future as the universe becomes dominated by dark energy, causing it to expand at an exponential rate.
To use this notebook, start by cloning this repository. In addition to the main data science Python libraries (numpy, pandas, seaborn, sklearn, etc...), this notebook requires the installation of the following modules:
- plotly: v3.1.1
-
Open Supernova Catalog: https://sne.space/
-
Distance measures in cosmology, David W. Hogg: https://arxiv.org/pdf/astro-ph/9905116.pdf
-
Thank you to Zoni Nation who worked on a similar project using Galaxy data for giving me the inspiration for this project


