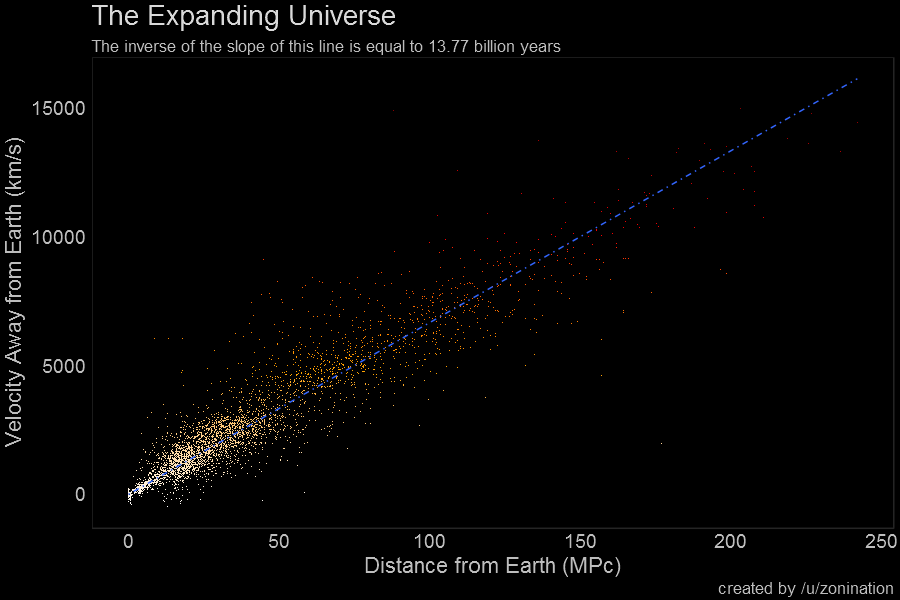
According to this data, the age of the universe is 13.773 billion years old. This is -0.187% off from the accepted value of 13.799 billion years old.
Data was taken from HyperLeda, using the command: SELECT objname, mod0, vgsr WHERE mod0 IS NOT NULL, basically taking all the distance vs. velocity data they had available (4240 galaxies). After doing a quick conversion from Distance Modulus to Megaparsecs (1 Megaparsec = 3.086x10^19 km), here's what the plot looks like:
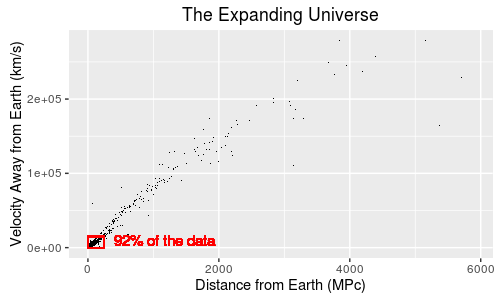
Hmm. This doesn't look too good. There's a huge cluster towards the origin, and a lot of sparse data and outliers on the extremes. This could really screw with our final value. Let's cut the extreme data out and just focus inside the red box I highlighted:
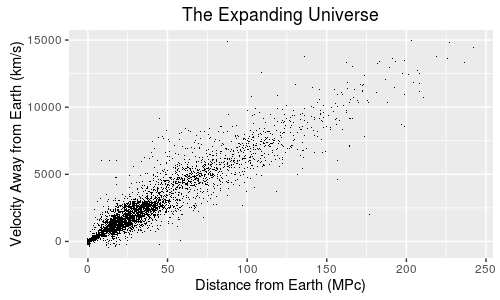
This looks much better. The cluster is a lot more even, and there are fewer (if any) outliers. Our total galaxy count is now 3908, still 92% of our data. The data range is x<=250, y<=15000. This is the set we'll use for our calculation on the age of the universe.
Find it odd that the further the galaxies are from you, the faster they're moving away from you? So did Catholic priest Georges Lemaître. Georges figured that, if you have objects moving away from you at a speed proportional to their distance from you, then abductively speaking, there must have been some kind of explosion that took place before. Take, for instance, the following diagram, which is simulated using the program in the other folder:
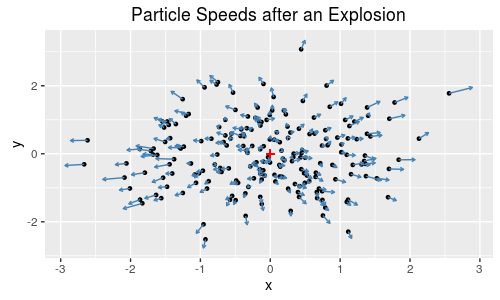
From this plot, you can intuitively figure two things:
- The further the particle is away from the center, the faster it's moving away from the center.
- If you were to go back in time, and tally up the speeds from each particle into the opposite direction of where they're currently moving, you'd see that they would all converge to a single point.
Here's what it looks like when these particles are plotted as speed vs. distance:
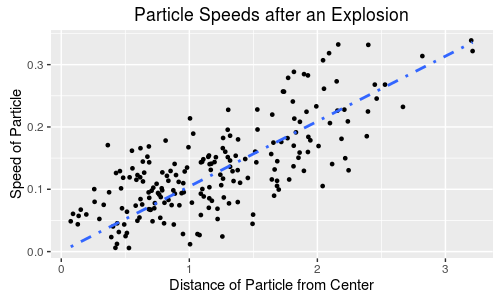
Both these plots, by the way, would look similar if you chose any point on this plot as the center.
As we know from physics, velocity times time equals distance (d = v*t). If we convert to a consistent set of units, divide distance (km) over velocity (km/s), we get time (s). A simple regression line works if you switch x and y (set the intercept to 0); the slope will be time in seconds. Convert into years, and, with this data, we get 13.77 billion years. That's pretty close.
Edited to add: from another redditor:
You may want to add that the age of the universe isn't really 1/H_0 (that's what OP computed), but there is a correction factor (that can be determined from the relative abundance of dark energy/(dark) matter/radiation) that just turns out to be very close to 1 for our universe.
- Tools: The data was compiled with R, and graphed in ggplot2.
- Source: HyperLeda, using the command:
SELECT objname, mod0, vgsr WHERE mod0 IS NOT NULL
- HyperLeda's Documentation on Physical Parameters
- Wikipedia's article on Distance Modulus
- Wikipedia's article on Local Standard of Rest
- Wikipedia's article on Hubble's Law