Analysis and Modelling of Urban Footfall Data in York City Centre
Abstract
This repository presents an overview of one of my projects completed during my MSc at City University.
In this project I look at footfall data from five distinct streets in the center of York (U.K.) collected as daily times series. This data is supplemented with weather (temperature and precipitation)and business occupancy time series as well as introducing auto-regressive features into the initial dataset to model and predict daily footfall for each each street. I compare and contrast random forests and regularised and non-regularised linear regression models on this augmented dataset.
Overview
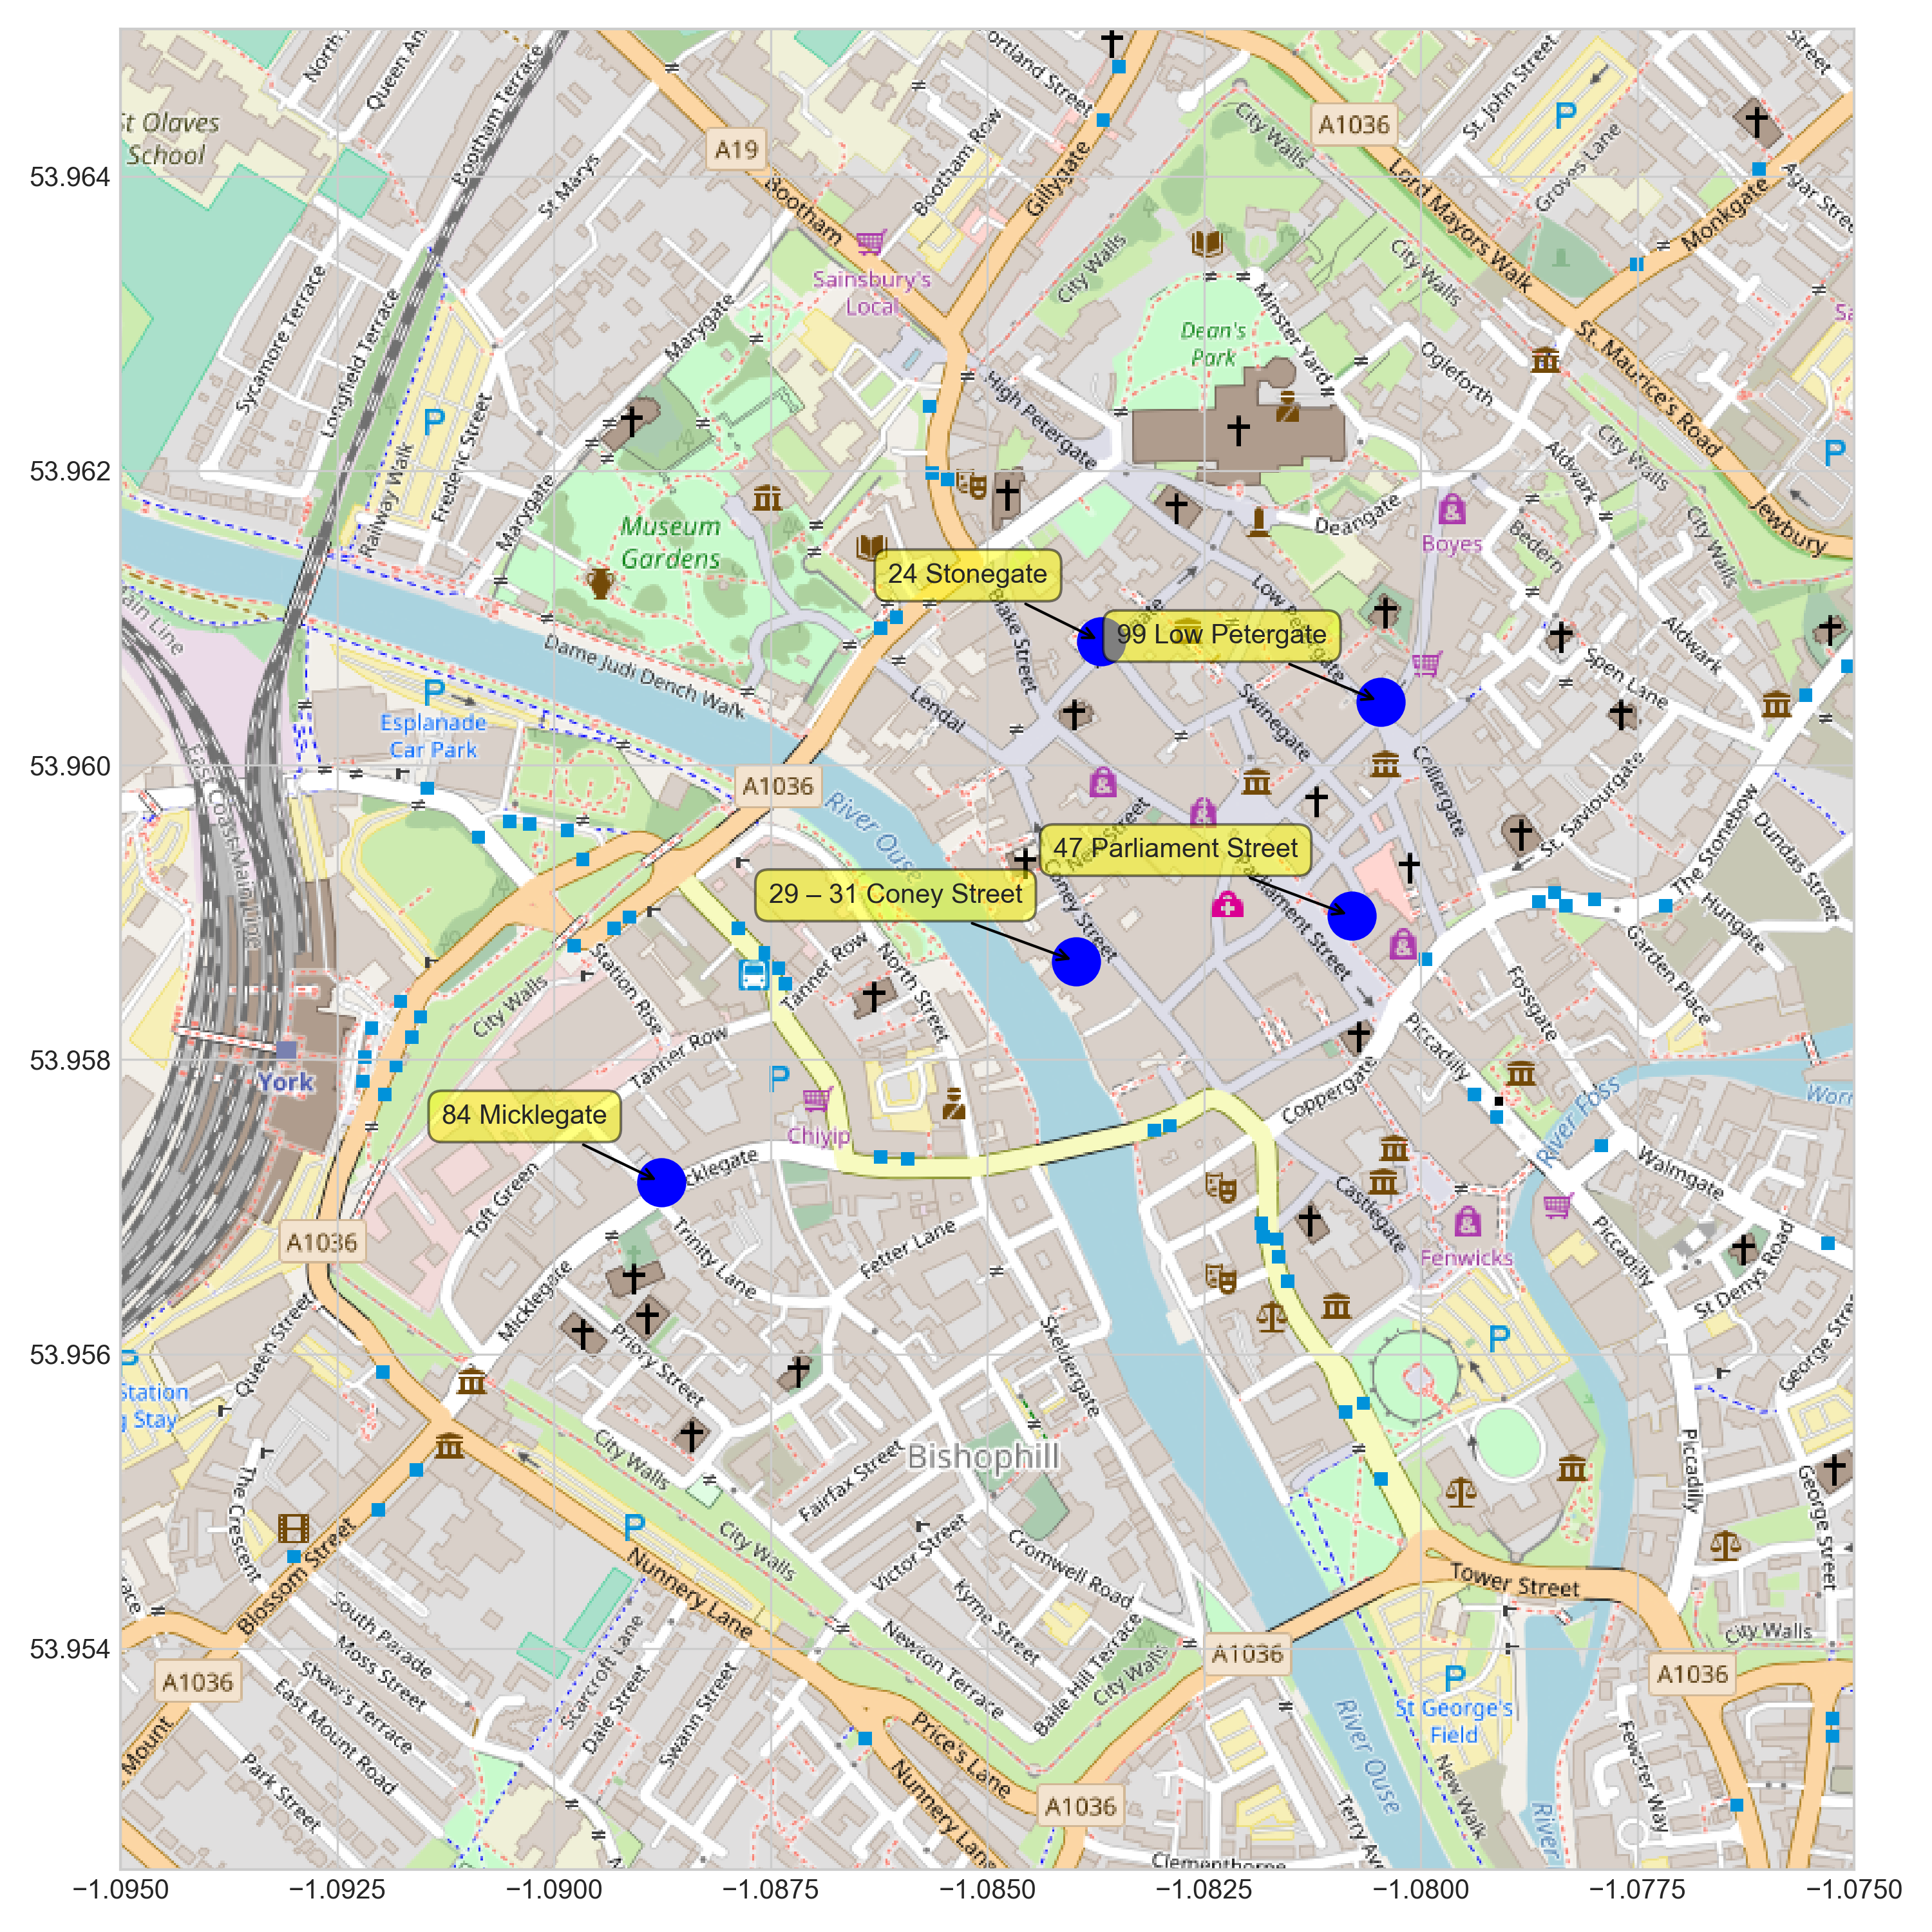 Footfall data is automatically collected and calculated from street cameras in 5 distinct locations in the centre of York
We want to analyse the data, correlate it with other data (weather, seasonality, and commercial venues occupancy rates) to see how precisely we can model it.
We sourced the data from the following repositories:
- York City footfall from https://data.yorkopendata.org/ [1]
- York Business rates data available at same address
- York City weather data at https://weather.elec.york.ac.uk/data/vaisala/archives/ [2]
A similar project has been conducted at the University of Leeds.
http://lida.leeds.ac.uk/news/project-update-predictive-data-analytics-for-urban-footfall/[3]
The research looked at aggregate footfall data from Leeds city centre. One of the takeaway of the study was to emphasize
the key prominent explanatory variables: weather and day of the week.
In this study, we are looking at a different dataset and we are considering each individual street separately,
not as a group of streets in similar locations.
Problems and analytical questions
Compared to the Leeds’ study the challenges here are numerous:
- Sparsity of data: as we are looking at street level models, with less data samples overall per model.
- Noise: the data collection process can suffer from site-specific issues are not averaged-out by using multiple locations. Also, specific events occuring in a street can distort whatever patterns are present.
- Feature engineering: we might require additional features to correlate and compensate for the existing information deficit. Some of the analytical questions we hope to answer are:
- Is there an identifiable intrinsic structure to the footfall dynamic for a given street?
- How is footfall correlated to long lasting geographical structures (number of shops in street in our case)?
- How much auto-correlation in the time series is there due to the weekly cycle and are there long-term seasonality effects?
- How accurately can we fit a machine learning model to forecast footfall.
ETL and EDA
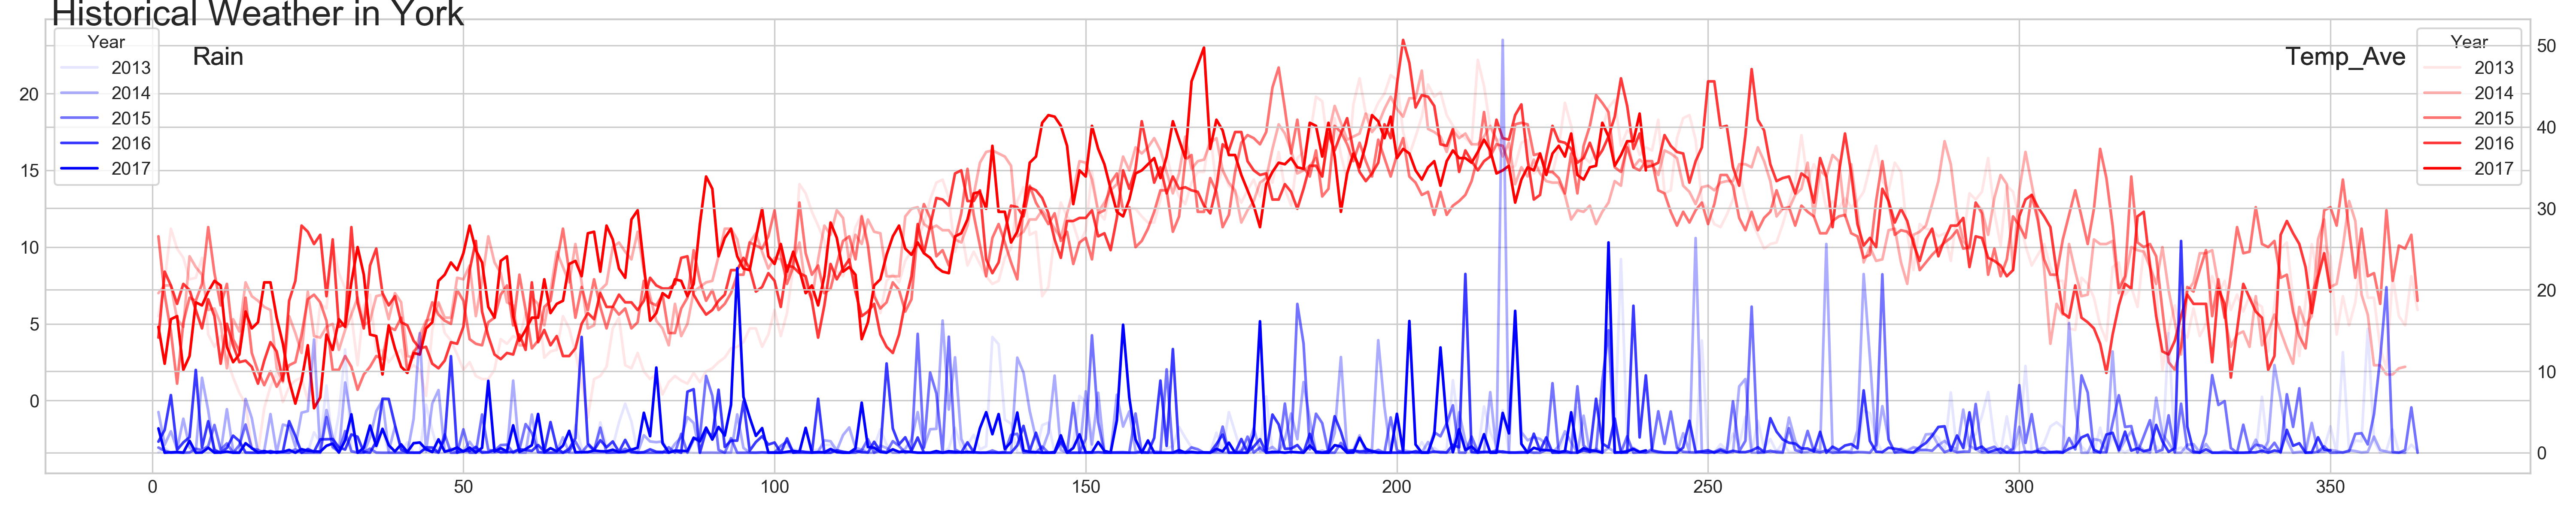
Weather data
Raw data:
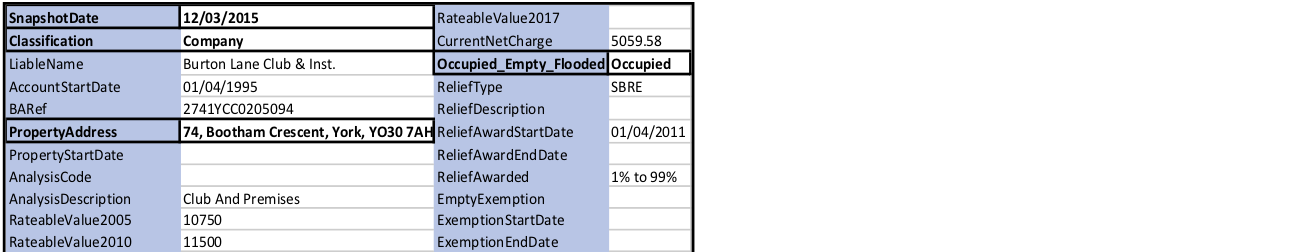
Occupancy data
Raw data:
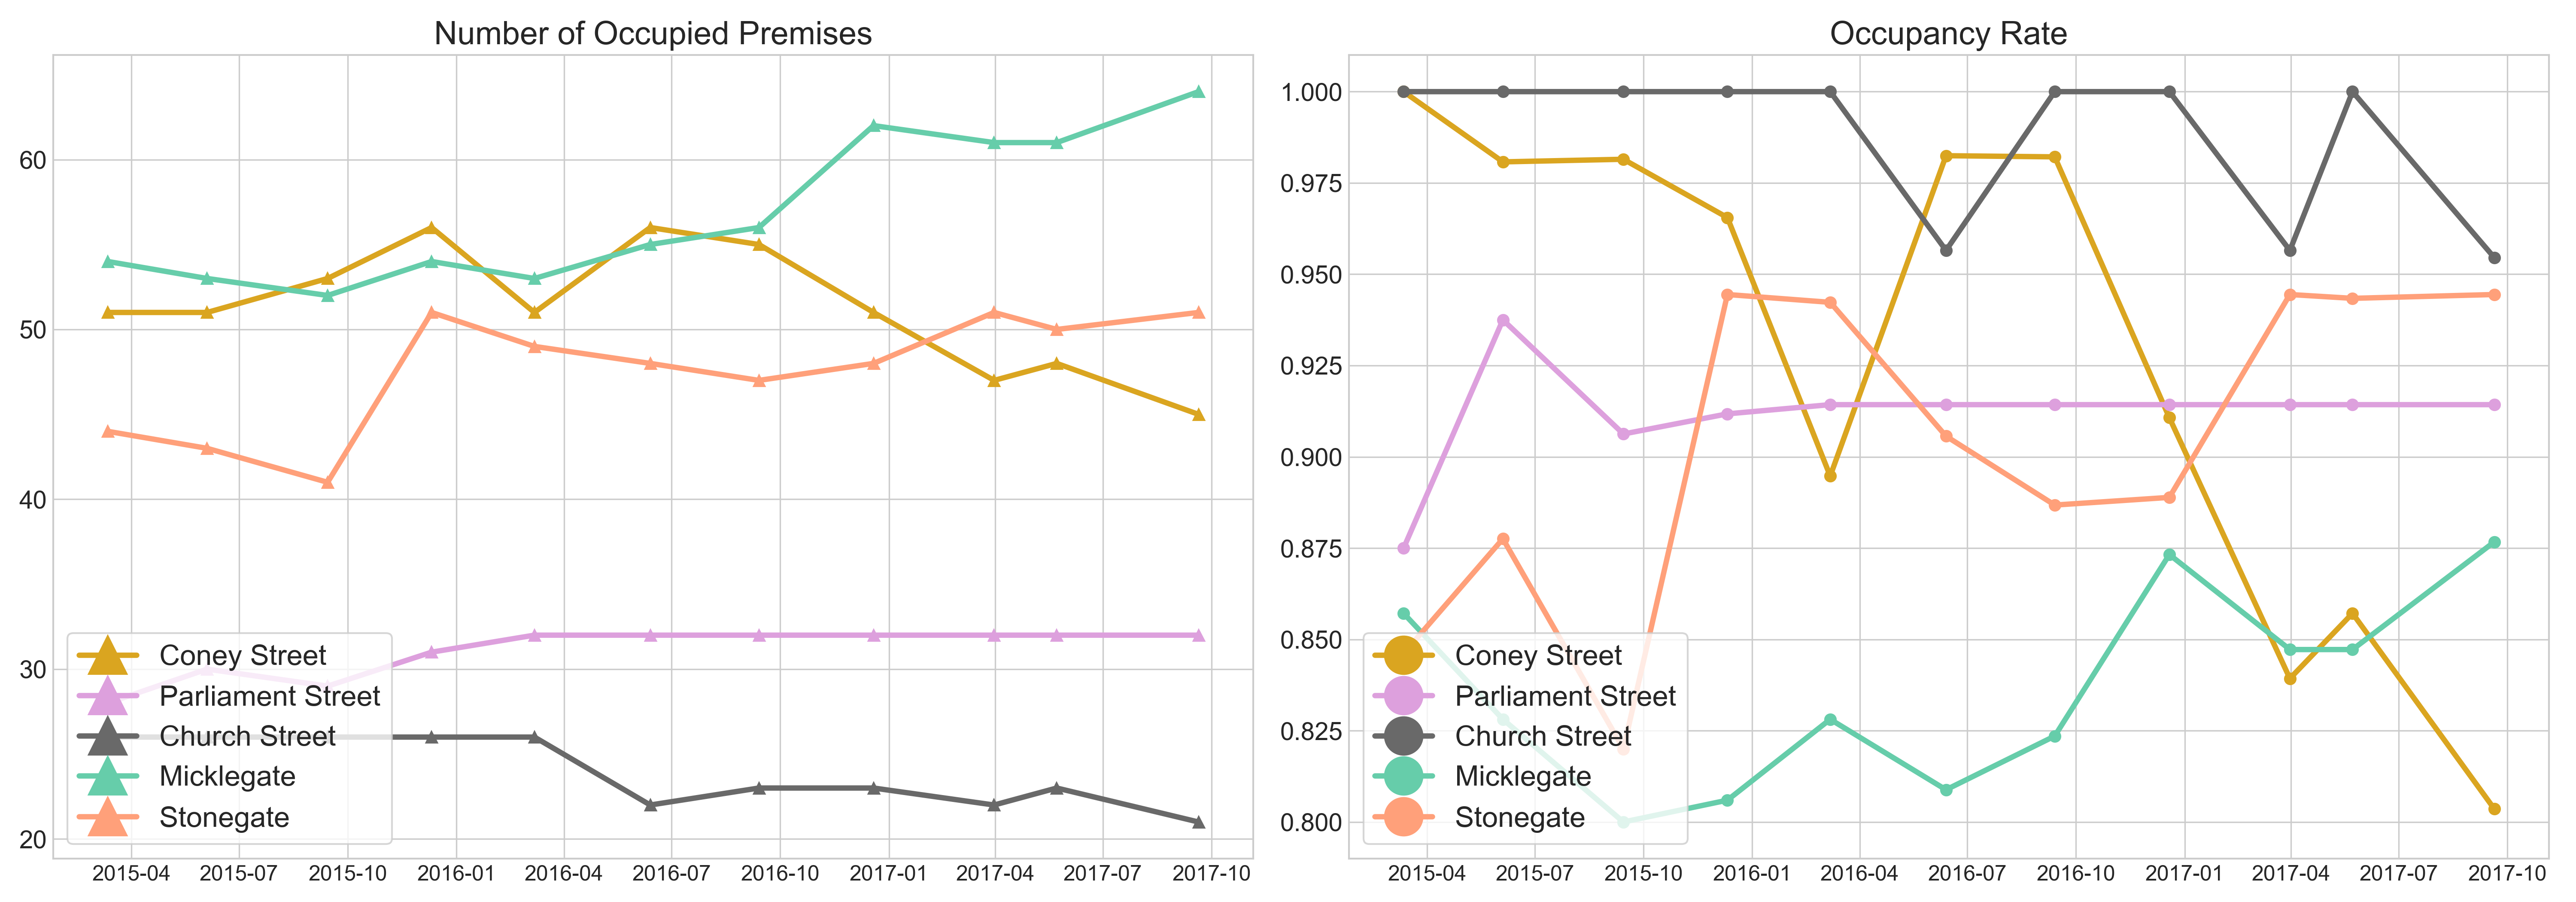
Occupancy Ratios as time series computed from raw data:
Footfall data
Time serie visualisation:
K_means clustering to reveal weekly dynamics per street:
Week-on-week autocorrelation plots:
Yearly patterns:
Multi Year patterns (with occupancy)
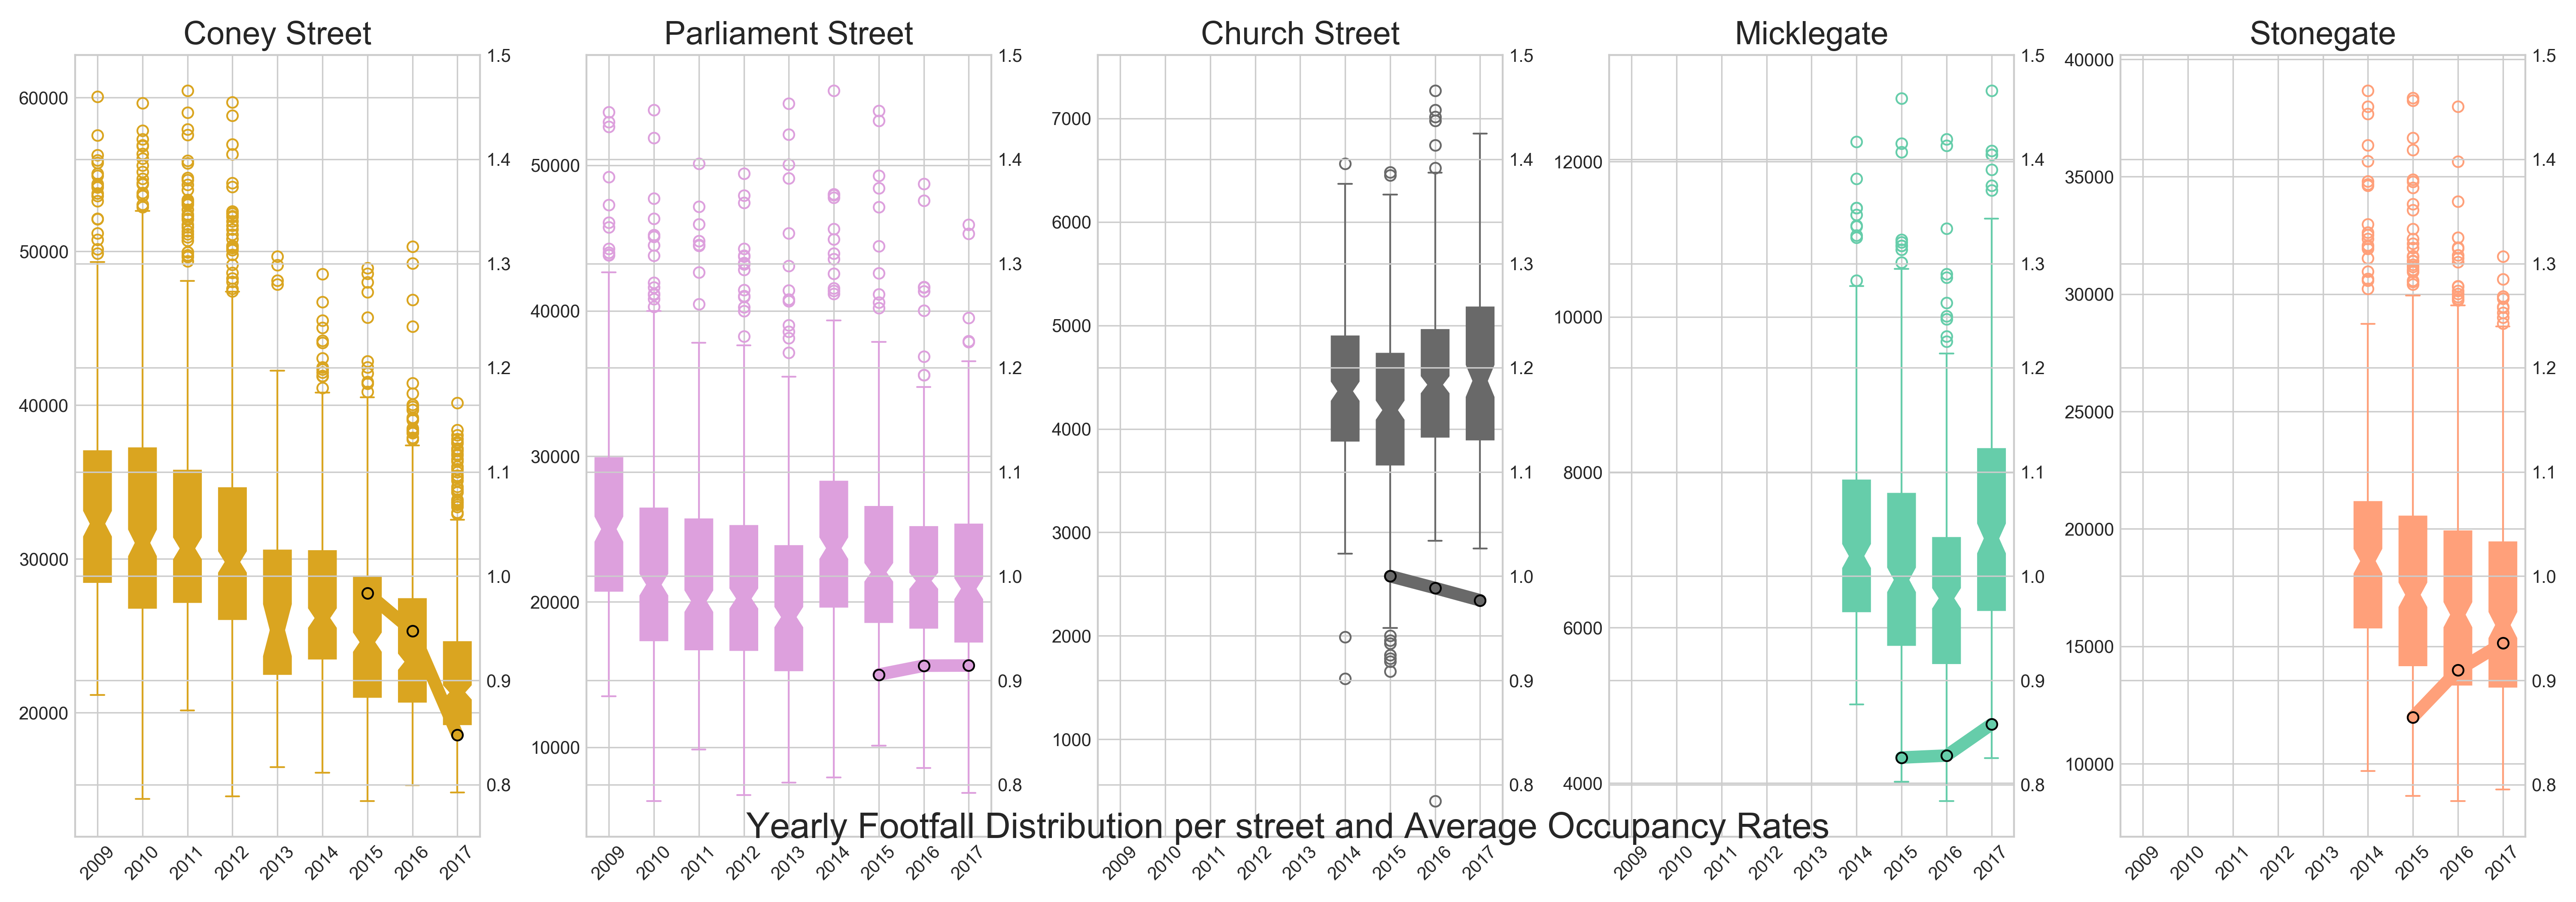
Model
ffall(t) = F[ffall(t-7), wkday(t), daystoXmas(t), temp(t), rain(t), occ(t)]
So we are looking at a regression model with footfall at time t as the response and 6 predictors which are: footfall at time t-7days, weekday at time t (categorical), number of days to next Christmas, temperature and precipitation level at time t and finallt occupancy ratio at time t.
Random Forest
We looked at simple Random Forest, Bagged trees and Boosted trees and measured, accuracy, RMSE and R2 score over the test set.
The best model was Bagged trees whose hyper-parameters were optimized though 5-fold cross-validation randomized search.
As we suspected, the best results were for Coney street and Stonegate. Indeed, we saw earlier that the k-means clustering of their weekly time series showed they have the less complex dynamics.
Test set statistics:
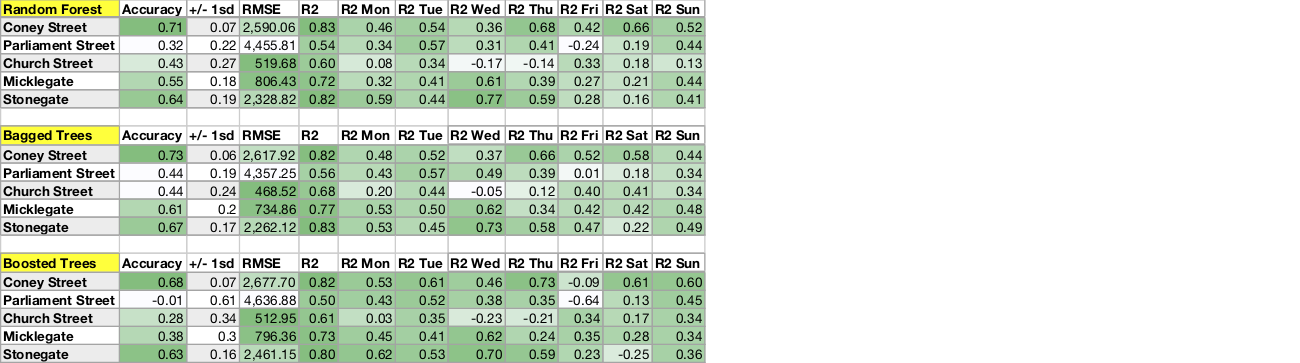
Test set results:
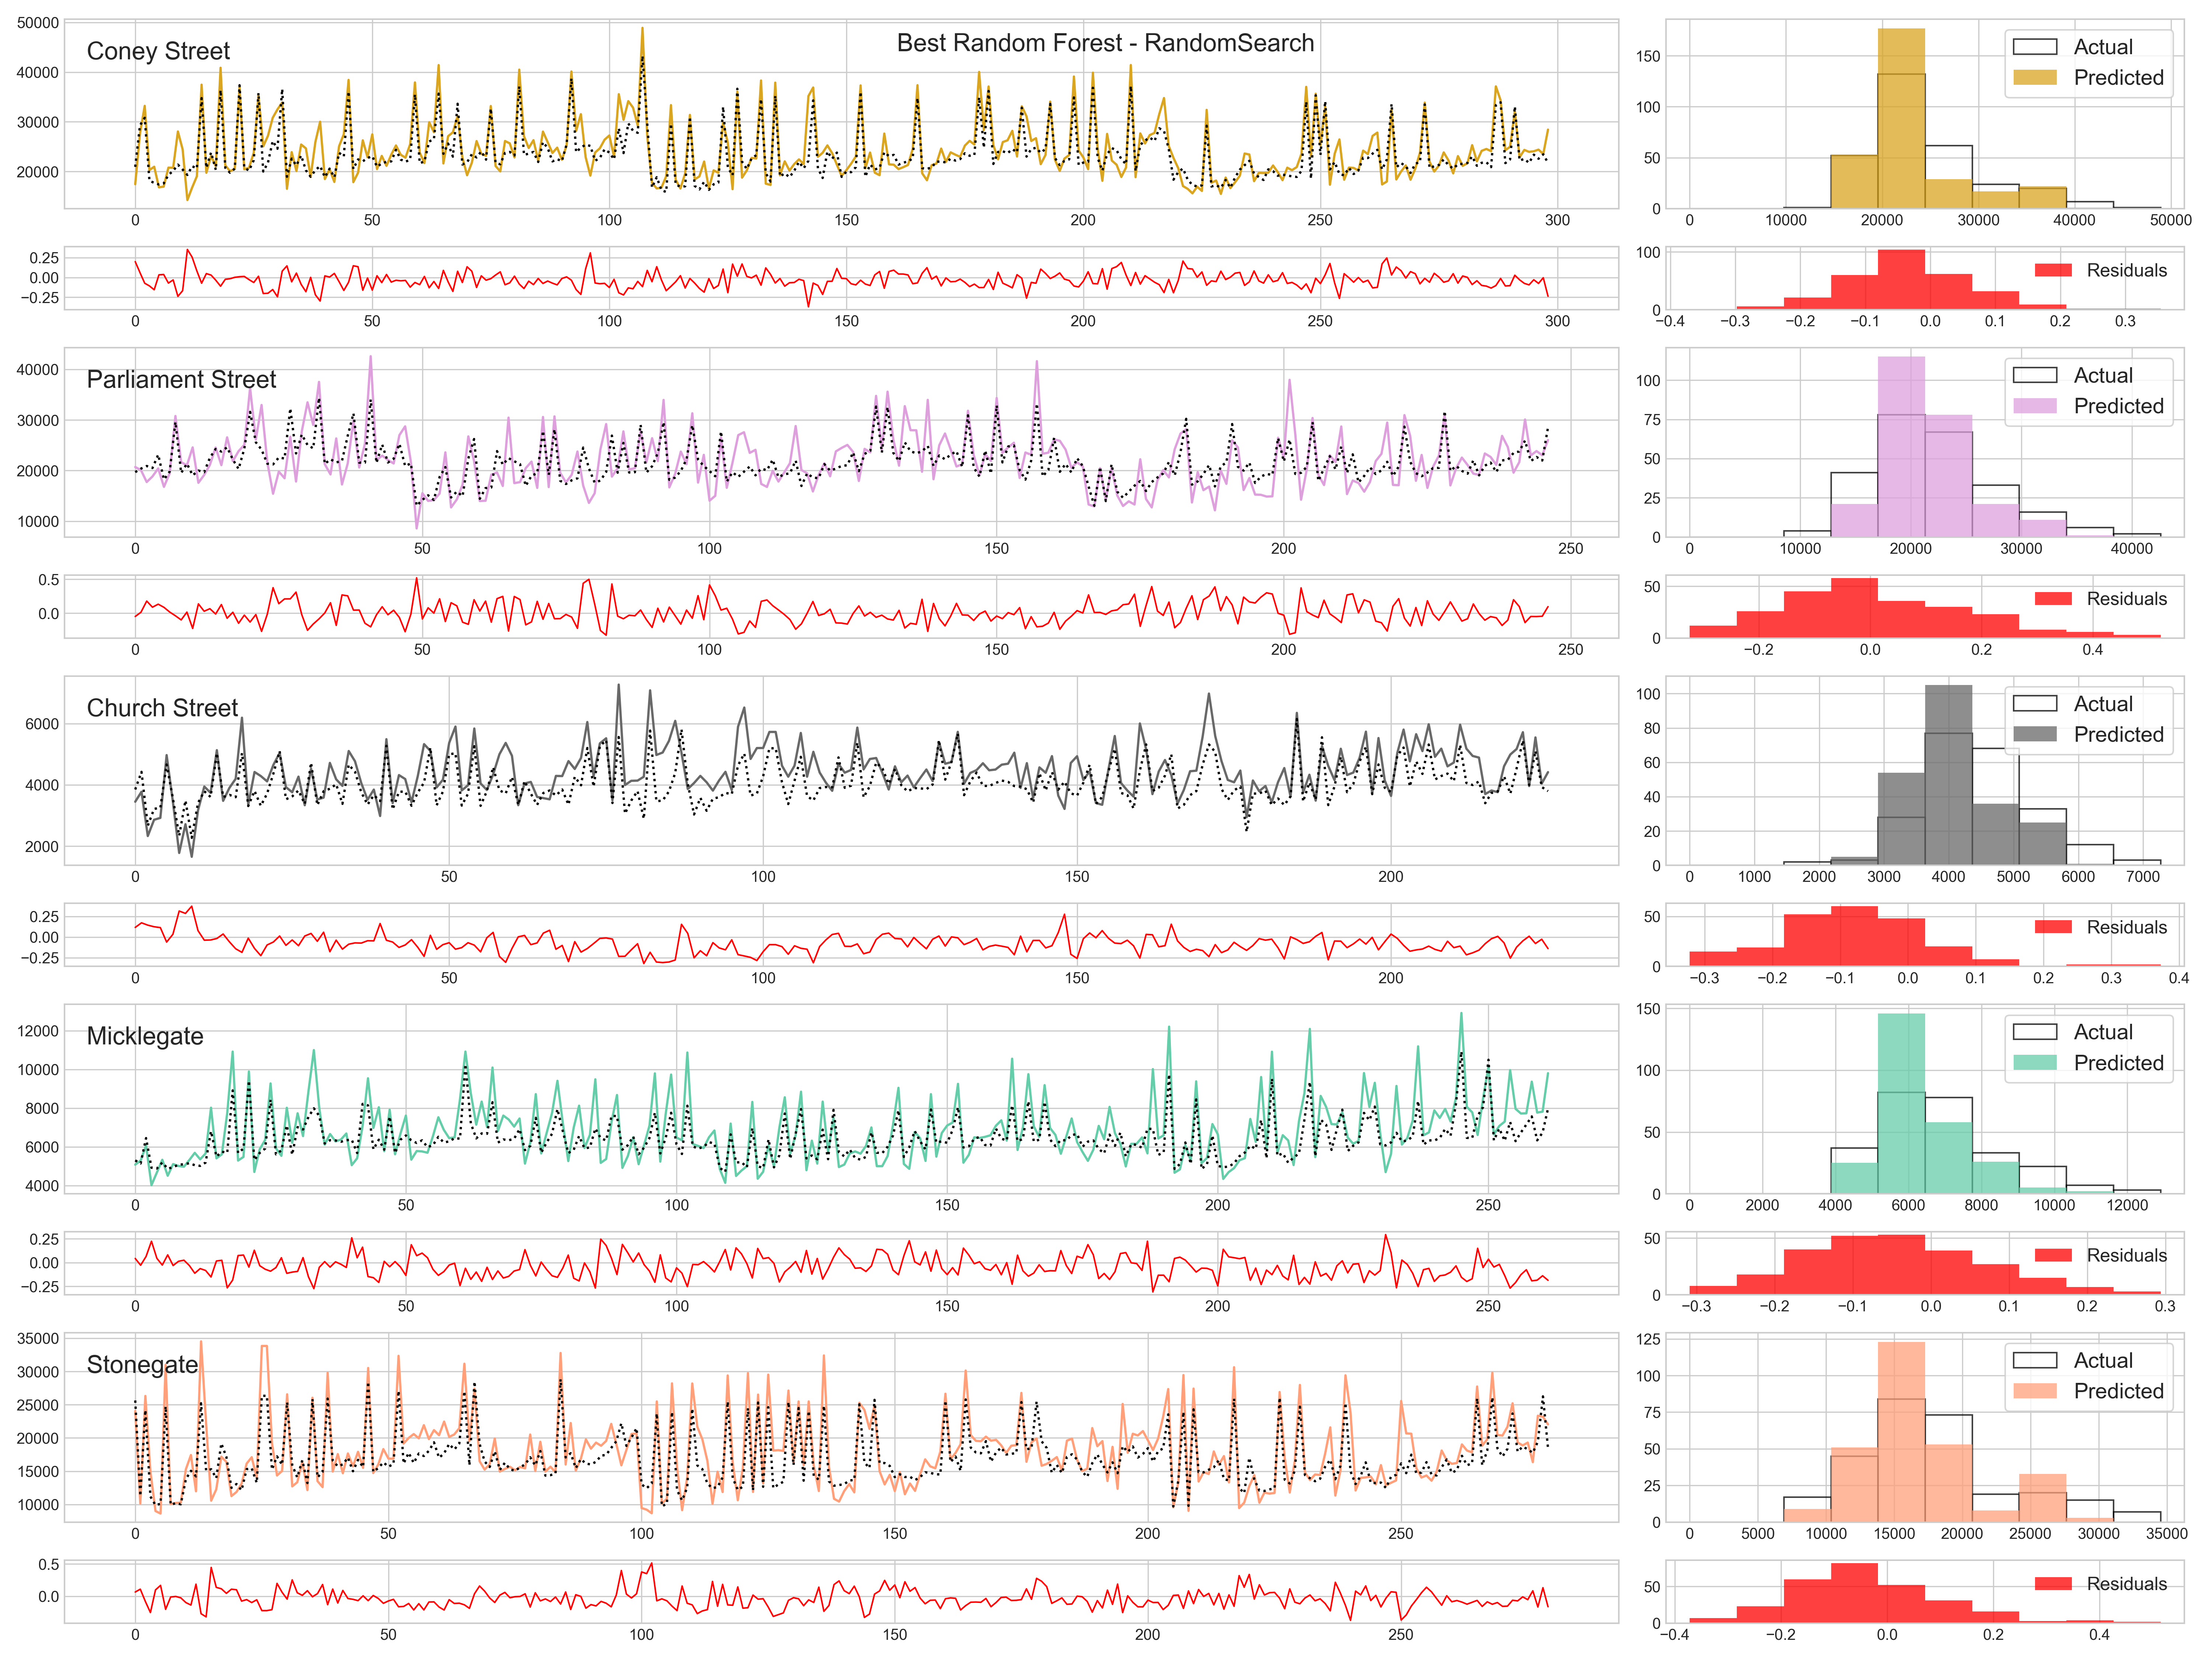
The graph shows that although errors are mainly distributed around +/-10% of actual values, there are some occasional large divergences. The model struggles to predict larger values and the predicted distribution is narrower than the actual distribution.
QQplots of actual residuals (top) and relative residuals:
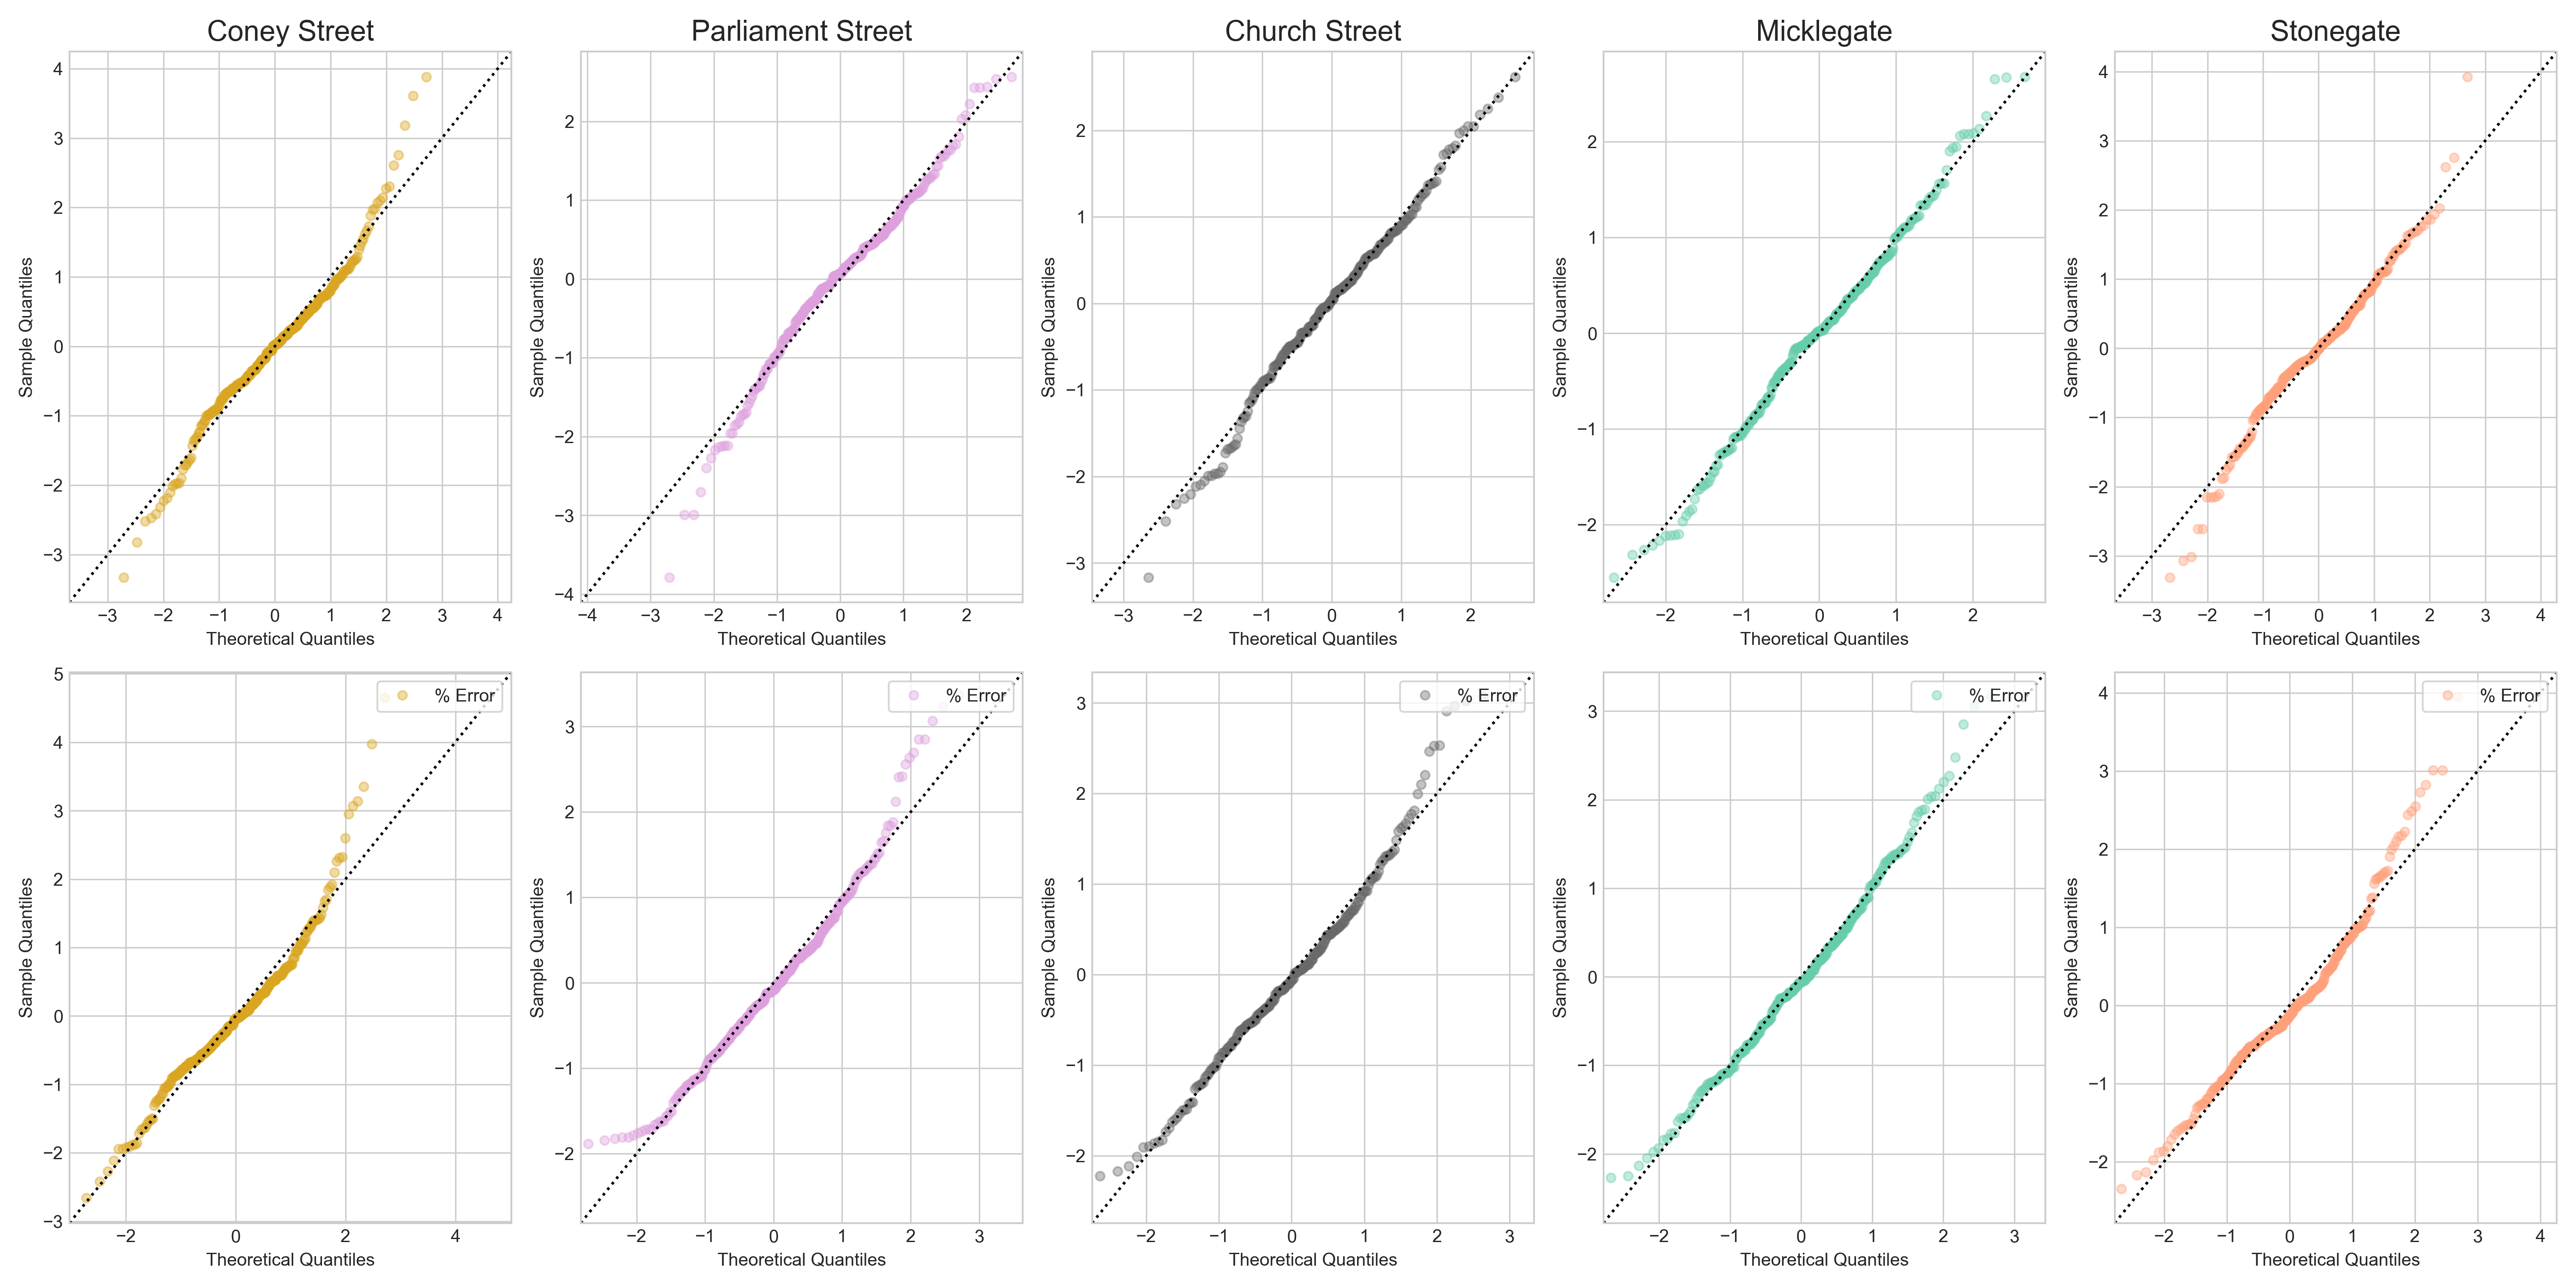 QQplots show that residuals were close to be normally distributed for average values but with slightly heavier tails (figure 14). Effectively the model over-predicts average values and under-predicts extreme values.
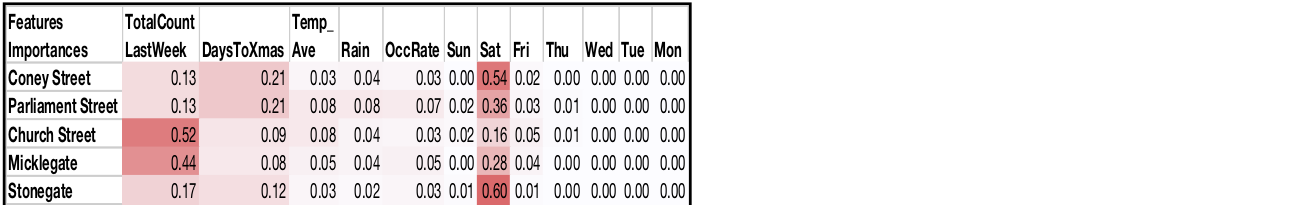
One of the advantages of the cross-validation method used for Bagged trees is that it provides estimates of feature “importance”, defined as how much a given feature contributes to reducing the out-of-bag error during the cross-validation runs, This highlighted the major role played by our added features, notably the value of footfall the previous week.
QQplots show that residuals were close to be normally distributed for average values but with slightly heavier tails (figure 14). Effectively the model over-predicts average values and under-predicts extreme values.
One of the advantages of the cross-validation method used for Bagged trees is that it provides estimates of feature “importance”, defined as how much a given feature contributes to reducing the out-of-bag error during the cross-validation runs, This highlighted the major role played by our added features, notably the value of footfall the previous week.
Features Importances:
Conclusions
This study helped us answer some of our research questions:
- There is an identifiable intrinsic structure to the footfall dynamic for a given street, with clear weekly patterns.
- Footfall is loosely correlated to occupancy rates. Our models confirm the poor predictive power of this feature. Footfall levels might be a predictor variable for occupancy rates and not the other way-round.
- The time series are very auto-correlated on a week-on-week basis and we also highlighted on a yearly time scale
- Our machine learning models provide reasonably good estimates of footfall given the features we selected. This model could be useful for good daily estimates of footfall. Its strengths are simplicity and performance while its weaknesses are the requirement to keep track of actual footfall numbers and source occupancy rates. There are many avenues for further exploration that are beyond the scope of this quick analysis, notably, the impacts of different scaling options, removing outliers or not, and removing some of the less explanatory variables, adding a calendar etc….