In a binary classification problem, we are tasked with classifying two distinct labels, typically denoted as "case" (encoded with 1) and "control" (encoded with 0). The classification process often results in a continuous output representing the classifier's confidence in predicting the cases. In our specific case, we obtain probabilities ranging from 0 to 1, which is common when using logistic regression for classification. These probabilities reflect the likelihood of an instance belonging to the positive class ("case").
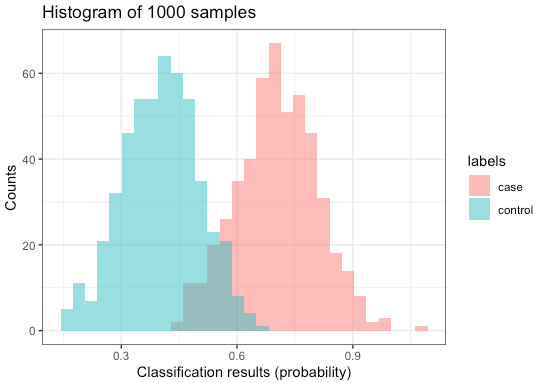
In this example, we have 1000 samples, with half being controls and the other half being cases. Using a pre-trained classifier, we can predict the probability of each sample belonging to the "case" group. The results are presented in a histogram:
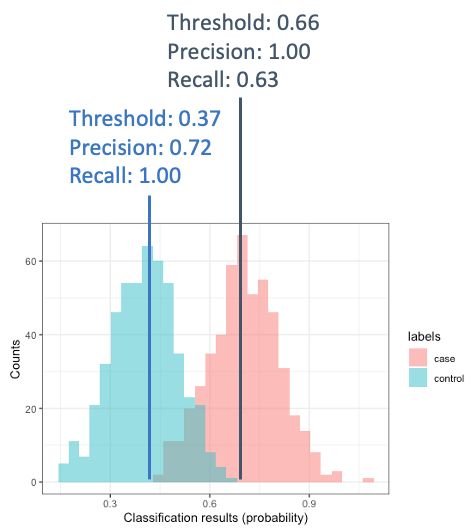
There are different ways to evaluate the performance of the classifier. For example, we could evaluate precision (which represents the accuracy of positive predictions, basically how many correct cases we identify) and recall (which represents the sensitivity, telling us how many of the cases we can identify). But note that they depend on defining a threshold. So in the example above, if I choose a threshold of 0.37, I will have a recall of 1, but lower precision. If I choose a threshold of 0.7, I will have the highest precision and lower recall (because I miss some cases):
A solution that allows us to compare classifiers independently of a fixed threshold is the AUC ROC (Area Under the Receiver Operating Characteristic curve). The AUC ROC provides a value between 0.5 and 1, where 0.5 represents a random classifier with no discrimination ability, and a higher value closer to 1 indicates better classifier performance in distinguishing between the two classes.
Here we want to access weather the AUC ROC is dependent on the numer of positive and negative cases, in the context of a binary classification problem.
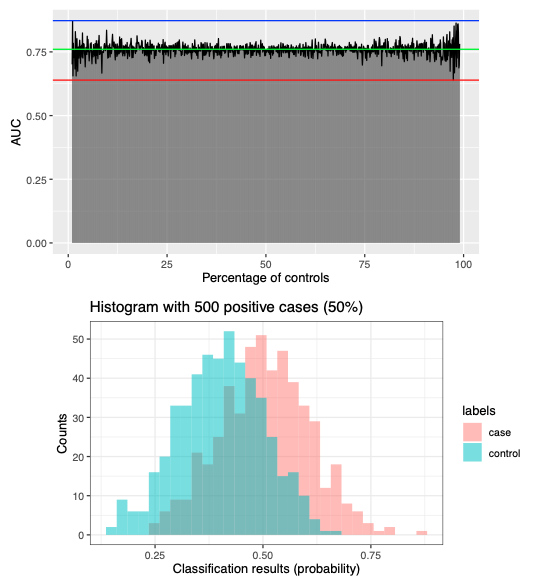
To demonstrate this, I simulated the classification results for cases (normal distribution with mean 0.7 and sd 0.1) and controls (normal distribution with mean 0.4 and sd 0.1), varying the number of cases and controls. I tested scenarios ranging from 10 cases out of 1000 samples to 990 cases out of 1000 samples. The AUC ROC values, representing the classifier's performance, are displayed below:
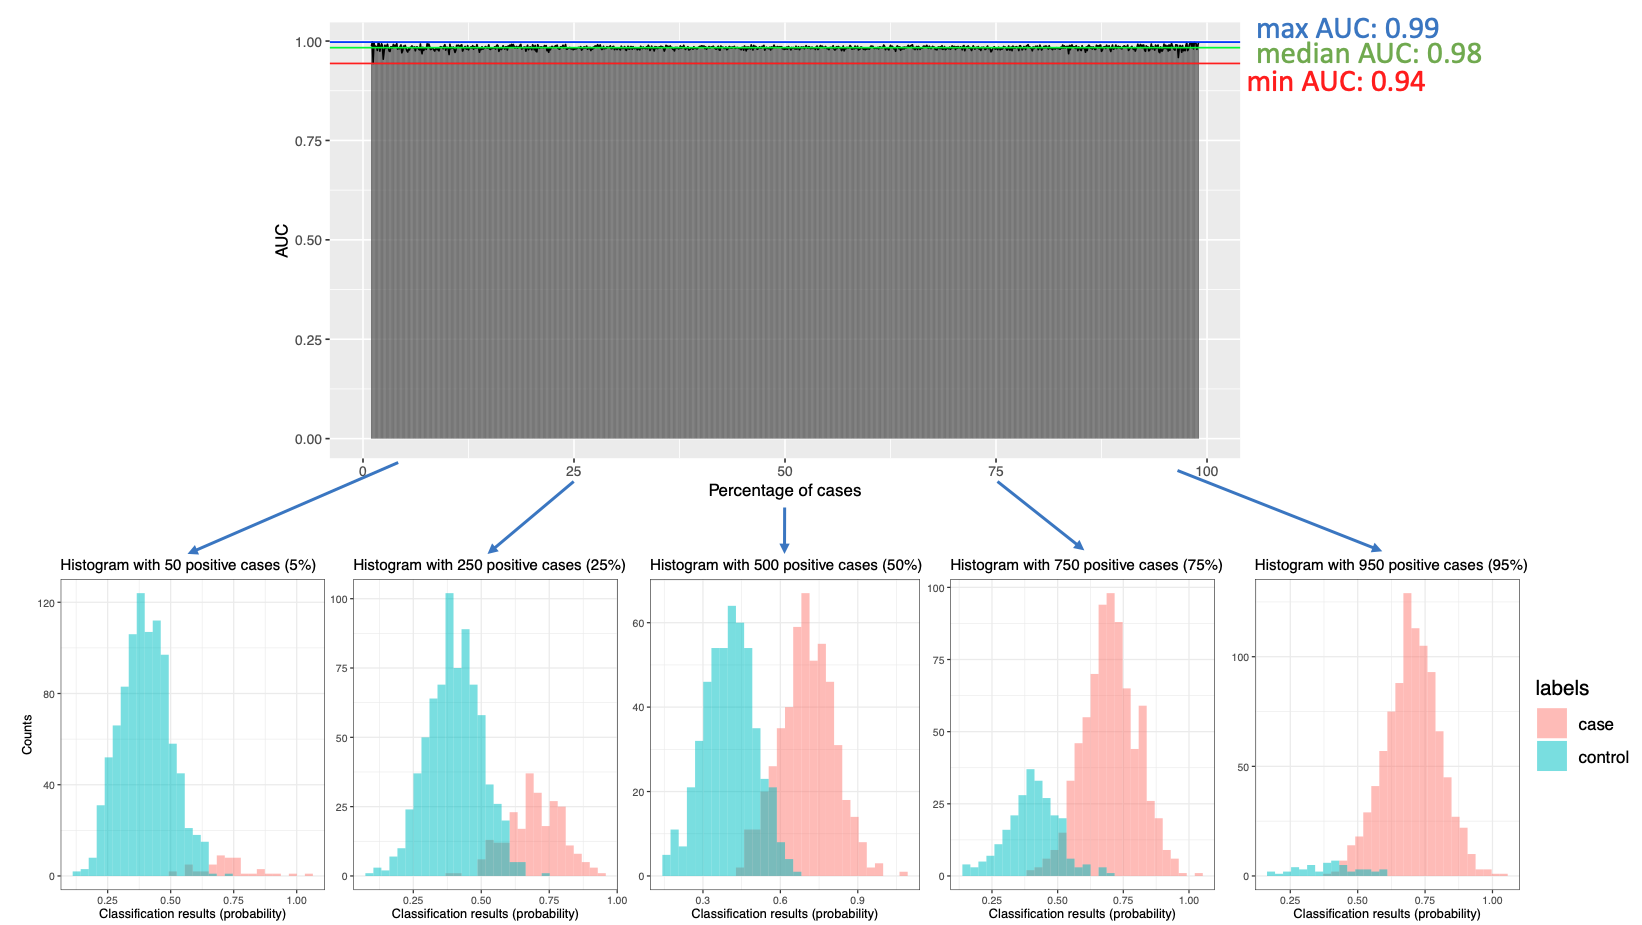
Based on this simulation, it appears that the AUC remains stable and independent of the number of cases and controls. This suggests that the classifier's performance, as measured by the AUC, is consistent regardless of the proportion of cases and controls in the dataset.
We further explored the impact of having a higher overlap between cases and controls by simulating distributions with mean values of 0.5 and 0.4, respectively. The AUC remains independent of the number of cases and controls, even though we observe higher variation in the results: