Omnitrace is an AMD open source research project and is not supported as part of the ROCm software stack.
AMD Research is seeking to improve observability and performance analysis for software running on AMD heterogeneous systems. If you are familiar with rocprof and/or uProf, you will find many of the capabilities of these tools available via Omnitrace in addition to many new capabilities.
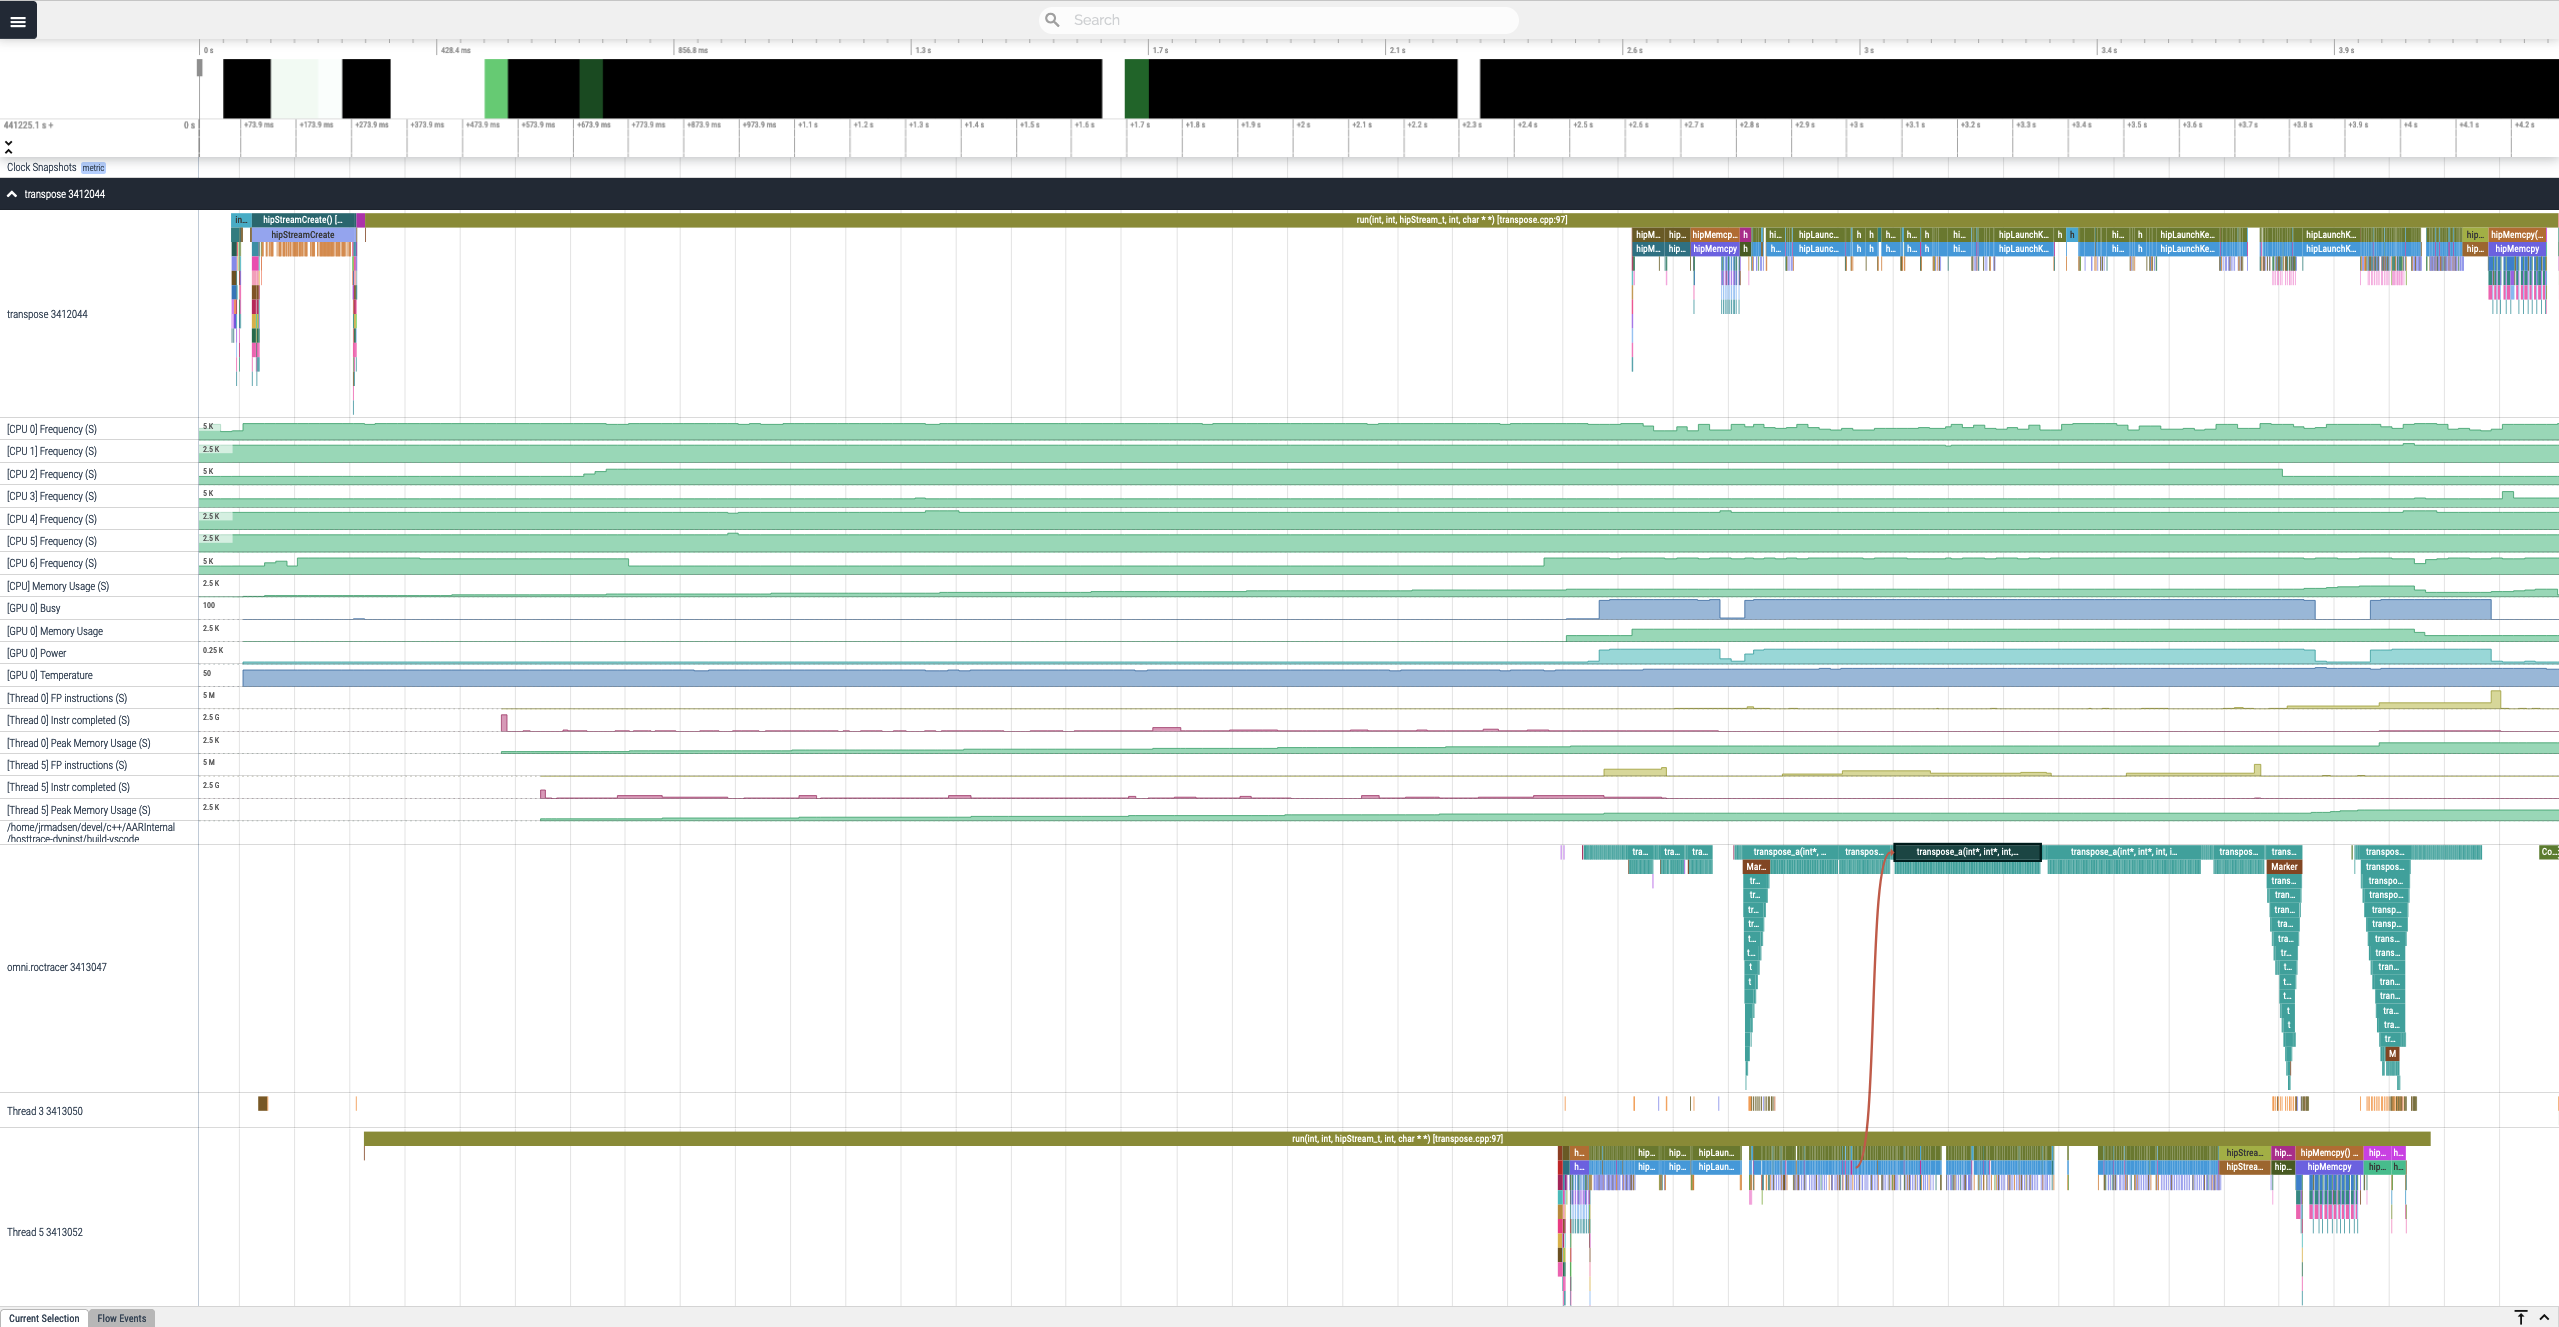
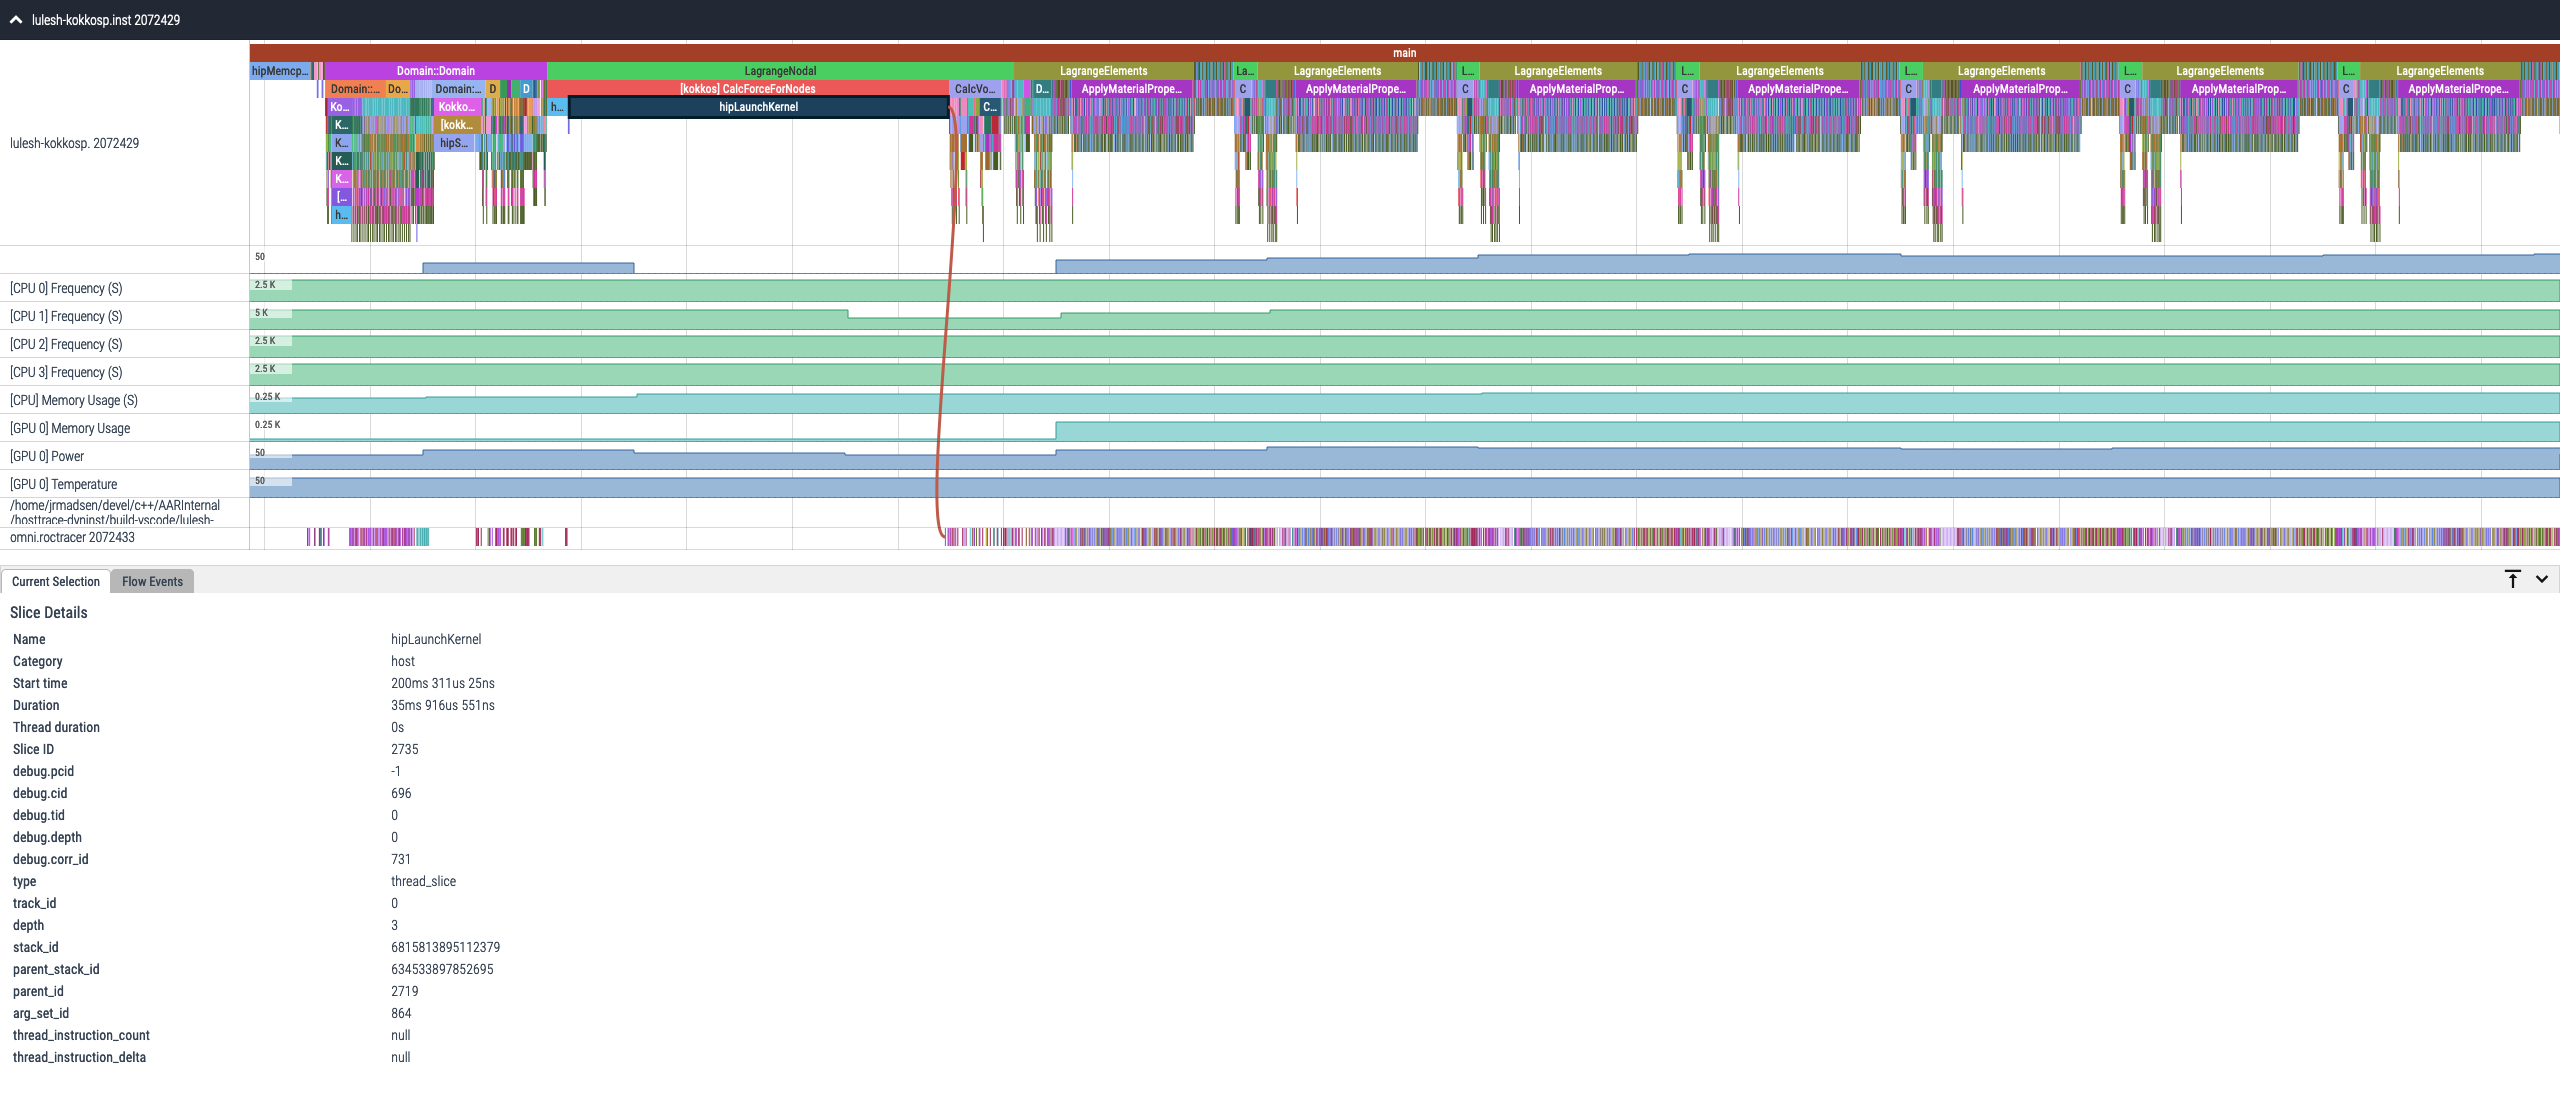
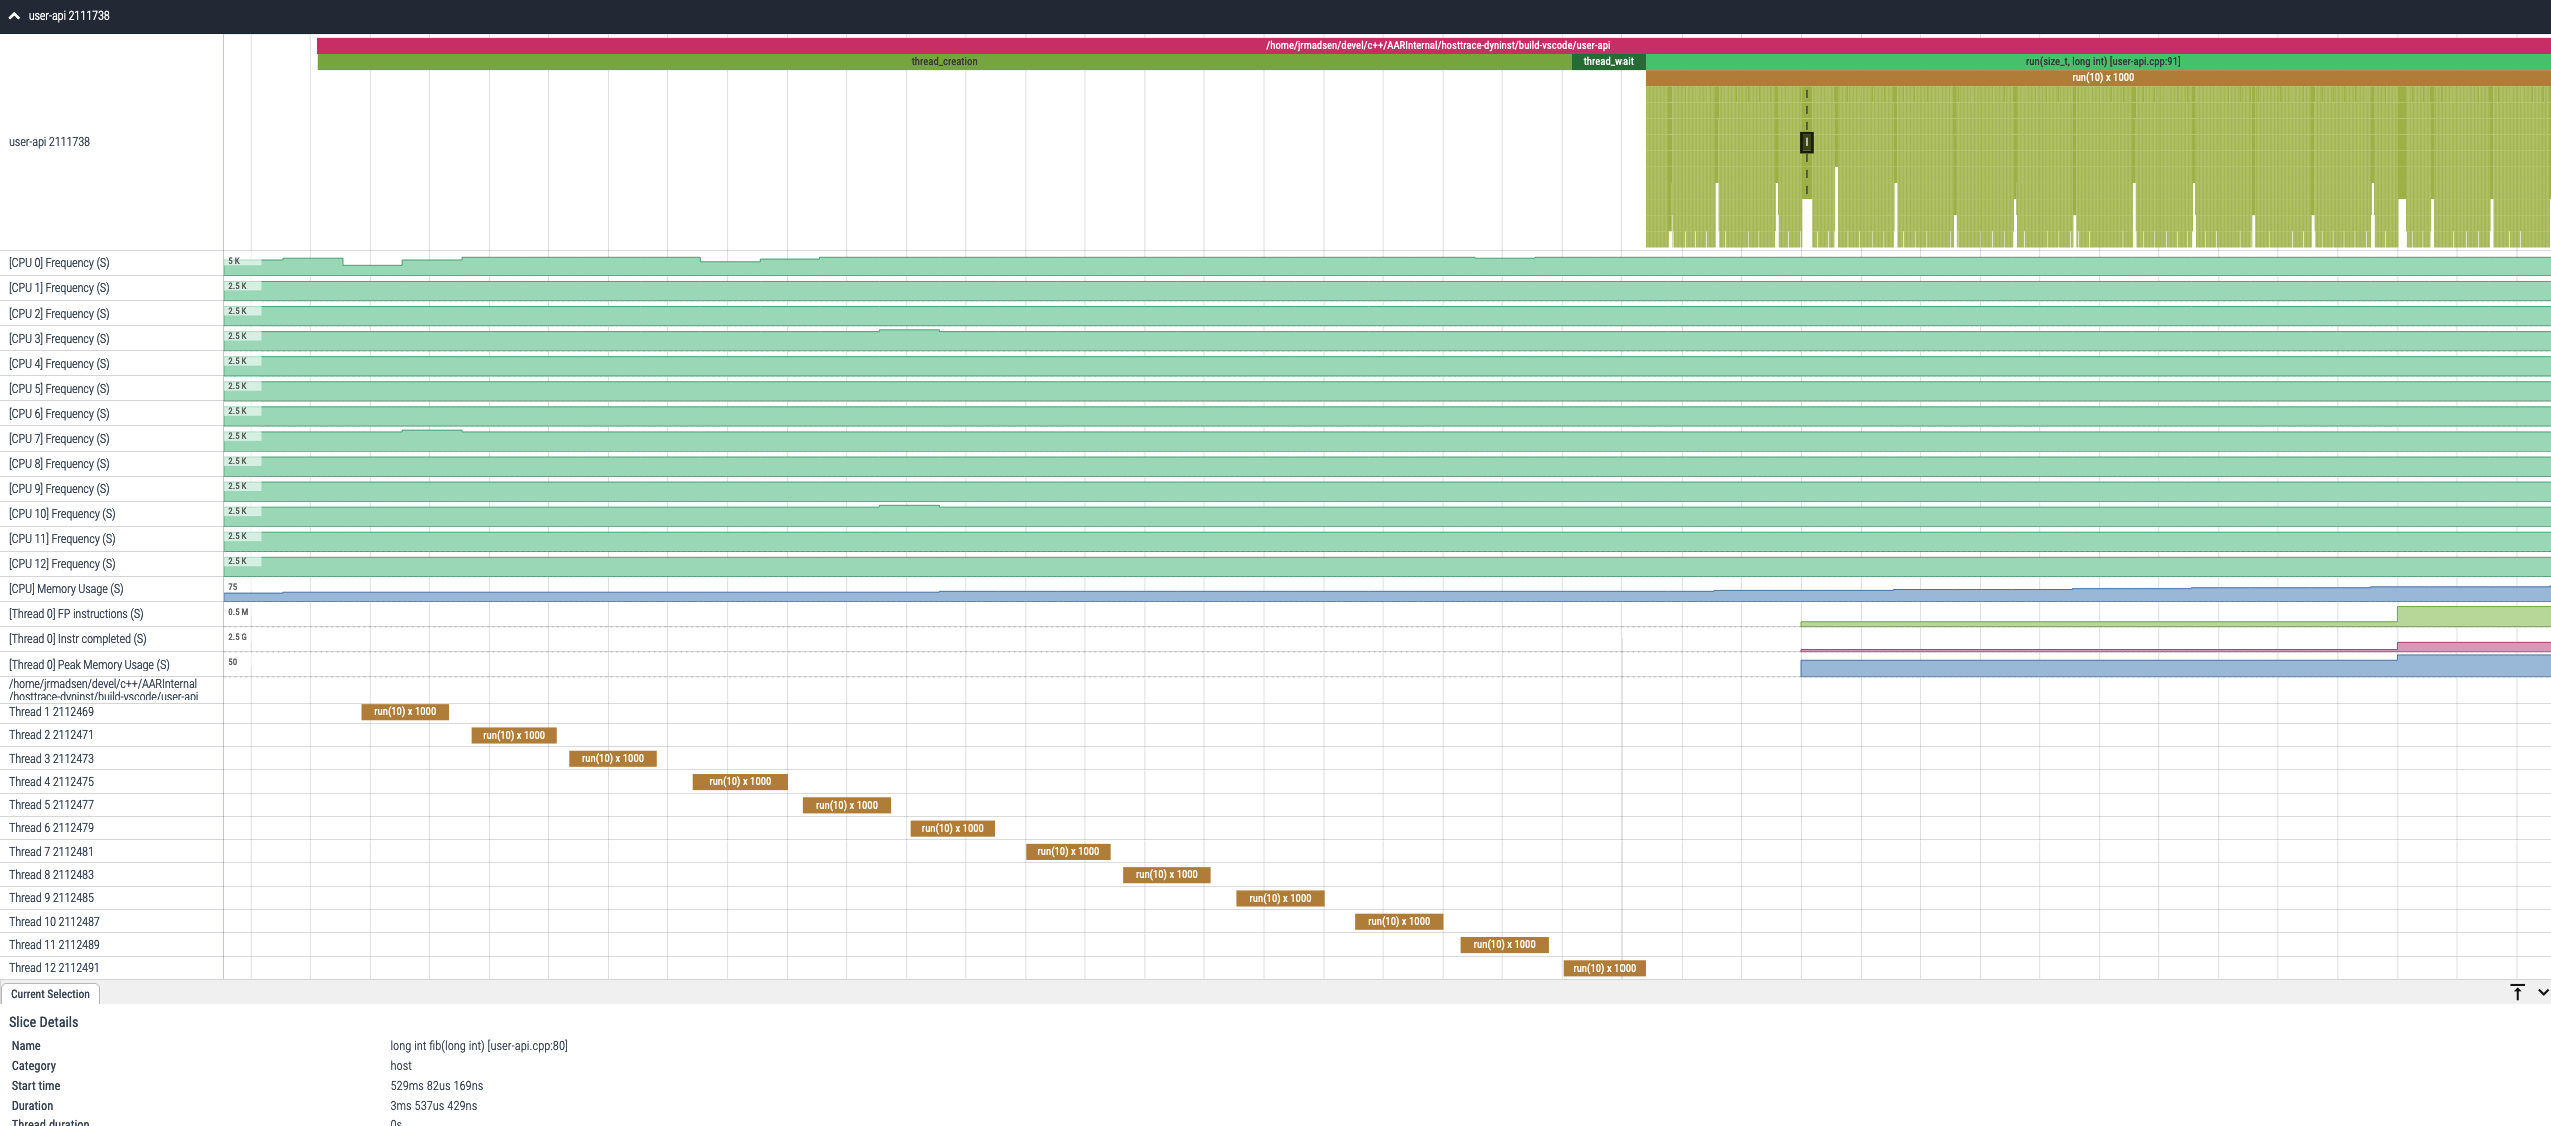
Omnitrace is a comprehensive profiling and tracing tool for parallel applications written in C, C++, Fortran, HIP, OpenCL, and Python which execute on the CPU or CPU+GPU. It is capable of gathering the performance information of functions through any combination of binary instrumentation, call-stack sampling, user-defined regions, and Python interpreter hooks. Omnitrace supports interactive visualization of comprehensive traces in the web browser in addition to high-level summary profiles with mean/min/max/stddev statistics. In addition to runtimes, omnitrace supports the collection of system-level metrics such as the CPU frequency, GPU temperature, and GPU utilization, process-level metrics such as the memory usage, page-faults, and context-switches, and thread-level metrics such as memory usage, CPU time, and numerous hardware counters.
- Dynamic instrumentation
- Runtime instrumentation
- Instrument executable and shared libraries at runtime
- Binary rewriting
- Generate a new executable and/or library with instrumentation built-in
- Runtime instrumentation
- Statistical sampling
- Periodic software interrupts per-thread
- Process-level sampling
- Background thread records process-, system- and device-level metrics while the application executes
- Causal profiling
- Quantifies the potential impact of optimizations in parallel codes
- Critical trace generation
- High-level summary profiles with mean/min/max/stddev statistics
- Low overhead, memory efficient
- Ideal for running at scale
- Comprehensive traces
- Every individual event/measurement
- Application speedup predictions resulting from potential optimizations in functions and lines of code (causal profiling)
- Critical trace analysis (alpha)
- HIP
- HSA
- Pthreads
- MPI
- Kokkos-Tools (KokkosP)
- OpenMP-Tools (OMPT)
- GPU hardware counters
- HIP API tracing
- HIP kernel tracing
- HSA API tracing
- HSA operation tracing
- System-level sampling (via rocm-smi)
- Memory usage
- Power usage
- Temperature
- Utilization
- CPU hardware counters sampling and profiles
- CPU frequency sampling
- Various timing metrics
- Wall time
- CPU time (process and/or thread)
- CPU utilization (process and/or thread)
- User CPU time
- Kernel CPU time
- Various memory metrics
- High-water mark (sampling and profiles)
- Memory page allocation
- Virtual memory usage
- Network statistics
- I/O metrics
- ... many more
The full documentation for omnitrace is available at amdresearch.github.io/omnitrace. See the Getting Started documentation for general tips and a detailed discussion about sampling vs. binary instrumentation.
- Visit Releases page
- Select appropriate installer (recommendation:
.shscripts do not require super-user priviledges unlike the DEB/RPM installers)- If targeting a ROCm application, find the installer script with the matching ROCm version
- If you are unsure about your Linux distro, check
/etc/os-releaseor use theomnitrace-install.pyscript
If the above recommendation is not desired, download the omnitrace-install.py and specify --prefix <install-directory> when
executing it. This script will attempt to auto-detect a compatible OS distribution and version.
If ROCm support is desired, specify --rocm X.Y where X is the ROCm major version and Y
is the ROCm minor version, e.g. --rocm 5.4.
wget https://github.com/AMDResearch/omnitrace/releases/latest/download/omnitrace-install.py
python3 ./omnitrace-install.py --prefix /opt/omnitrace/rocm-5.4 --rocm 5.4
See the Installation Documentation for detailed information.
NOTE: Replace
/opt/omnitracebelow with installation prefix as necessary.
- Option 1: Source
setup-env.shscript
source /opt/omnitrace/share/omnitrace/setup-env.sh- Option 2: Load modulefile
module use /opt/omnitrace/share/modulefiles
module load omnitrace- Option 3: Manual
export PATH=/opt/omnitrace/bin:${PATH}
export LD_LIBRARY_PATH=/opt/omnitrace/lib:${LD_LIBRARY_PATH}Generate an omnitrace configuration file using omnitrace-avail -G omnitrace.cfg. Optionally, use omnitrace-avail -G omnitrace.cfg --all for
a verbose configuration file with descriptions, categories, etc. Modify the configuration file as desired, e.g. enable
perfetto, timemory, sampling, and process-level sampling by default
and tweak some sampling default values:
# ...
OMNITRACE_TRACE                = true
OMNITRACE_PROFILE              = true
OMNITRACE_USE_SAMPLING         = true
OMNITRACE_USE_PROCESS_SAMPLING = true
# ...
OMNITRACE_SAMPLING_FREQ        = 50
OMNITRACE_SAMPLING_CPUS        = all
OMNITRACE_SAMPLING_GPUS        = $env:HIP_VISIBLE_DEVICES
Once the configuration file is adjusted to your preferences, either export the path to this file via OMNITRACE_CONFIG_FILE=/path/to/omnitrace.cfg
or place this file in ${HOME}/.omnitrace.cfg to ensure these values are always read as the default. If you wish to change any of these settings,
you can override them via environment variables or by specifying an alternative OMNITRACE_CONFIG_FILE.
The omnitrace-sample executable is used to execute call-stack sampling on a target application without binary instrumentation.
Use a double-hypen (--) to separate the command-line arguments for omnitrace-sample from the target application and it's arguments.
omnitrace-sample --help
omnitrace-sample <omnitrace-options> -- <exe> <exe-options>
omnitrace-sample -f 1000 -- ls -laThe omnitrace executable is used to instrument an existing binary. Call-stack sampling can be enabled alongside
the execution an instrumented binary, to help "fill in the gaps" between the instrumentation via setting the OMNITRACE_USE_SAMPLING
configuration variable to ON.
Similar to omnitrace-sample, use a double-hypen (--) to separate the command-line arguments for omnitrace from the target application and it's arguments.
omnitrace-instrument --help
omnitrace-instrument <omnitrace-options> -- <exe-or-library> <exe-options>Rewrite the text section of an executable or library with instrumentation:
omnitrace-instrument -o app.inst -- /path/to/appIn binary rewrite mode, if you also want instrumentation in the linked libraries, you must also rewrite those libraries.
Example of rewriting the functions starting with "hip" with instrumentation in the amdhip64 library:
mkdir -p ./lib
omnitrace-instrument -R '^hip' -o ./lib/libamdhip64.so.4 -- /opt/rocm/lib/libamdhip64.so.4
export LD_LIBRARY_PATH=${PWD}/lib:${LD_LIBRARY_PATH}
Verify via
lddthat your executable will load the instrumented library -- if you built your executable with an RPATH to the original library's directory, then prefixingLD_LIBRARY_PATHwill have no effect.
Once you have rewritten your executable and/or libraries with instrumentation, you can just run the (instrumented) executable or exectuable which loads the instrumented libraries normally, e.g.:
omnitrace-run -- ./app.instIf you want to re-define certain settings to new default in a binary rewrite, use the --env option. This omnitrace option
will set the environment variable to the given value but will not override it. E.g. the default value of OMNITRACE_PERFETTO_BUFFER_SIZE_KB
is 1024000 KB (1 GiB):
# buffer size defaults to 1024000
omnitrace-instrument -o app.inst -- /path/to/app
omnitrace-run -- ./app.inst
Passing --env OMNITRACE_PERFETTO_BUFFER_SIZE_KB=5120000 will change the default value in app.inst to 5120000 KiB (5 GiB):
# defaults to 5 GiB buffer size
omnitrace-instrument -o app.inst --env OMNITRACE_PERFETTO_BUFFER_SIZE_KB=5120000 -- /path/to/app
omnitrace-run -- ./app.inst
# override default 5 GiB buffer size to 200 MB via command-line
omnitrace-run --trace-buffer-size=200000 -- ./app.inst
# override default 5 GiB buffer size to 200 MB via environment
export OMNITRACE_PERFETTO_BUFFER_SIZE_KB=200000
omnitrace-run -- ./app.instRuntime instrumentation will not only instrument the text section of the executable but also the text sections of the
linked libraries. Thus, it may be useful to exclude those libraries via the -ME (module exclude) regex option
or exclude specific functions with the -E regex option.
omnitrace-instrument -- /path/to/app
omnitrace-instrument -ME '^(libhsa-runtime64|libz\\.so)' -- /path/to/app
omnitrace-instrument -E 'rocr::atomic|rocr::core|rocr::HSA' -- /path/to/appUse the omnitrace-python script to profile/trace Python interpreter function calls.
Use a double-hypen (--) to separate the command-line arguments for omnitrace-python from the target script and it's arguments.
omnitrace-python --help
omnitrace-python <omnitrace-options> -- <python-script> <script-args>
omnitrace-python -- ./script.py
Please note, the first argument after the double-hyphen must be a Python script, e.g. omnitrace-python -- ./script.py.
If you need to specify a specific python interpreter version, use omnitrace-python-X.Y where X.Y is the Python
major and minor version:
omnitrace-python-3.8 -- ./script.pyIf you need to specify the full path to a Python interpreter, set the PYTHON_EXECUTABLE environment variable:
PYTHON_EXECUTABLE=/opt/conda/bin/python omnitrace-python -- ./script.pyIf you want to restrict the data collection to specific function(s) and its callees, pass the -b / --builtin option after decorating the
function(s) with @profile. Use the @noprofile decorator for excluding/ignoring function(s) and its callees:
def foo():
    pass

@noprofile
def bar():
    foo()

@profile
def spam():
    foo()
    bar()
Each time spam is called during profiling, the profiling results will include 1 entry for spam and 1 entry
for foo via the direct call within spam. There will be no entries for bar or the foo invocation within it.
- Visit ui.perfetto.dev in the web-browser
- Select "Open trace file" from panel on the left
- Locate the omnitrace perfetto output (extension:
.proto)
Perfetto tracing with the system backend supports multiple processes writing to the same
output file. Thus, it is a useful technique if Omnitrace is built with partial MPI support
because all the perfetto output will be coalesced into a single file. The
installation docs for perfetto can be found here.
If you are building omnitrace from source, you can configure CMake with OMNITRACE_INSTALL_PERFETTO_TOOLS=ON
and the perfetto and traced applications will be installed as part of the build process. However,
it should be noted that to prevent this option from accidentally overwriting an existing perfetto install,
all the perfetto executables installed by omnitrace are prefixed with omnitrace-perfetto-, except for the perfetto
executable, which is just renamed omnitrace-perfetto.
Enable traced and perfetto in the background:
pkill traced
traced --background
perfetto --out ./omnitrace-perfetto.proto --txt -c ${OMNITRACE_ROOT}/share/perfetto.cfg --background
NOTE: if the perfetto tools were installed by omnitrace, replace
tracedwithomnitrace-perfetto-tracedandperfettowithomnitrace-perfetto.
Configure omnitrace to use the perfetto system backend via the --perfetto-backend option of omnitrace-run:
# enable sampling on the uninstrumented binary
omnitrace-run --sample --trace --perfetto-backend=system -- ./myapp
# trace the instrument the binary
omnitrace-instrument -o ./myapp.inst -- ./myapp
omnitrace-run --trace --perfetto-backend=system -- ./myapp.inst
or via the --env option of omnitrace-instrument + runtime instrumentation:
omnitrace-instrument --env OMNITRACE_PERFETTO_BACKEND=system -- ./myapp


