This project contains the code and setup for the visit structure display used in the ABCD study.
There are two ways to display the visit structure, (i) by participant and (ii) by site.
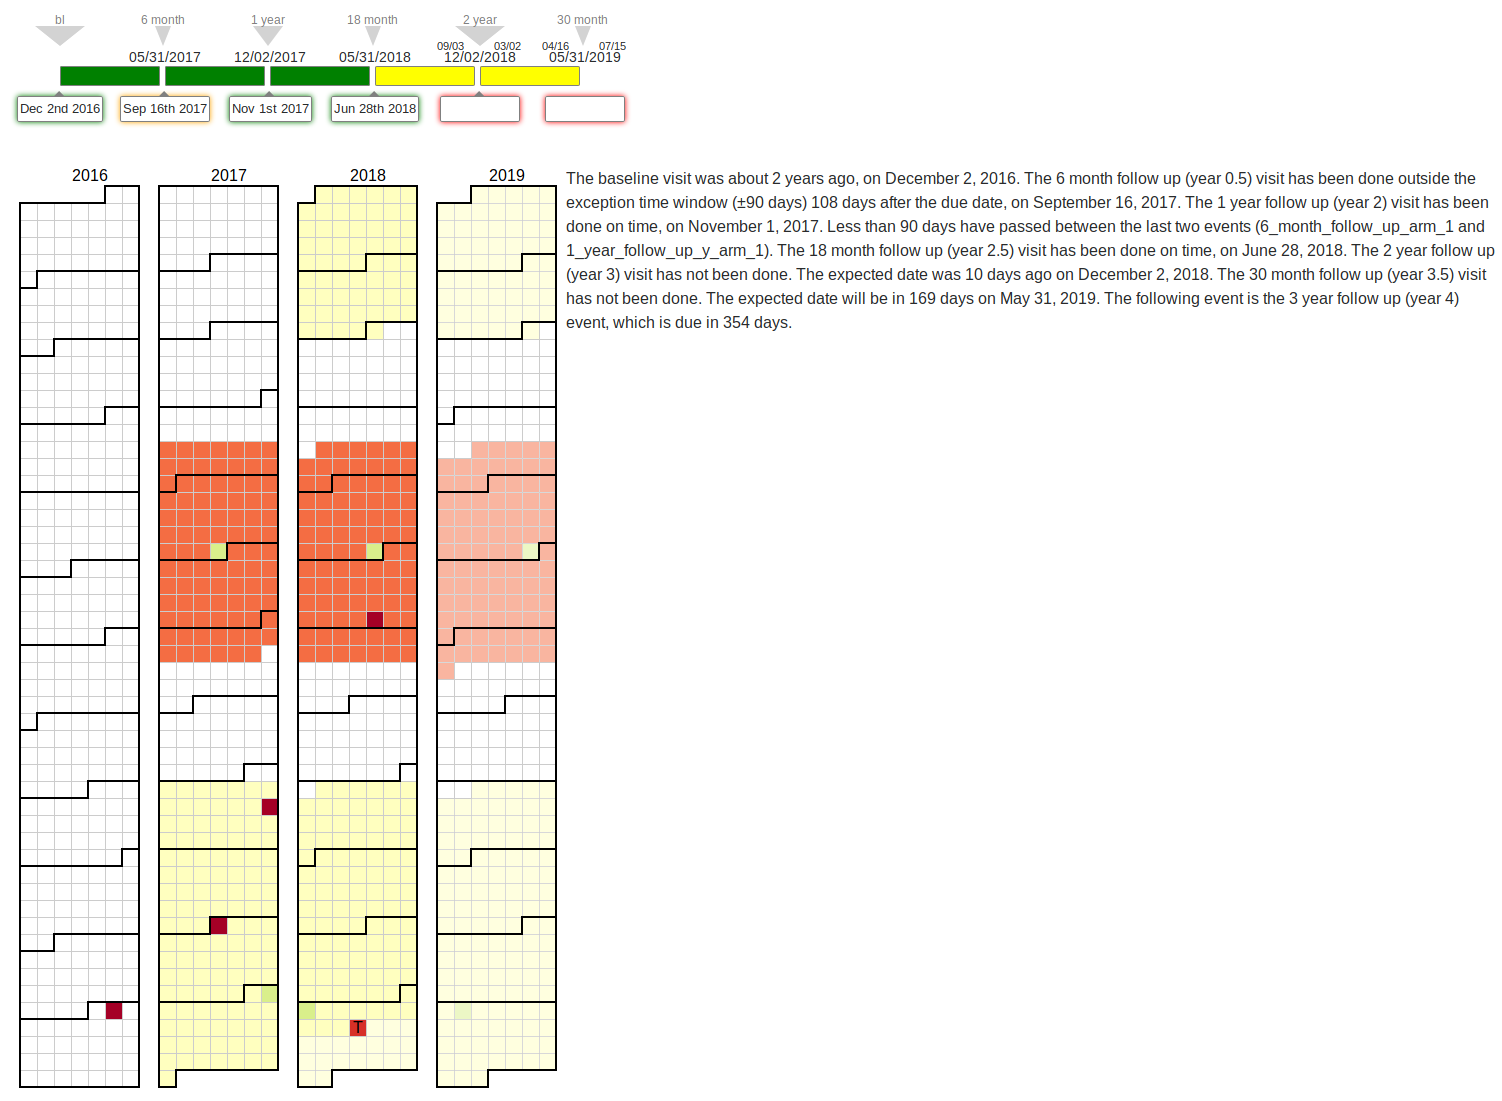
In this case we show the visit structure in three ways. A simplified graphical representation designed to use a minimum of screen space suitable for scheduling. A by-day-of-the-study view that uses up more space and as a textural representation.
All the data for the three views are generated from information about the visit structure in REDCap. Other sources of information (dates and study design) can be added to make this suitable for other projects.
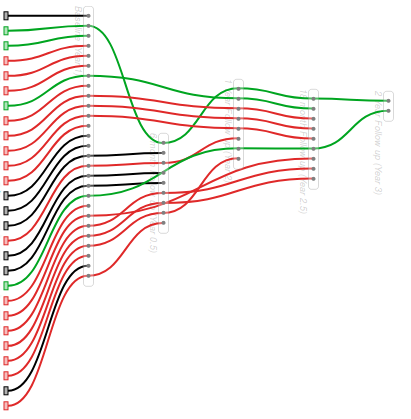
In order to get an overview of the missed visits by data collection site the following story-mode display is used. Each block on the left represents a participants with missed visits. The visits are displayed as vertical blocks connected by red participant lines. Different colors are used to indicate if a participant is withdrawn (black) or part of a substudy (green). This display allows for a comparisson between sites about the amount of missingness and about pattern of missingness at sites.