Scatter Chart Custom Visual for PowerBI implemented using plotly.js
Using outstanding plotly scatter chart within PowerBI
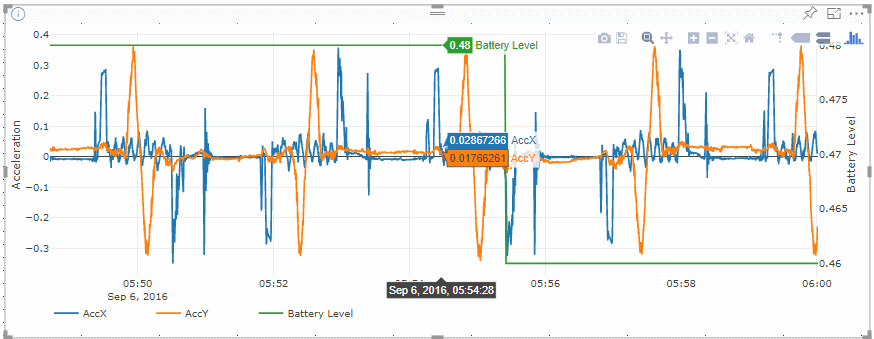
- Zoomable
- Tooltips showing exact value
- Second Y-Axis
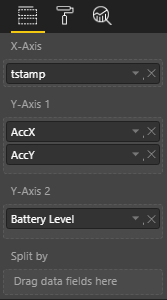
- Split data into multiple traces
Data is always sampled to max 10000 records (see dataReductionAlgorithm in capabilities.json). Like this it's possible to see an overview of bigger datasets.
Sample Chart:
Field Configuration:
Format Configuration:
Precondition: npm, typings and pbiviz are installed.
- typings install
- pbiviz update
- Create customized lodash build in ./external:
- install lodash-cli: npm i -g lodash-cli
- lodash category=array,collection,object,lang -o external\lodash.custom.js
- Download plotly-basic.min.js library into directory ./external from the following URL: https://cdn.plot.ly/plotly-basic-latest.min.js
- Create custom visual file: pbiviz package
- Use ./dist/plotlyscatter.pbiviz in PowerBI Desktop and Online


