For more information please visit the WIKI
This is a PC application used to parse and analyze Star Trek Online combat logs. I became interested in trying out STO random elites, but I was curious if my Space DPS was up to snuff. After a little research, I found a reddit post which had a brief outline of the combat log, and the available fields. I figured doing a real-time DPS analyzer would be futile, until I could wrap my head around the combat log and it's fields.
This app displays a breakdown of damage types, using calculations based on the absolute value of the magnitude field from the STO combat log file entries. Caluclations for DPS, Total Damage, and Max Damage are displayed. Information like resists and such aren't included.
The source in this repo is wrapped up in a Visual Studio 2022 solution. You should be able to clone this repo localy, then build and run from inside of Visual Studio.
You could also run the dotnet cli build and run commands from inside the zxeltor.StoCombatAnalyser.Interface project folder as well.
See the wiki for more details.
After you have a successful build, do the following to get started using the application.
- Start the application
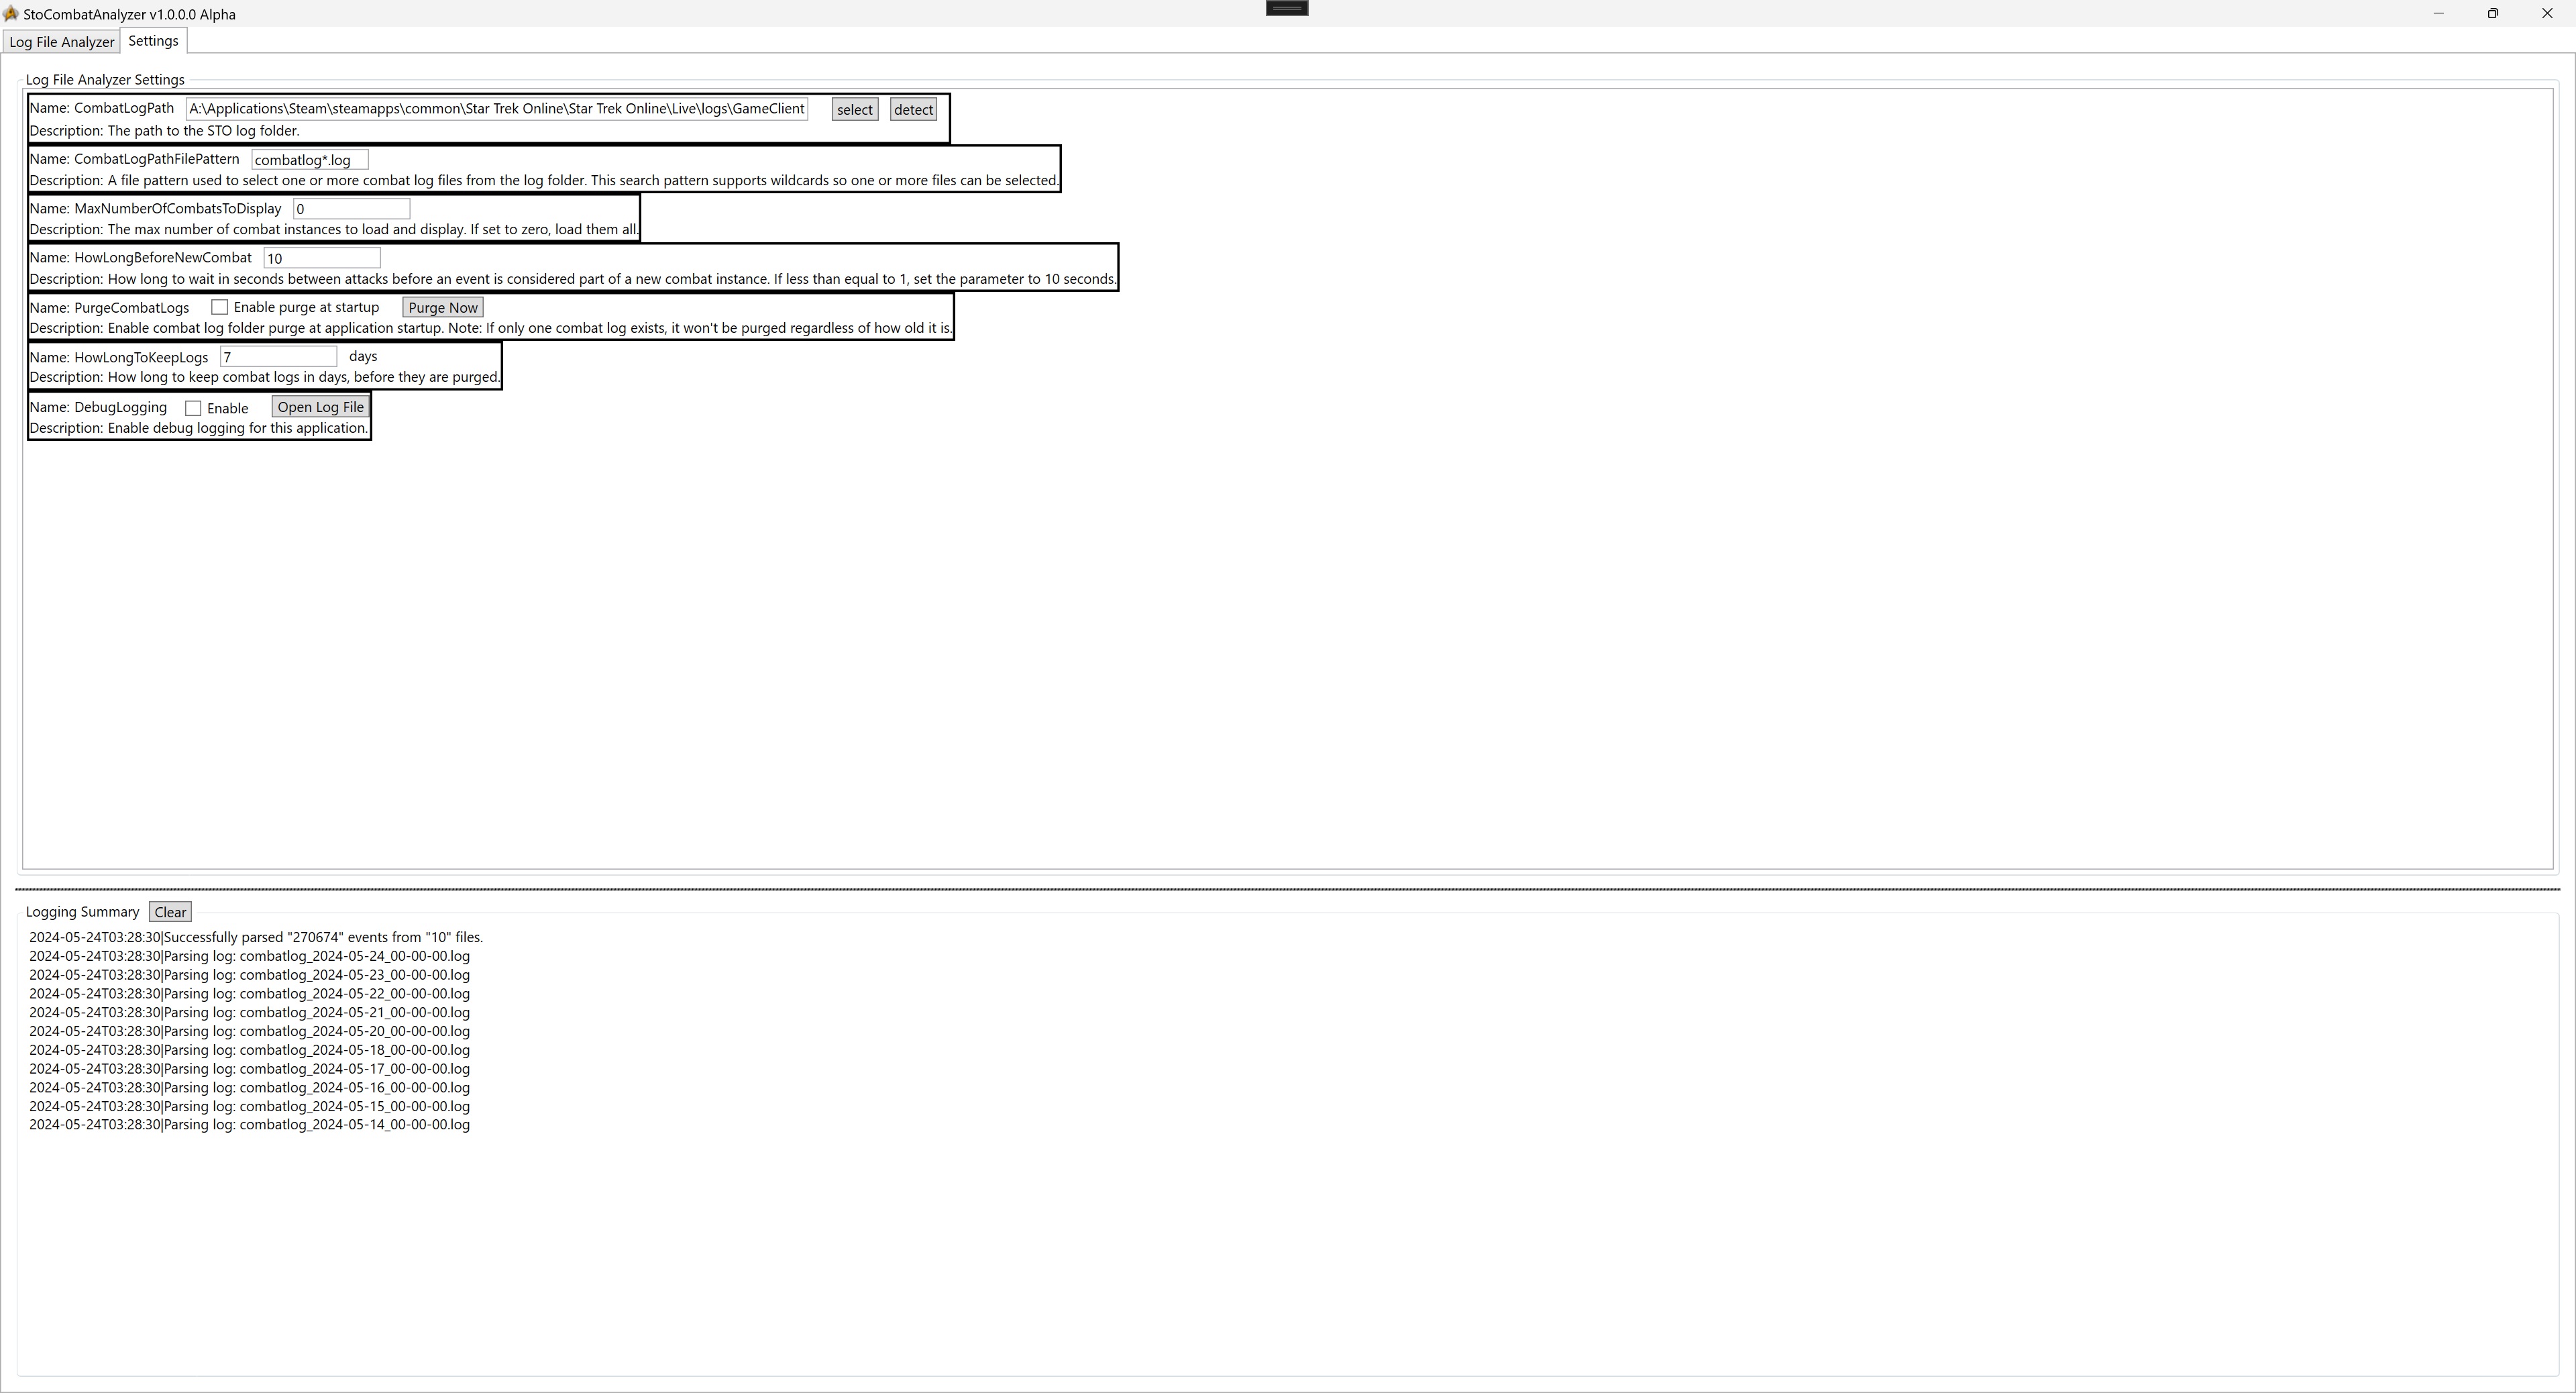
- Under the Settings tab, set the following settings:
- CombatLogPath: Set this to match the STO log folder on your local machine.
- If you click the select button, a folder select dialog will appear to help you select a folder.
- If you click the detect button, the application will attempt to get the STO install folder from the windows registry. A dialog box will appear to let you know if it was succesfull, and will update the field with the STO log folder if it was.
- CombatLogPathFilePattern: Set a file pattern used to select one or more combat log files.
- This search pattern supports wildcards so more then one file can be selected.
- MaxNumberOfCombatsToDisplay You can set the number of combat instances to display in the UI after you parse the logs.
- If you set this to 0 or less, it will display all combat instances
- PurgeCombatLogs Enable combat log folder purge at application startup.
- Note: If only one combat log exists, it won't be purged regardless of how old it is.
- HowLongToKeepLogs How long to keep logs in days, before they are purged.
- DebugLogging Enables debug logging. This also enables/disables a few information dialogs in the UI.
- CombatLogPath: Set this to match the STO log folder on your local machine.
- Switch to the Log File Analyzer tab:
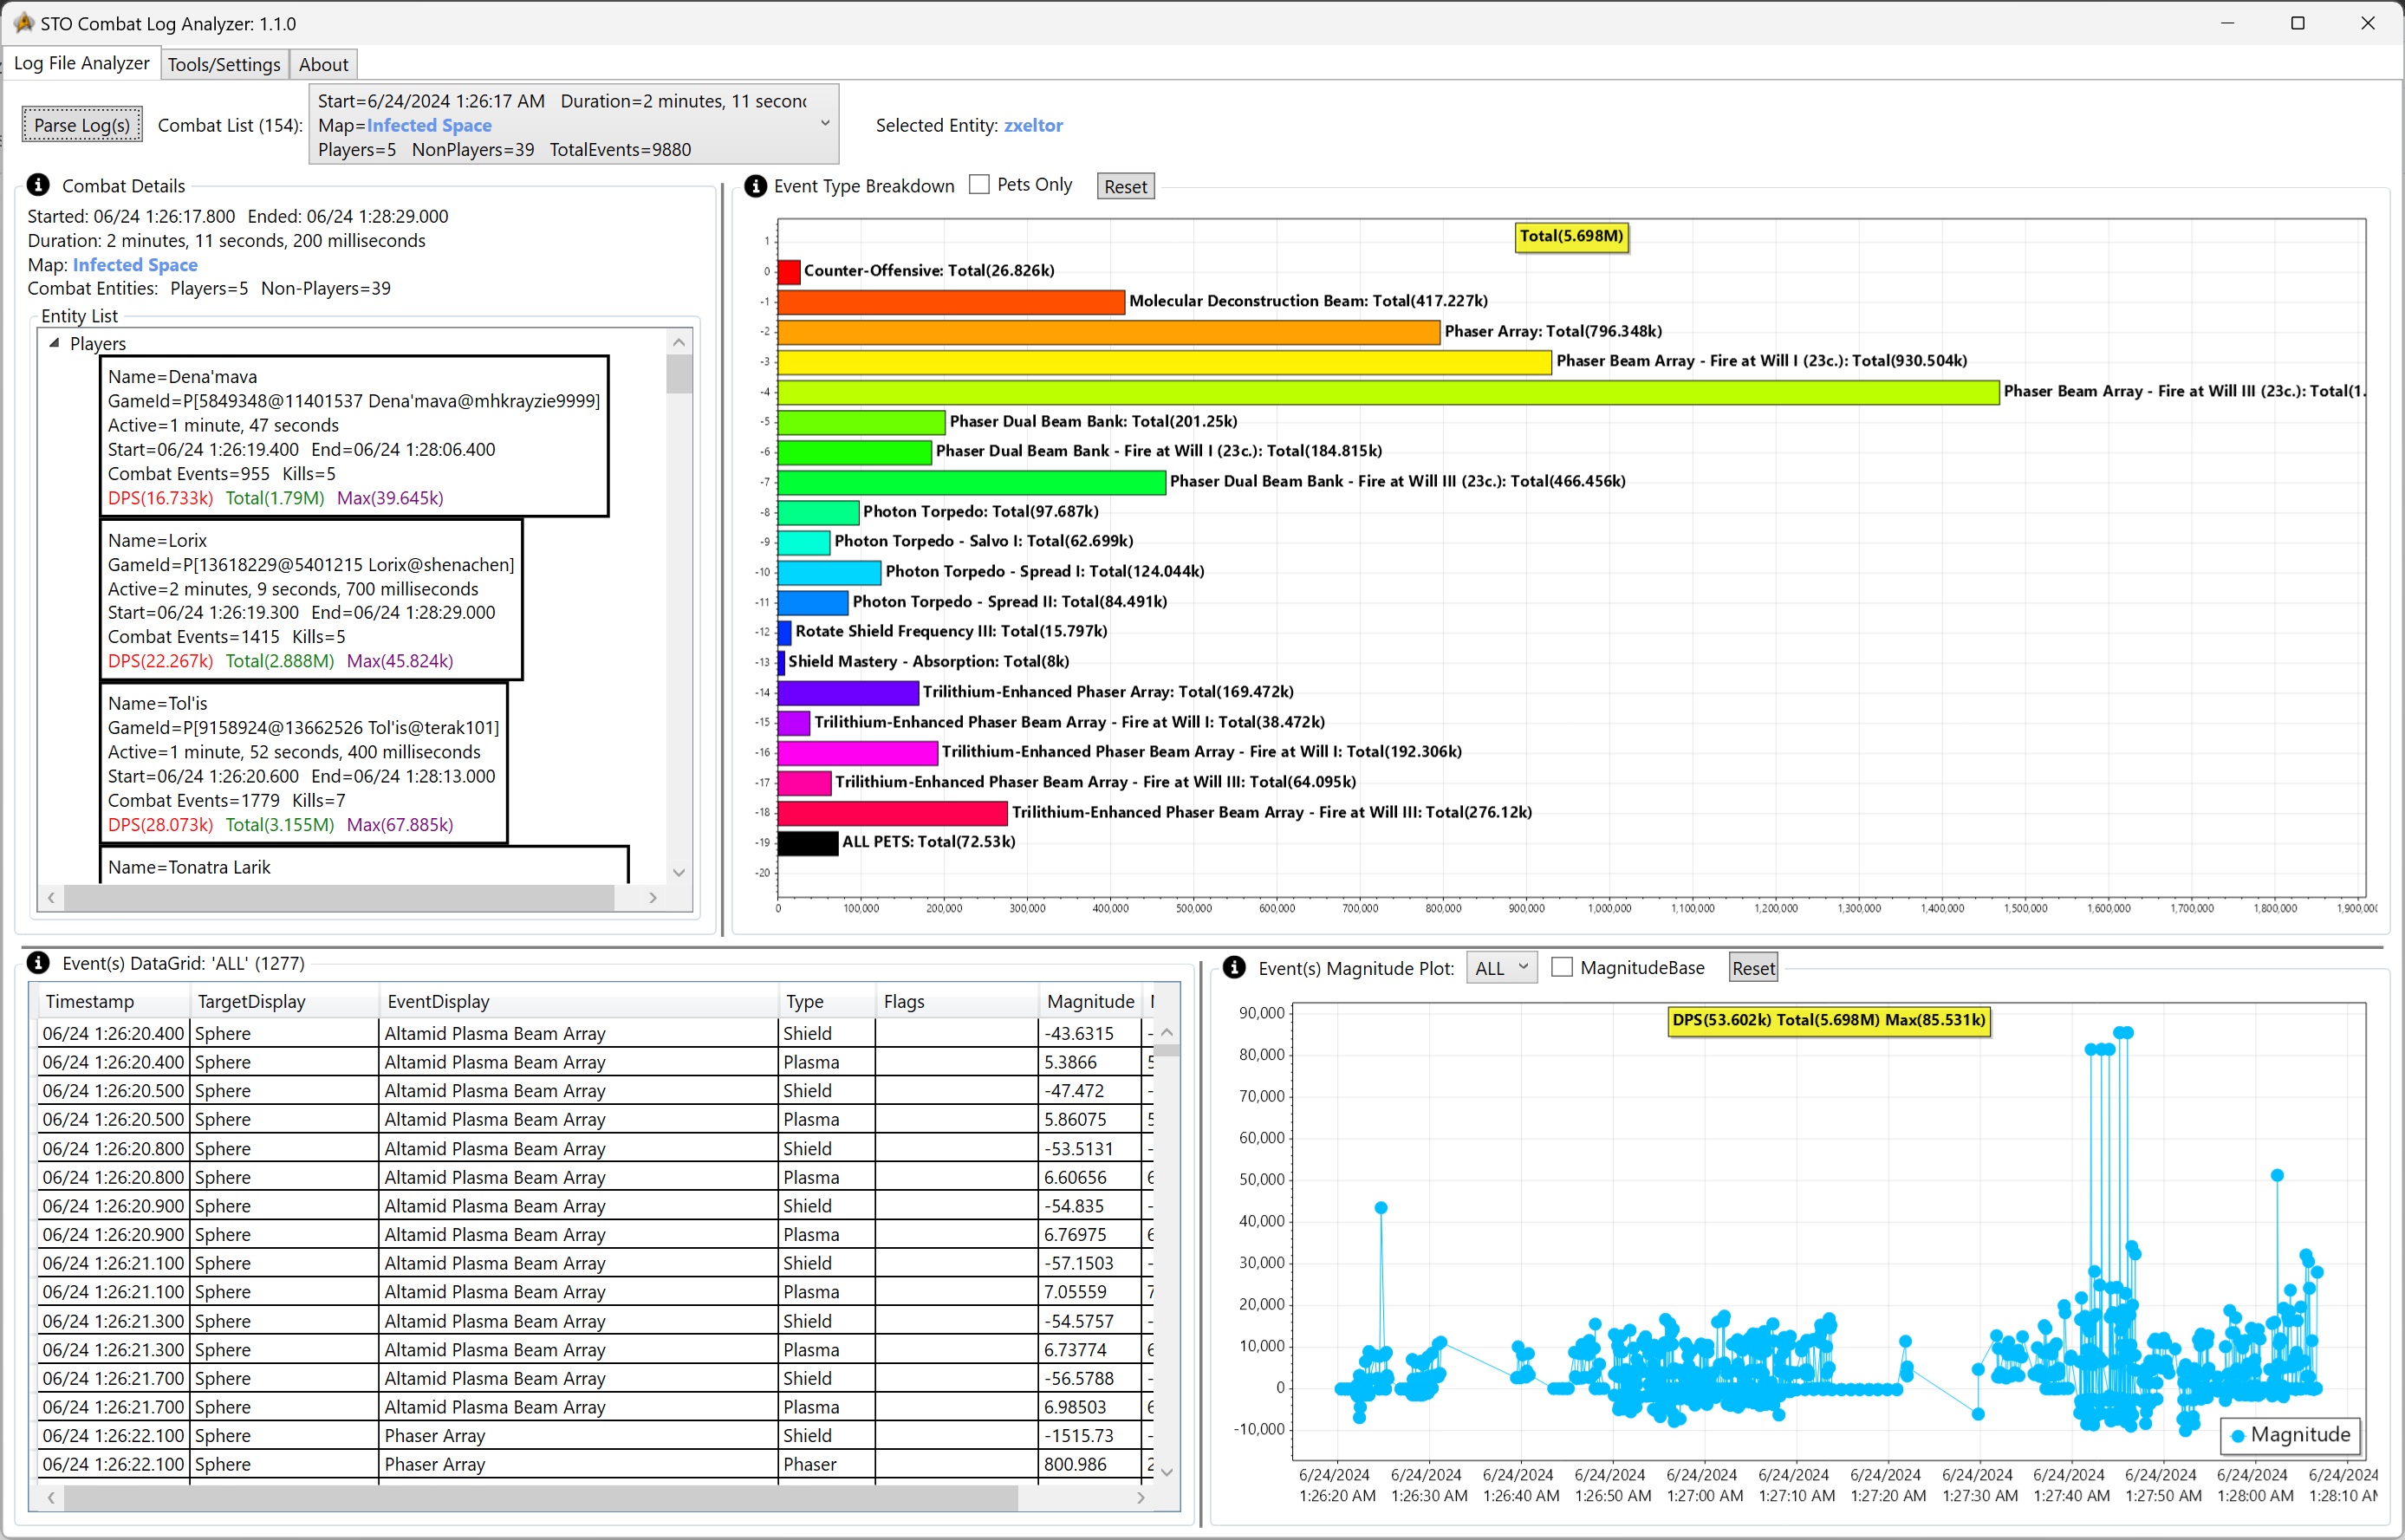
- Click the Parse Log(s) button. If successful, you should see something similar to the following.
- A dialog will appear and inform you of success, or failure. If a failure occurs, there should be details on what to do.
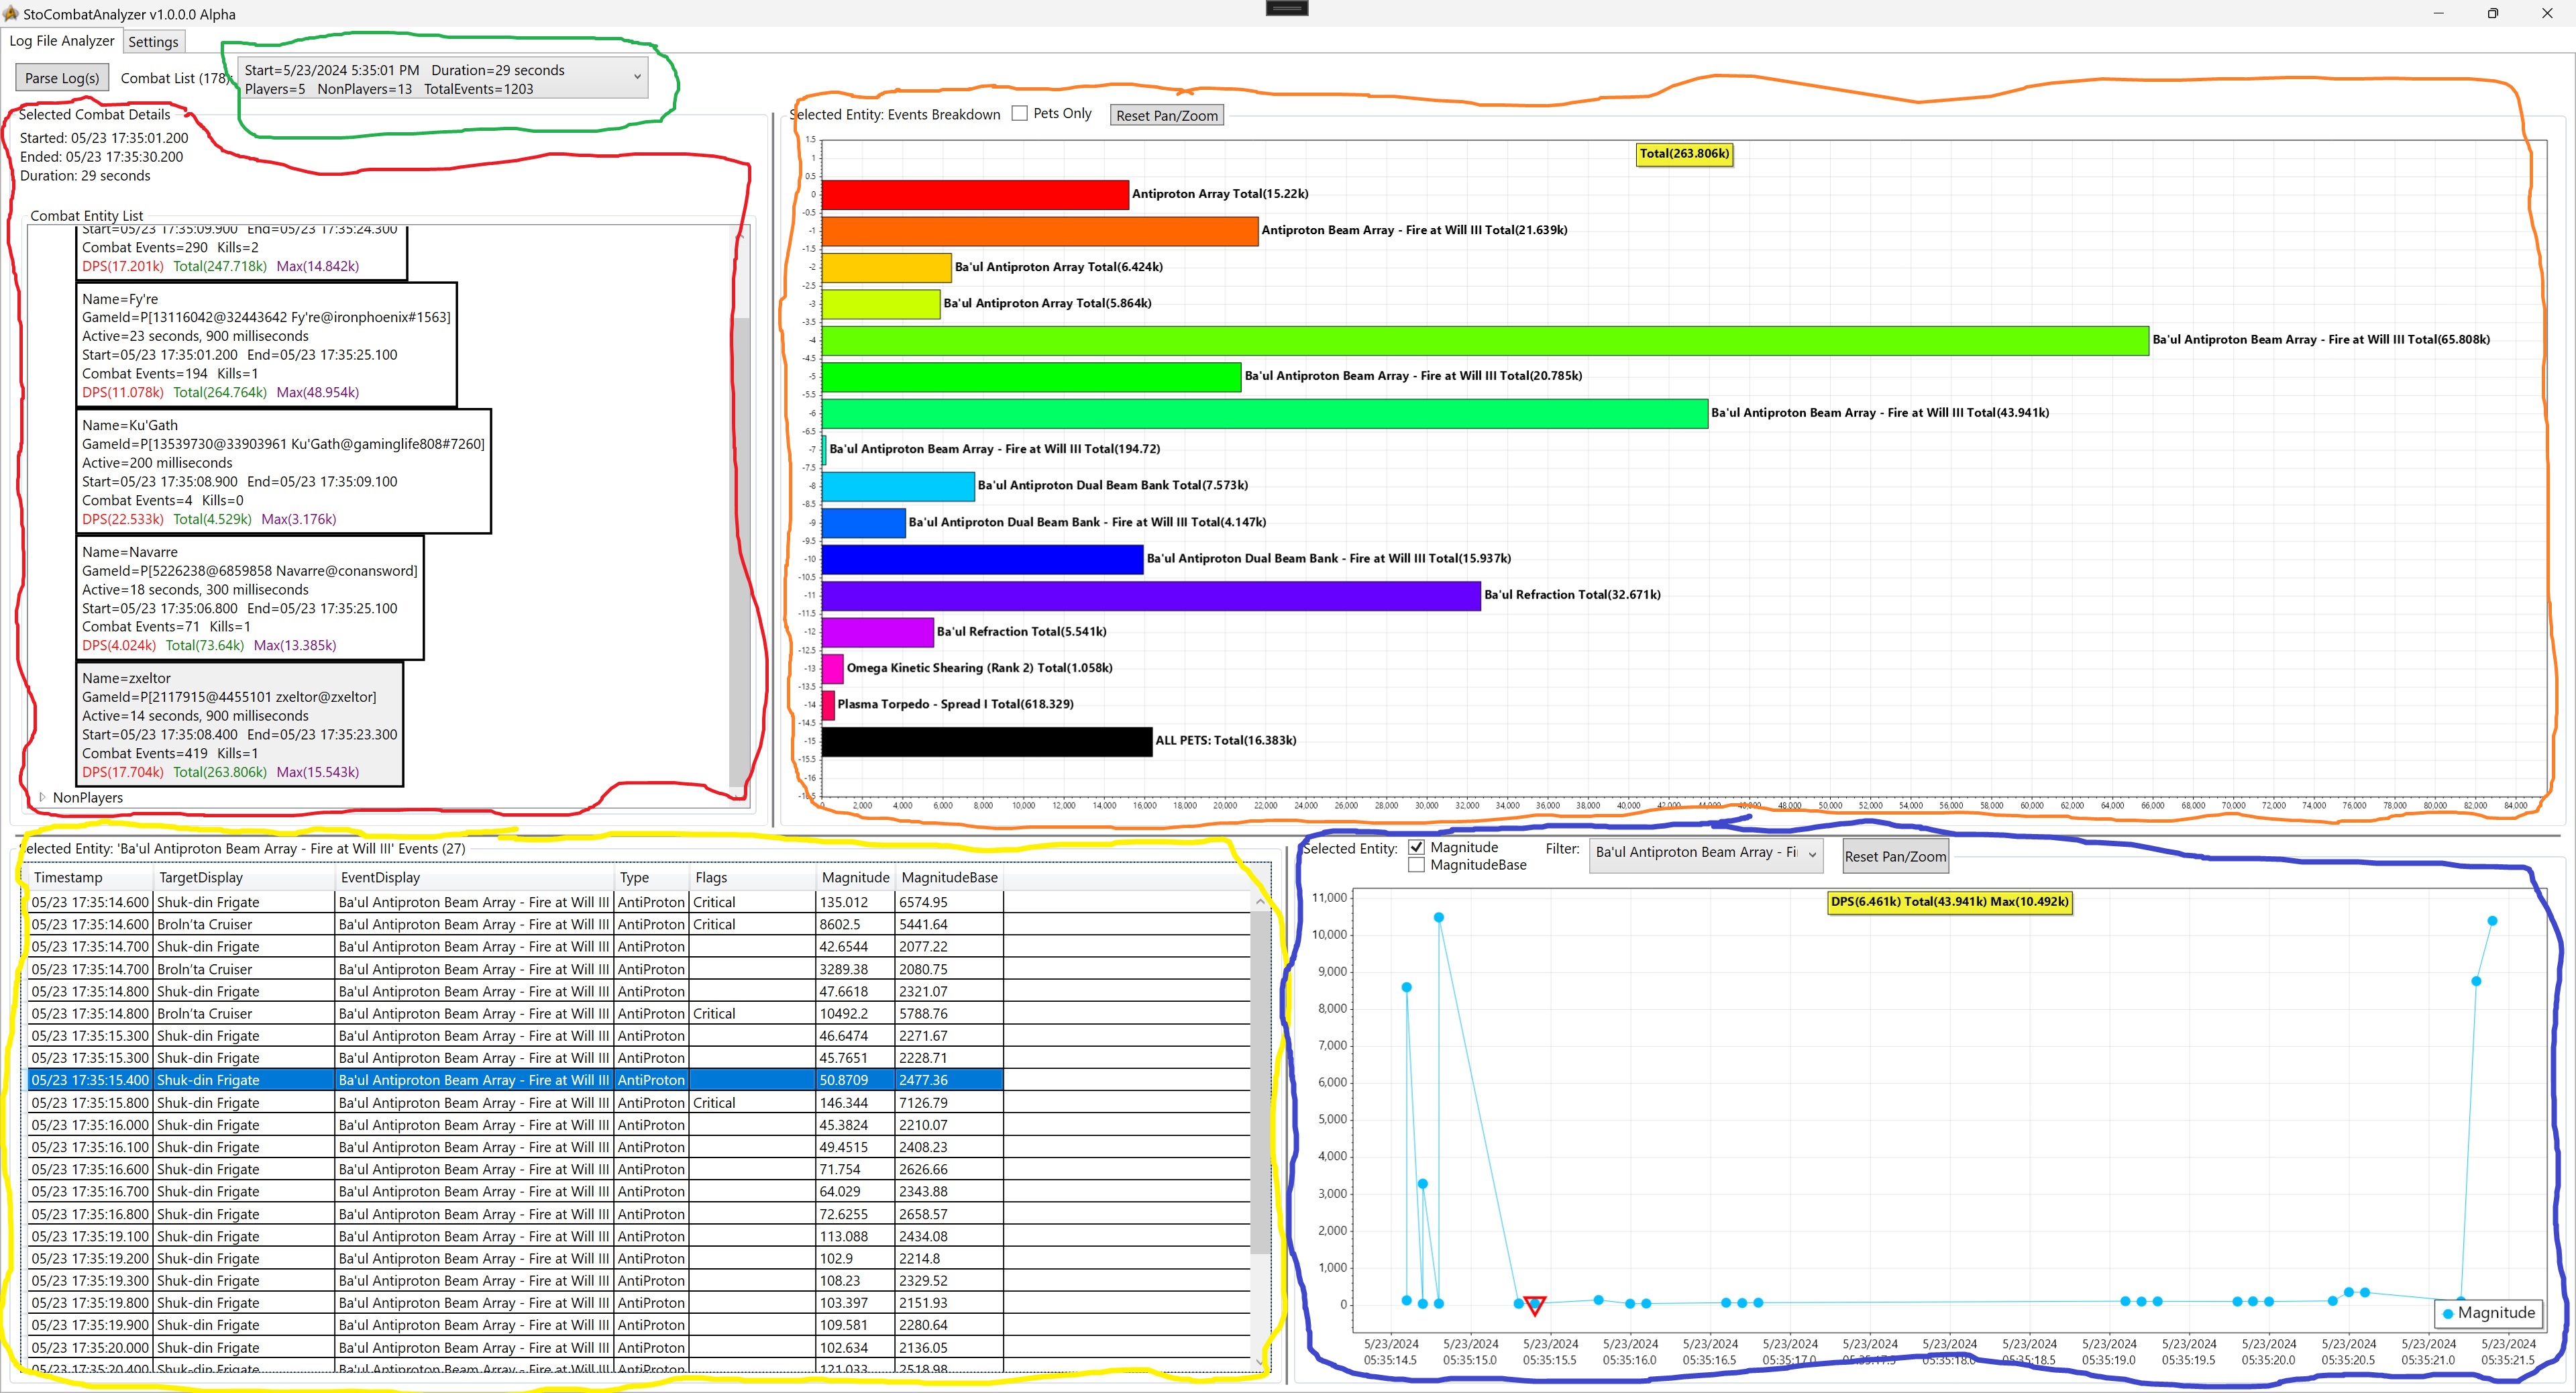
When you click the Parse Log(s) button, the application goes to the STO combat log folder and parses all available combat logs. The log entries are then organised into combat instances, which populates the Combat List dropdown list (circled in green).
When you select a combat instance from the Combat List, the Selected Combat Details section (circled in red) is populated with information on the seletced combat instance. Each combat instance has a list of events, which is broken down into Player and Non-Player entities.
When you select a Player or Non-Player entity, the rest of the UI updates with information concerning the damage the selected entity did during for the currently selected combat instance.
This barchart gives you a breakdown of damage types the Player or Non-Player entity did. If you select the Pets Only checkboox, the bar chart will switch to displaying a breakdown of damage types used by the Player or Non-Player entity pets.
When you click on one of the bars, the Selected Entity: Data Grid (circled in yellow) and Selected Entity: Scatter Plot (circled in blue) update with data for the selected damage type.
This data grid displays the raw data from the STO combat logs related to the currently selected Player or Non-Player damage type. If you selected an entry in the grid, it will highlight a marker on the scatter plot (circled in blue).
This scatter plot displays the currently selected Player or Non-Player damage type over time. When you select a marker on the scatter splot, it will highlight an entry in the data grid (circled in yellow).
If you select another damage type from the Filter dropdown, the scatter plot and data grid (circled in yellow), will switch to displaying data for that damage type.
This software and any related documentation is provided “as is” without warranty of any kind, either express or implied, including, without limitation, the implied warranties of merchantability, fitness for a particular purpose, or non-infringement. Licensee accepts any and all risk arising out of use or performance of Software
Note: We are not affiliated, associated, authorized, endorsed by, or in any way officially connected with the game Star Trek Online, or any of its subsidiaries or its affiliates. The official Star Trek Online website can be found at https://www.playstartrekonline.com/


