Fractal: A General Purpose Architecture for Estimating the Fractal Dimension of any Pattern or Geometry
Status: Experimental
Written by Kazuaki Iida
Read this in Japanese: 日本語版ガイド
Fractal provides a convenient framework to estimate the fractal dimension of any pattern contained in an image, or any geometry contained in a point cloud using the box counting method. This framework is a command-line implementation of the MATLAB implementation found here. The following implementation is completely open-source, and it also does not have the same memory restriction that MATLAB places on the size of datasets.
| Input Data Dimension | Primary Feature | Secondary Feature |
|---|---|---|
| 2D (image) | fractal analysis core program | N/A |
| 3D (point cloud) | fractal analysis core code | visualization tool (point clouds), point cloud file conversion |


| Name | Programming language used | Description |
|---|---|---|
| fractal2d | C++ | fractal analysis program for image (2D pattern) |
| fractal3d | C++ | fractal analysis program for 3D dataset |
| visualize | C++ | visualize a 3D dataset using PCL's native viewer |
| ascii2pcd | C++ | convert an ASCII point cloud to a PCD file |
| plot_fractal.py | Python | post-process fractal analysis results by creating a plot to help estimate the fractal dimension |
| plot_fractal.m | MATLAB | MATLAB version of post-processing program |
| visualizeDataset.m | MATLAB | renders any ASCII point cloud dataset using MATLAB. You will need the computer vision toolbox to use this. |
- CMake (version 2.8 or higher)
- PCL (for point cloud processing and visualization)
- OpenCV (for 2D analysis and image operations)
- Eigen
- Boost
- Python and/or MATLAB (for plotting and optional visualization)
The following installation procedure has only been confirmed on Ubuntu 14.04.
- Clone the repository to local computer.
$ git clone https://github.com/kaziida24/fractal- Move into the fractal directory, make a "build" directory, and move into the "build" directory.
$ cd fractal
$ mkdir build
$ cd build- Call CMake to autogenerate the Makefile and the MATLAB and Python scripts.
$ cmake ..- Build the project using make.
$ make all Call the fractal2d executable along with the filename of the input image. The name of the output file will be printed to screen at the end of the program. For example, the following input produces an output file called image_output.txt.
$ ./fractal2d image.jpgCall the ascii2pcd executable along with the filename of the dataset. If you have an ASCII point cloud file, this is the preceding step before the fractal3d executable is called.
Example: This command takes an ASCII file called dataset.txt and creates a PCD file called dataset.pcd.
$ ./ascii2pcd dataset.txt Call the fractal3d executable along with the filename of the input PCD file. The program will print the name of the output file to screen. For example, the following input produces an output file called dataset_output.txt.
$ ./fractal3d dataset.pcdCall the visualize executable along with the filename of the PCD file you would like to visualize.
$ ./visualize dataset.pcd Any of the executables can be run with the help flag (-h) to display the help menu, which explains how to run the executable and what command line arguments to include.
Example: Access help menu for fractal2d.
$ ./fractal2d -hExample: Access help menu for ascii2pcd.
$ ./ascii2pcd -hExample: Access help menu for fractal3d.
$ ./fractal3d -hExample: Access help menu for visualize.
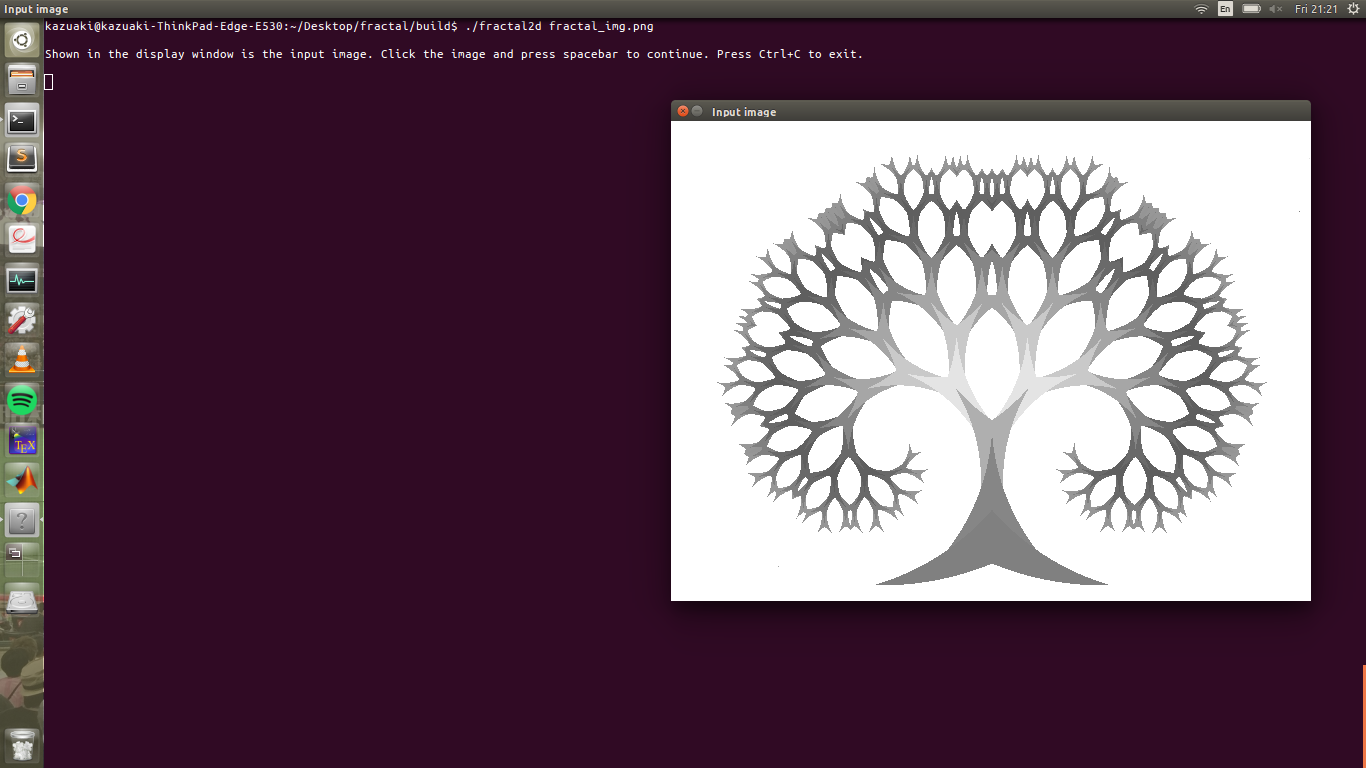
$ ./visualize -hThis example will detail the procedure in estimating the fractal dimension of the pattern in the following image.

This image must first be saved in the images folder. This is the default directory where fractal2d will look for the image file. The analysis can be initiated by running the executable with the corresponding image filename. In this case, the image filename is fractal_img.png.
$ ./fractal2d fractal_img.png The on-screen instructions will tell you to press spacebar to continue. Please follow the instructions until it states that the analysis is complete.
You will now have the option to post-process directly in Python. Post-processing produces the following plots.
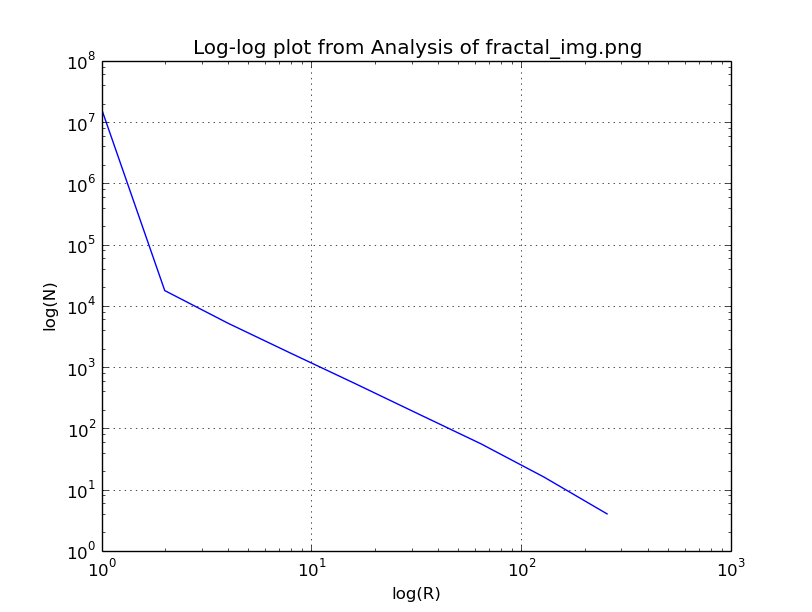
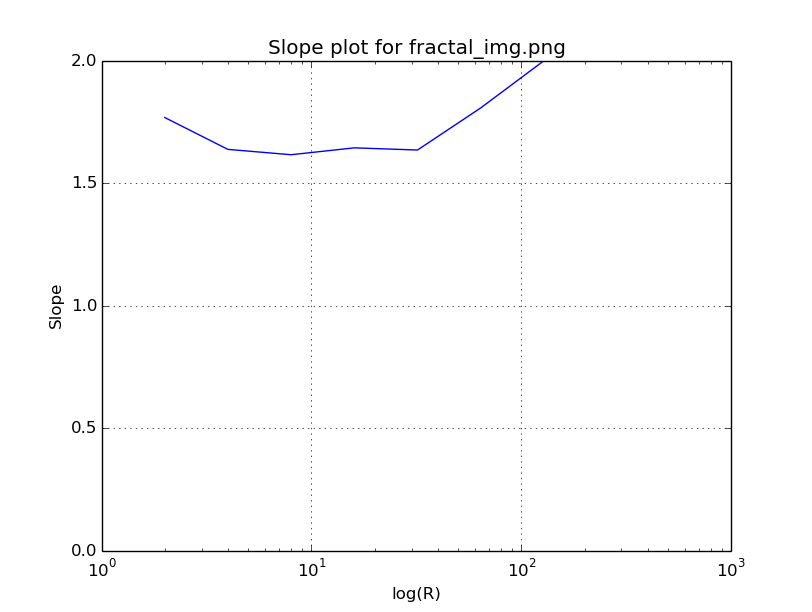
On the top is the canonical fractal analysis plot showing a log-log plot of the number of boxes needed to fill the image and the corresponding bin size. The slope in the constant region of the slope plot is around 1.65. According to this result, the pattern contained in the image is indeed a fractal set since it has a noninteger fractal dimension that is larger than its topological dimension (1). The topological dimension is 1 since the branch can be approximated as a continuous curve.
Email: kiida2@illinois.edu