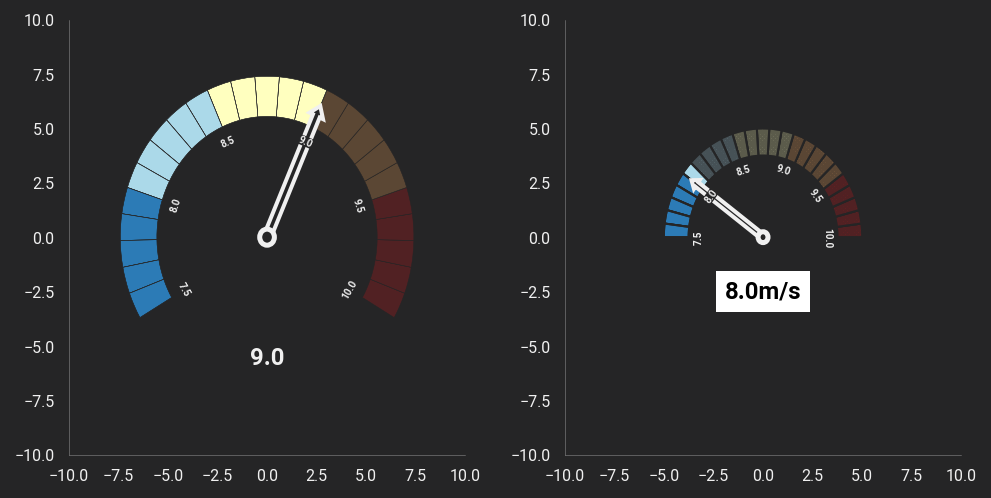
A class to plot speedometer plots
Installation
# 1) Download the package
cd speedo # or the path you saved it to
pip install .
if you only download
change "from speedo.speedometer import Speedometer"
to "speedo.speedo.speedometer import Speedometer" below.
### Example

import matplotlib.pyplot as plt
%config InlineBackend.figure_format = "retina"
%matplotlib inline

from speedo.speedometer import Speedometer
import themepy

theme = themepy.Theme('dark')
plt.rcParams['axes.grid'] = False

fig, ax = plt.subplots(1, 2, figsize=(8, 4))


speedo = Speedometer(center=(0, 0),
            start_value = 7.5,
            end_value = 10,
            value = 9.,
            radius=7.4,
            label_fontsize=5,
            annotation_fontsize=12,
            ax=ax[0])

Speedometer(center=(0, 0),
            radius=5,
            start_value = 7.5,
            end_value = 10,
            value = 8.,
            label_fontsize=5,
            annotation_fontsize=12,
            patch_lw=1,
            fade_alpha=0.5,
            fade_hatch='xxxxxxxxxxxxx',
            annotation_facecolor='w',
            annotation_fontcolor='k',
            annotation_pad=5,
            annotation_offset=0.5,
            start_angle=0,
            unit='m/s',
            end_angle=180,
            ax=ax[1]
            )

for ax_ in ax:
    ax_.set_xlim(-10, 10)
    ax_.set_ylim(-10, 10)

plt.show()