update ended in 4th July 2022
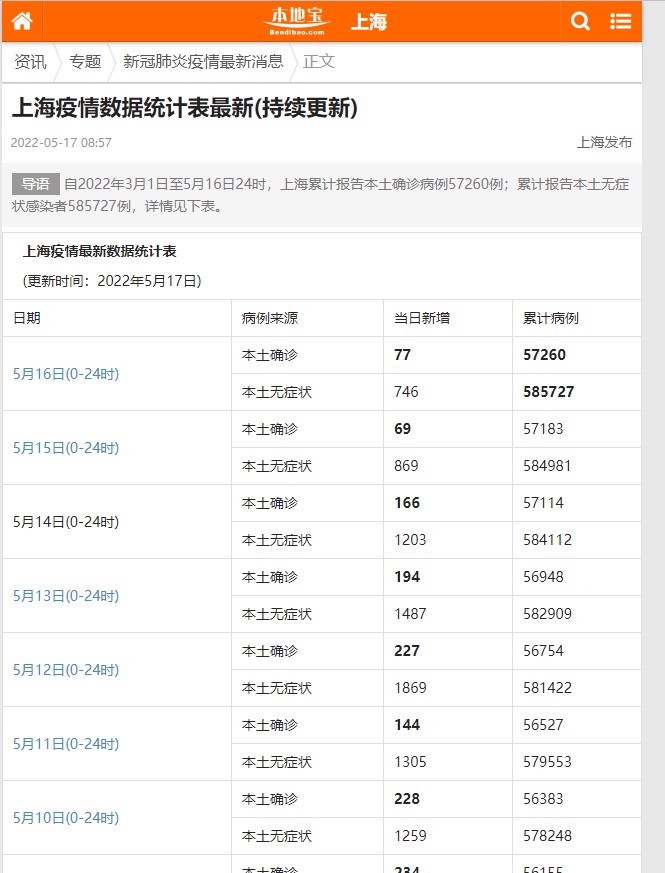
- Scrap data from 上海本地宝
- local_url="http://m.sh.bendibao.com/mip/233243.html"
- data provide in a table
- scrap all items from table
# acquire html
html_resp = download(local_url)
assert html_resp, '数据获取错误'
html_soup = BeautifulSoup(html_resp, 'html.parser')
tr = html_soup.find('table').find_all('tr')  # 查找表格内所有内容
table_info = tr[0].find_all('td')[0].text.replace('\t', '').replace('\n', '').split('\r')-
data structure
SH_COVID19_DATA structurenote: no death data in the table table_url
| date | NewInfection | NewAsymptomatic | AllInfection | AllAsymptomatic | Death |
|---|---|---|---|---|---|
| 2022-05-12 | 227 | 1869 | 56754 | 581422 | 0 |
| 2022-05-11 | 144 | 1305 | 56527 | 579553 | 0 |
| ... | ... | ... | ... | ... | ... |
- dict data form:
SH_COVID19_DATA:
{"Date":list[date], "NewInfection": list[int], "NewAsymptomatic": list[int], "AllInfection": list[int], "AllAsymptomatic": list[int], "Death": list[int] }
-
transform to pandas dataframe
-
save pandas dataframe data to sqltable,csv,xlsx,json
via plotnine
- line-plot
- Calendar plot
results:

