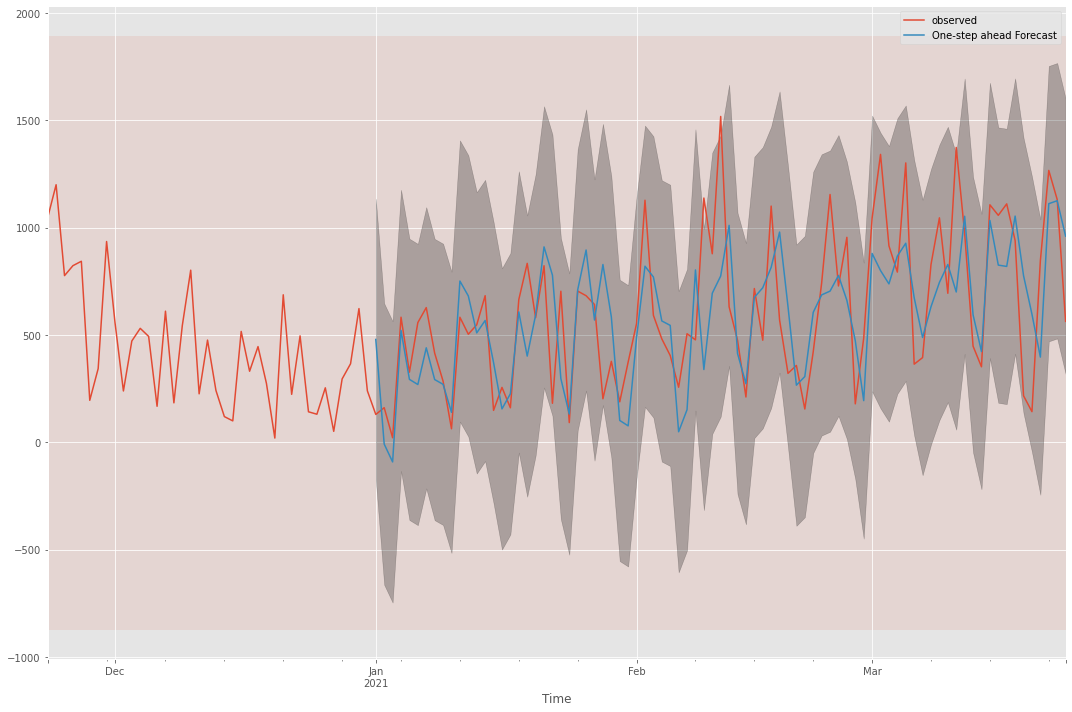
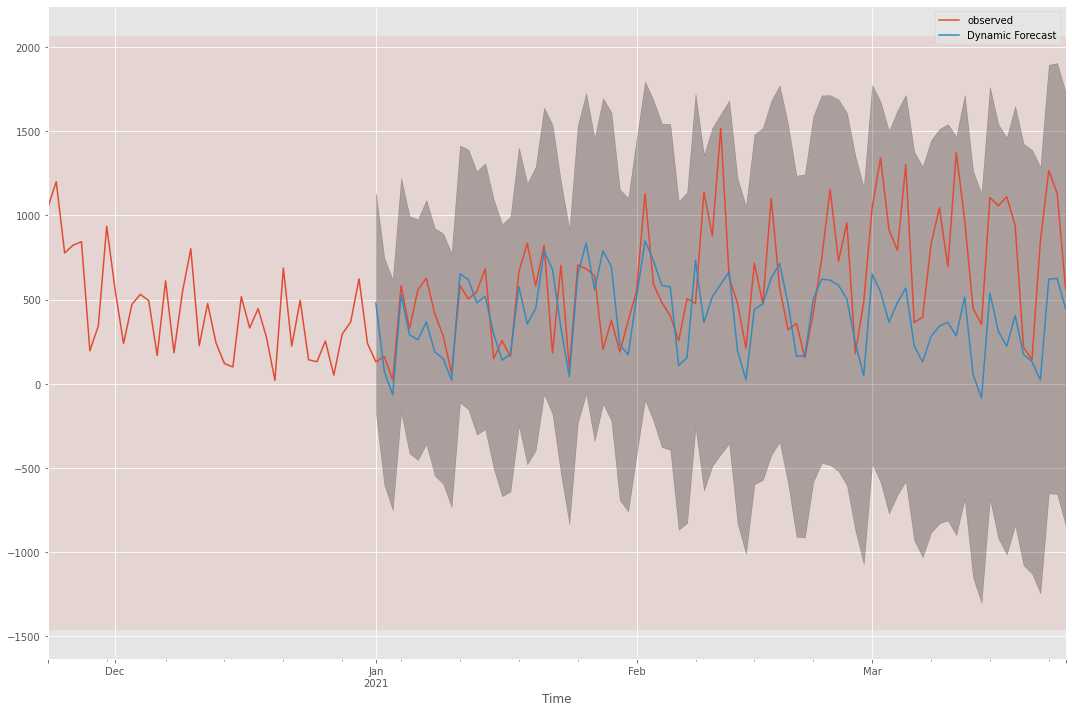
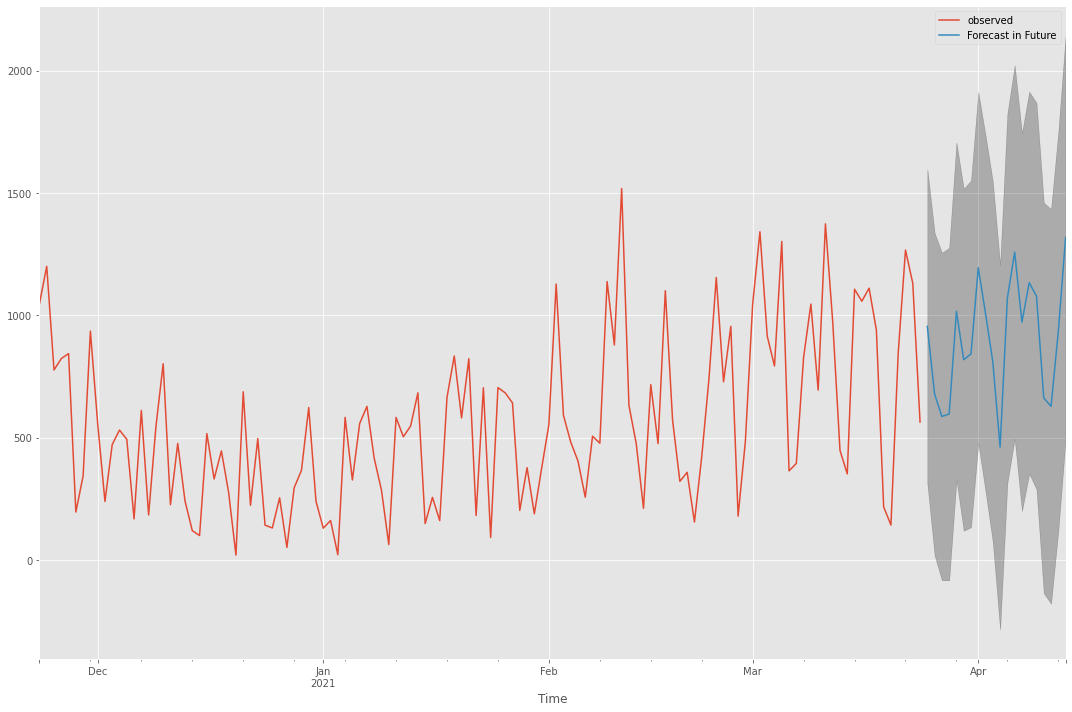
In this section, we used the SARIMA (Seasonnal AutoRegressive Integrated Moving Average) method to train our database (database trained at the end of 2020) and to make a forecast for April 2, 2021 at 9:00 AM. The prediction could have been improved by adding exogenous parameters like weather, temperature...
preprocess.pypreprocessing filearima_method.pypython class containing the methodarima_script_1.ipynbexecution scriptarima_script_2.ipynbexecution script
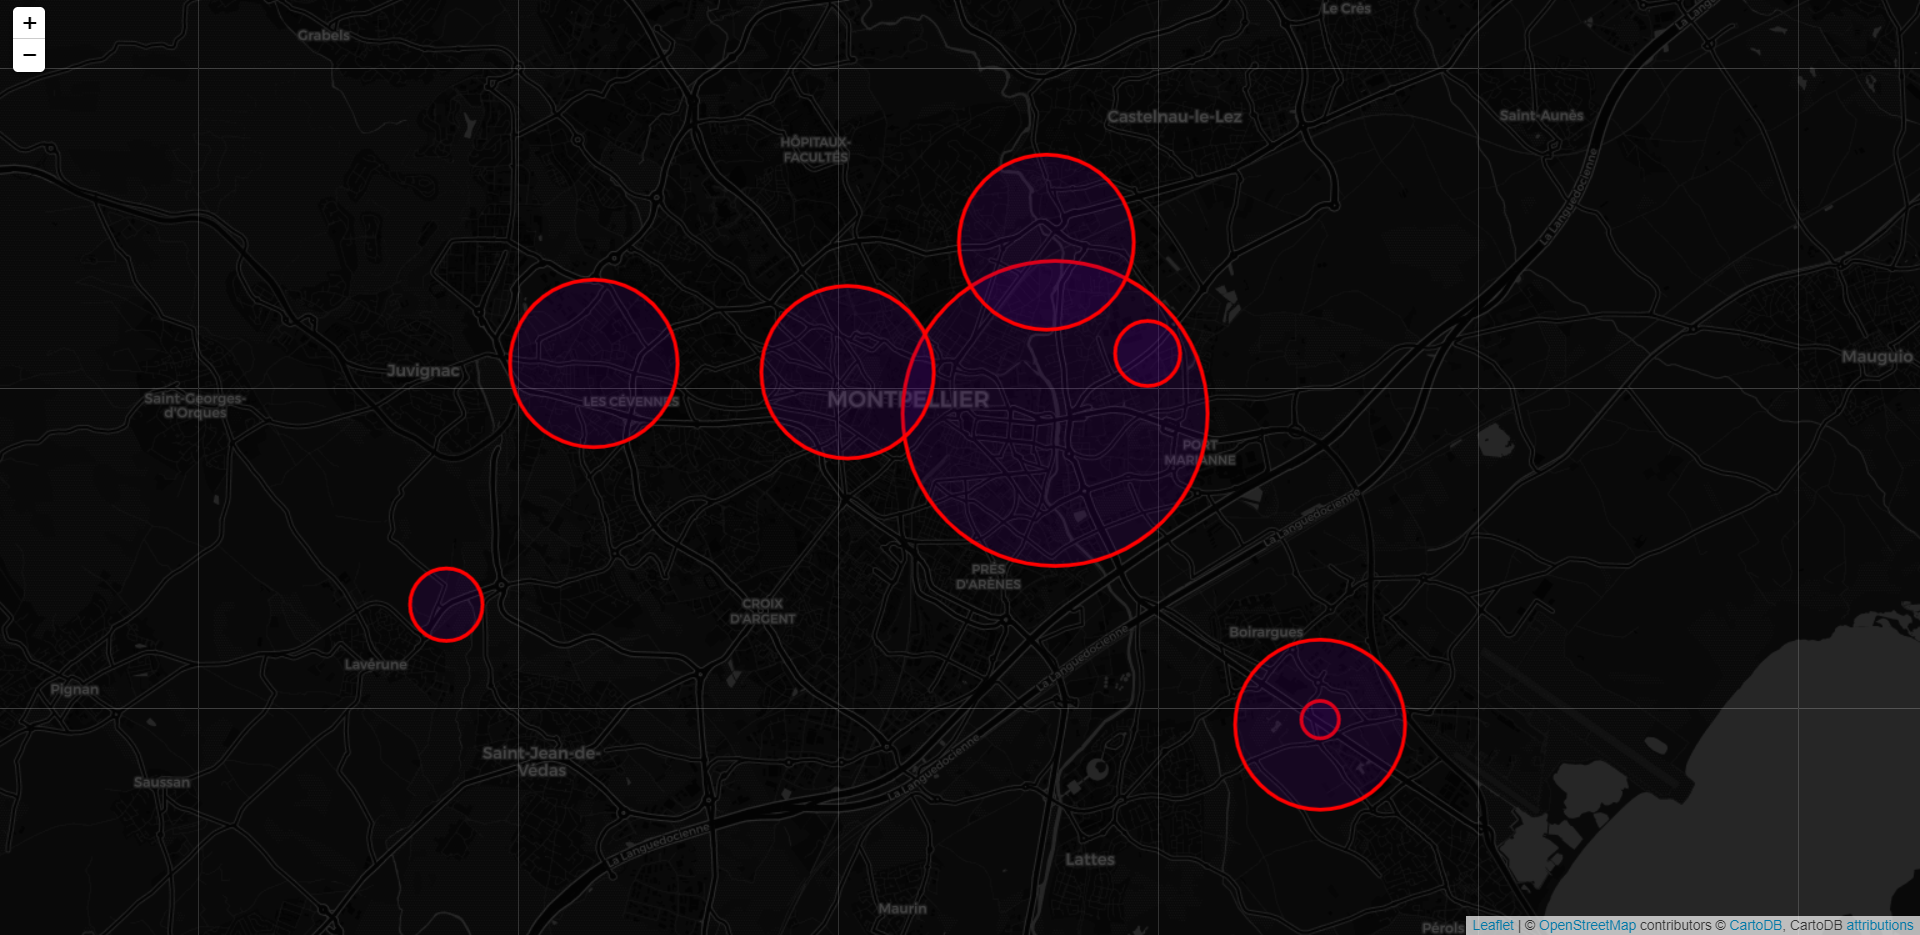
In the visualization part, we imported JSON files of each bike counter of Montpellier to make an animation via circles whose diameter changes according to the intensity of the bike traffic in each zone where a bike counter is located, via the folium package.
The animation is in .mp4 format (Animation.mp4) in the visualisation folder to download (the animation is not optimal due to many problems encountered)


